Zip Codes with the Highest Percentage of Families with Income Below $10,000 in Gardnerville, NV
RELATED REPORTS & OPTIONS
Family Income | $0-10k
Gardnerville
Compare Zip Codes
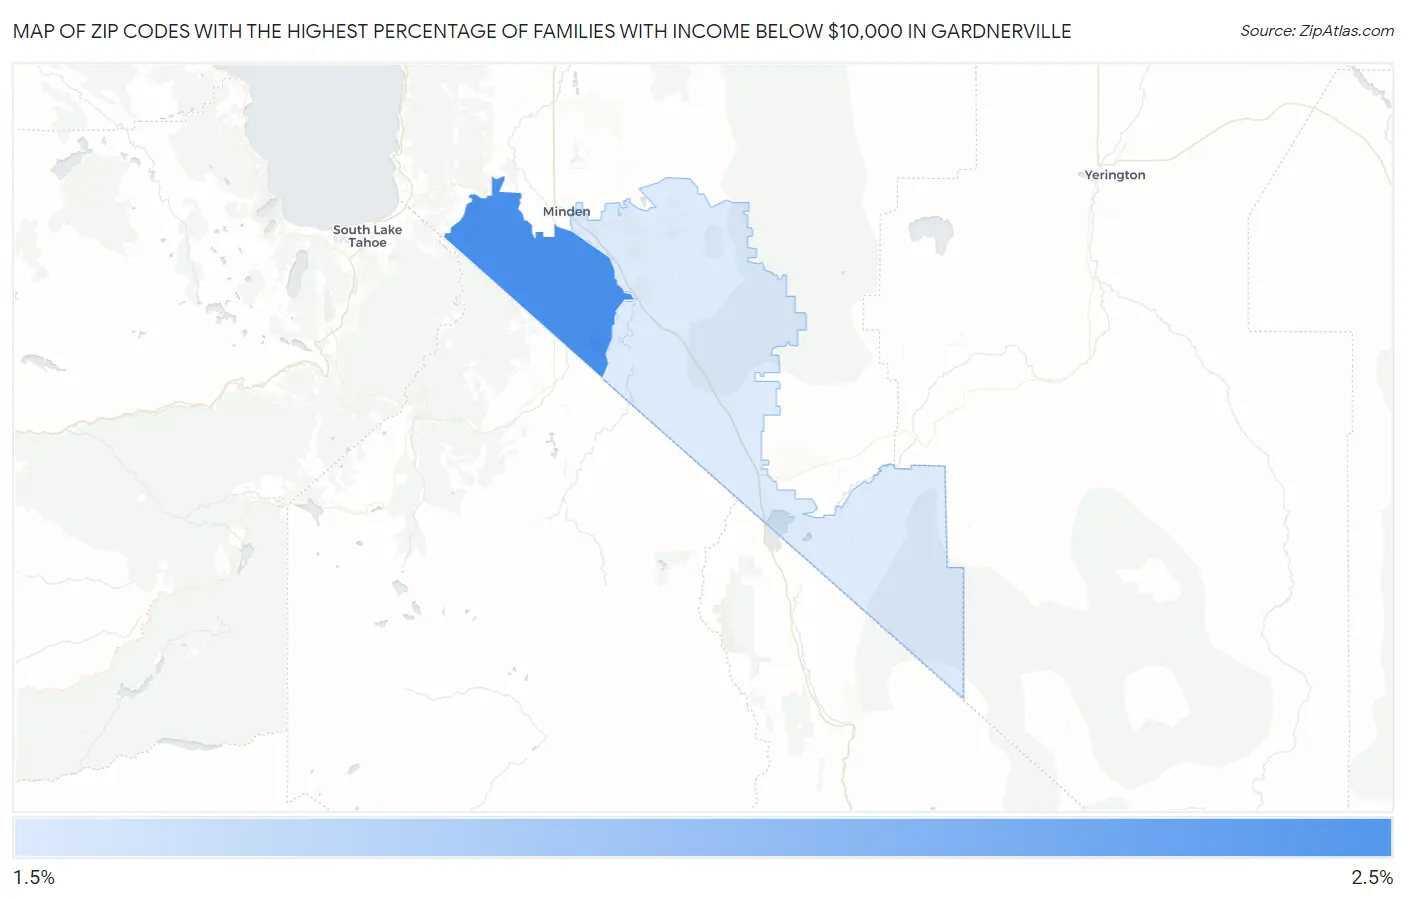
Map of Zip Codes with the Highest Percentage of Families with Income Below $10,000 in Gardnerville
2.2%
2.5%
Zip Codes with the Highest Percentage of Families with Income Below $10,000 in Gardnerville, NV
| Zip Code | Families with Income < $10k | vs State | vs National | |
| 1. | 89460 | 2.5% | 3.3%(-0.800)#71 | 3.1%(-0.600)#13,179 |
| 2. | 89410 | 2.2% | 3.3%(-1.10)#79 | 3.1%(-0.900)#14,488 |
1
Common Questions
What are the Top Zip Codes with the Highest Percentage of Families with Income Below $10,000 in Gardnerville, NV?
Top Zip Codes with the Highest Percentage of Families with Income Below $10,000 in Gardnerville, NV are:
What zip code has the Highest Percentage of Families with Income Below $10,000 in Gardnerville, NV?
89460 has the Highest Percentage of Families with Income Below $10,000 in Gardnerville, NV with 2.5%.
What is the Percentage of Families with Income Below $10,000 in Gardnerville, NV?
Percentage of Families with Income Below $10,000 in Gardnerville is 3.0%.
What is the Percentage of Families with Income Below $10,000 in Nevada?
Percentage of Families with Income Below $10,000 in Nevada is 3.3%.
What is the Percentage of Families with Income Below $10,000 in the United States?
Percentage of Families with Income Below $10,000 in the United States is 3.1%.