Zip Codes with the Highest Percentage of Population Employed in Office & Administration in Gardnerville, NV
RELATED REPORTS & OPTIONS
Office & Administration
Gardnerville
Compare Zip Codes
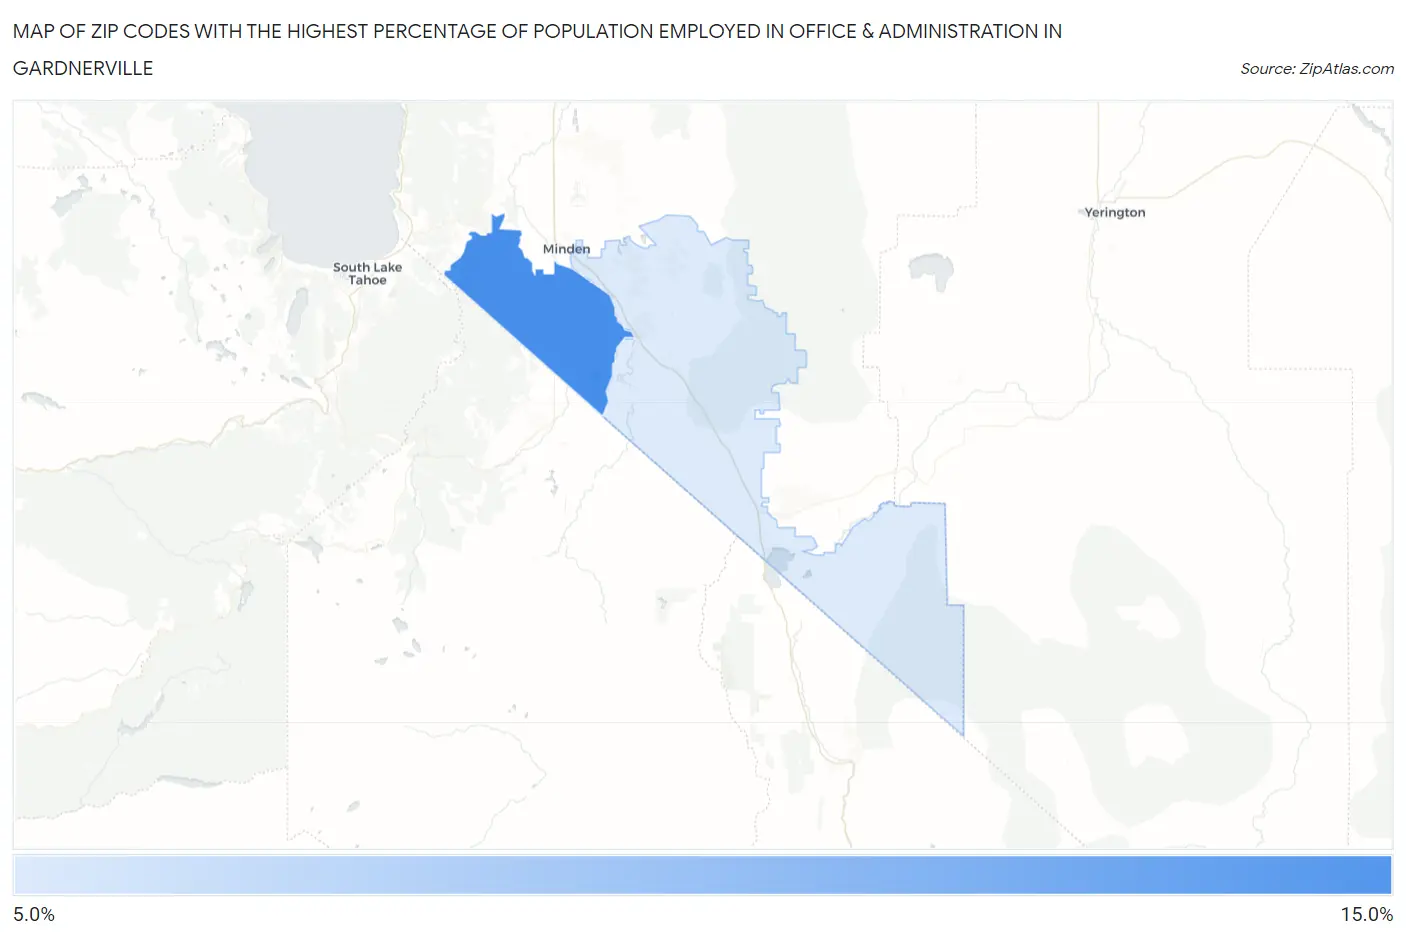
Map of Zip Codes with the Highest Percentage of Population Employed in Office & Administration in Gardnerville
12.3%
14.0%
Zip Codes with the Highest Percentage of Population Employed in Office & Administration in Gardnerville, NV
| Zip Code | % Employed | vs State | vs National | |
| 1. | 89460 | 14.0% | 11.8%(+2.20)#25 | 10.9%(+3.18)#5,963 |
| 2. | 89410 | 12.3% | 11.8%(+0.495)#52 | 10.9%(+1.47)#9,779 |
1
Common Questions
What are the Top Zip Codes with the Highest Percentage of Population Employed in Office & Administration in Gardnerville, NV?
Top Zip Codes with the Highest Percentage of Population Employed in Office & Administration in Gardnerville, NV are:
What zip code has the Highest Percentage of Population Employed in Office & Administration in Gardnerville, NV?
89460 has the Highest Percentage of Population Employed in Office & Administration in Gardnerville, NV with 14.0%.
What is the Percentage of Population Employed in Office & Administration in Gardnerville, NV?
Percentage of Population Employed in Office & Administration in Gardnerville is 12.6%.
What is the Percentage of Population Employed in Office & Administration in Nevada?
Percentage of Population Employed in Office & Administration in Nevada is 11.8%.
What is the Percentage of Population Employed in Office & Administration in the United States?
Percentage of Population Employed in Office & Administration in the United States is 10.9%.