Zip Codes with the Highest Percentage of Households with Income Below $10,000 in Plainfield, NJ
RELATED REPORTS & OPTIONS
Household Income | $0-10k
Plainfield
Compare Zip Codes
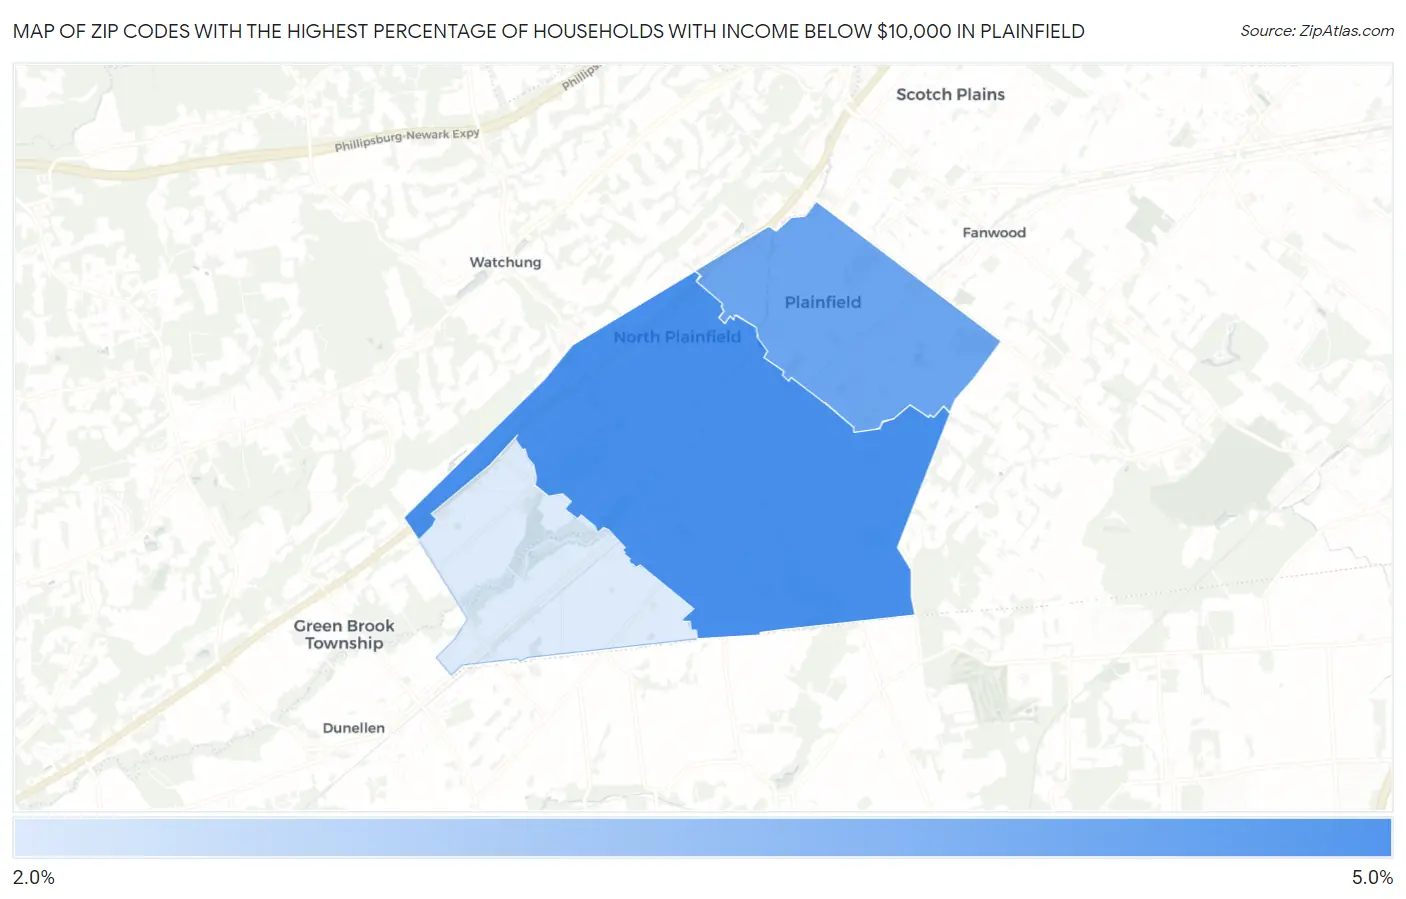
Map of Zip Codes with the Highest Percentage of Households with Income Below $10,000 in Plainfield
2.2%
4.6%
Zip Codes with the Highest Percentage of Households with Income Below $10,000 in Plainfield, NJ
| Zip Code | Households with Income < $10k | vs State | vs National | |
| 1. | 07060 | 4.6% | 4.1%(+0.500)#142 | 4.9%(-0.300)#12,971 |
| 2. | 07062 | 4.0% | 4.1%(-0.100)#172 | 4.9%(-0.900)#15,323 |
| 3. | 07063 | 2.2% | 4.1%(-1.90)#354 | 4.9%(-2.70)#22,924 |
1
Common Questions
What are the Top Zip Codes with the Highest Percentage of Households with Income Below $10,000 in Plainfield, NJ?
Top Zip Codes with the Highest Percentage of Households with Income Below $10,000 in Plainfield, NJ are:
What zip code has the Highest Percentage of Households with Income Below $10,000 in Plainfield, NJ?
07060 has the Highest Percentage of Households with Income Below $10,000 in Plainfield, NJ with 4.6%.
What is the Percentage of Households with Income Below $10,000 in Plainfield, NJ?
Percentage of Households with Income Below $10,000 in Plainfield is 4.0%.
What is the Percentage of Households with Income Below $10,000 in New Jersey?
Percentage of Households with Income Below $10,000 in New Jersey is 4.1%.
What is the Percentage of Households with Income Below $10,000 in the United States?
Percentage of Households with Income Below $10,000 in the United States is 4.9%.