Zip Codes with the Highest Percentage of Population Employed in Computer & Mathematics in Wichita, KS
RELATED REPORTS & OPTIONS
Computer & Mathematics
Wichita
Compare Zip Codes
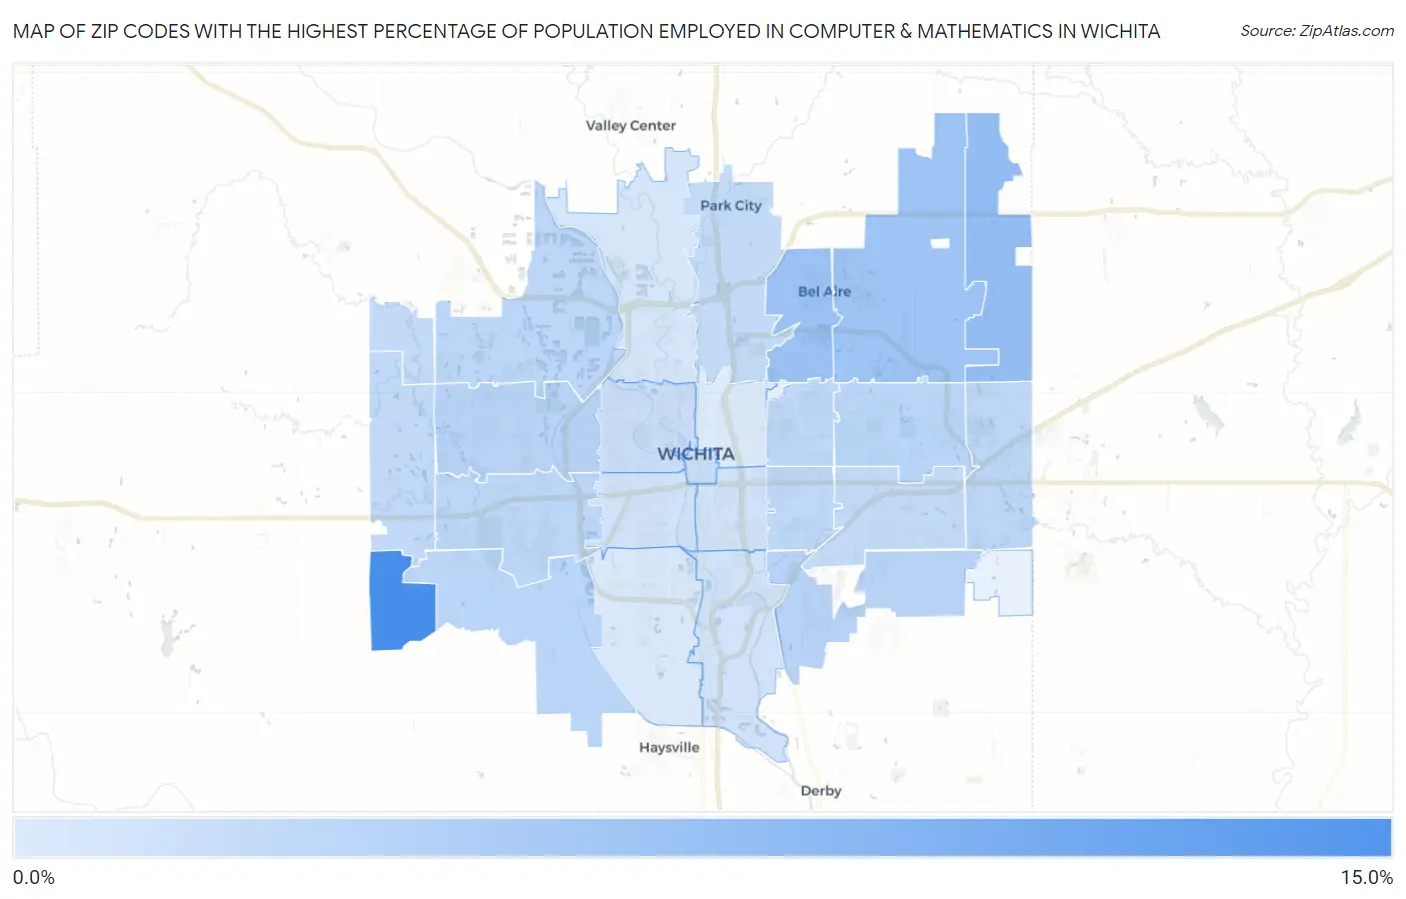
Map of Zip Codes with the Highest Percentage of Population Employed in Computer & Mathematics in Wichita
0.61%
10.6%
Zip Codes with the Highest Percentage of Population Employed in Computer & Mathematics in Wichita, KS
| Zip Code | % Employed | vs State | vs National | |
| 1. | 67227 | 10.6% | 3.0%(+7.60)#5 | 3.5%(+7.05)#619 |
| 2. | 67228 | 5.3% | 3.0%(+2.36)#36 | 3.5%(+1.81)#2,959 |
| 3. | 67220 | 4.9% | 3.0%(+1.96)#43 | 3.5%(+1.41)#3,438 |
| 4. | 67226 | 4.7% | 3.0%(+1.70)#53 | 3.5%(+1.16)#3,819 |
| 5. | 67210 | 3.0% | 3.0%(+0.069)#112 | 3.5%(-0.476)#7,570 |
| 6. | 67212 | 2.9% | 3.0%(-0.058)#115 | 3.5%(-0.602)#8,031 |
| 7. | 67215 | 2.8% | 3.0%(-0.152)#119 | 3.5%(-0.696)#8,357 |
| 8. | 67206 | 2.8% | 3.0%(-0.178)#122 | 3.5%(-0.723)#8,441 |
| 9. | 67205 | 2.7% | 3.0%(-0.237)#126 | 3.5%(-0.782)#8,660 |
| 10. | 67230 | 2.7% | 3.0%(-0.278)#130 | 3.5%(-0.822)#8,813 |
| 11. | 67209 | 2.7% | 3.0%(-0.318)#135 | 3.5%(-0.862)#8,981 |
| 12. | 67208 | 2.6% | 3.0%(-0.408)#137 | 3.5%(-0.953)#9,315 |
| 13. | 67218 | 2.5% | 3.0%(-0.517)#147 | 3.5%(-1.06)#9,791 |
| 14. | 67235 | 2.3% | 3.0%(-0.632)#150 | 3.5%(-1.18)#10,236 |
| 15. | 67223 | 2.3% | 3.0%(-0.688)#155 | 3.5%(-1.23)#10,495 |
| 16. | 67219 | 2.3% | 3.0%(-0.711)#158 | 3.5%(-1.26)#10,603 |
| 17. | 67207 | 2.2% | 3.0%(-0.788)#166 | 3.5%(-1.33)#10,919 |
| 18. | 67202 | 1.9% | 3.0%(-1.08)#183 | 3.5%(-1.62)#12,298 |
| 19. | 67203 | 1.7% | 3.0%(-1.24)#188 | 3.5%(-1.78)#13,003 |
| 20. | 67213 | 1.3% | 3.0%(-1.68)#232 | 3.5%(-2.23)#15,538 |
| 21. | 67216 | 1.3% | 3.0%(-1.70)#233 | 3.5%(-2.24)#15,610 |
| 22. | 67211 | 1.3% | 3.0%(-1.70)#236 | 3.5%(-2.25)#15,666 |
| 23. | 67204 | 1.1% | 3.0%(-1.88)#258 | 3.5%(-2.43)#16,763 |
| 24. | 67217 | 0.81% | 3.0%(-2.17)#294 | 3.5%(-2.71)#18,553 |
| 25. | 67214 | 0.61% | 3.0%(-2.37)#322 | 3.5%(-2.91)#19,780 |
1
Common Questions
What are the Top 10 Zip Codes with the Highest Percentage of Population Employed in Computer & Mathematics in Wichita, KS?
Top 10 Zip Codes with the Highest Percentage of Population Employed in Computer & Mathematics in Wichita, KS are:
What zip code has the Highest Percentage of Population Employed in Computer & Mathematics in Wichita, KS?
67227 has the Highest Percentage of Population Employed in Computer & Mathematics in Wichita, KS with 10.6%.
What is the Percentage of Population Employed in Computer & Mathematics in Wichita, KS?
Percentage of Population Employed in Computer & Mathematics in Wichita is 2.3%.
What is the Percentage of Population Employed in Computer & Mathematics in Kansas?
Percentage of Population Employed in Computer & Mathematics in Kansas is 3.0%.
What is the Percentage of Population Employed in Computer & Mathematics in the United States?
Percentage of Population Employed in Computer & Mathematics in the United States is 3.5%.