Zip Codes with the Highest Percentage of Population Employed in Architecture & Engineering in Wheaton, IL
RELATED REPORTS & OPTIONS
Architecture & Engineering
Wheaton
Compare Zip Codes
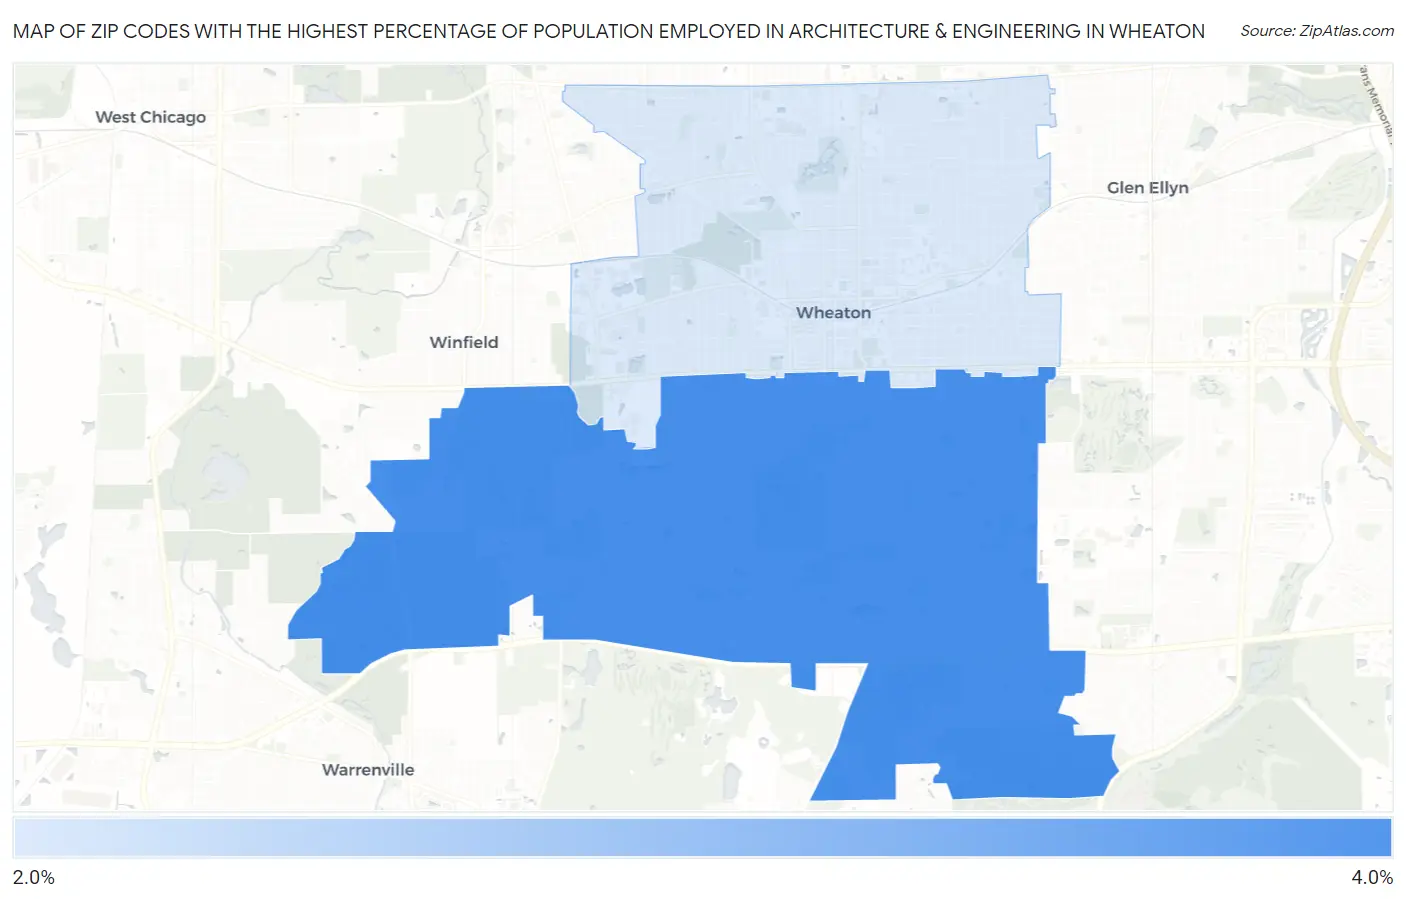
Map of Zip Codes with the Highest Percentage of Population Employed in Architecture & Engineering in Wheaton
2.2%
3.6%
Zip Codes with the Highest Percentage of Population Employed in Architecture & Engineering in Wheaton, IL
| Zip Code | % Employed | vs State | vs National | |
| 1. | 60189 | 3.6% | 1.9%(+1.70)#122 | 2.1%(+1.45)#3,518 |
| 2. | 60187 | 2.2% | 1.9%(+0.328)#325 | 2.1%(+0.073)#8,353 |
1
Common Questions
What are the Top Zip Codes with the Highest Percentage of Population Employed in Architecture & Engineering in Wheaton, IL?
Top Zip Codes with the Highest Percentage of Population Employed in Architecture & Engineering in Wheaton, IL are:
What zip code has the Highest Percentage of Population Employed in Architecture & Engineering in Wheaton, IL?
60189 has the Highest Percentage of Population Employed in Architecture & Engineering in Wheaton, IL with 3.6%.
What is the Percentage of Population Employed in Architecture & Engineering in Wheaton, IL?
Percentage of Population Employed in Architecture & Engineering in Wheaton is 3.0%.
What is the Percentage of Population Employed in Architecture & Engineering in Illinois?
Percentage of Population Employed in Architecture & Engineering in Illinois is 1.9%.
What is the Percentage of Population Employed in Architecture & Engineering in the United States?
Percentage of Population Employed in Architecture & Engineering in the United States is 2.1%.