Zip Codes with the Highest Percentage of Population Employed in Health Diagnosing & Treating in Wheaton, IL
RELATED REPORTS & OPTIONS
Health Diagnosing & Treating
Wheaton
Compare Zip Codes
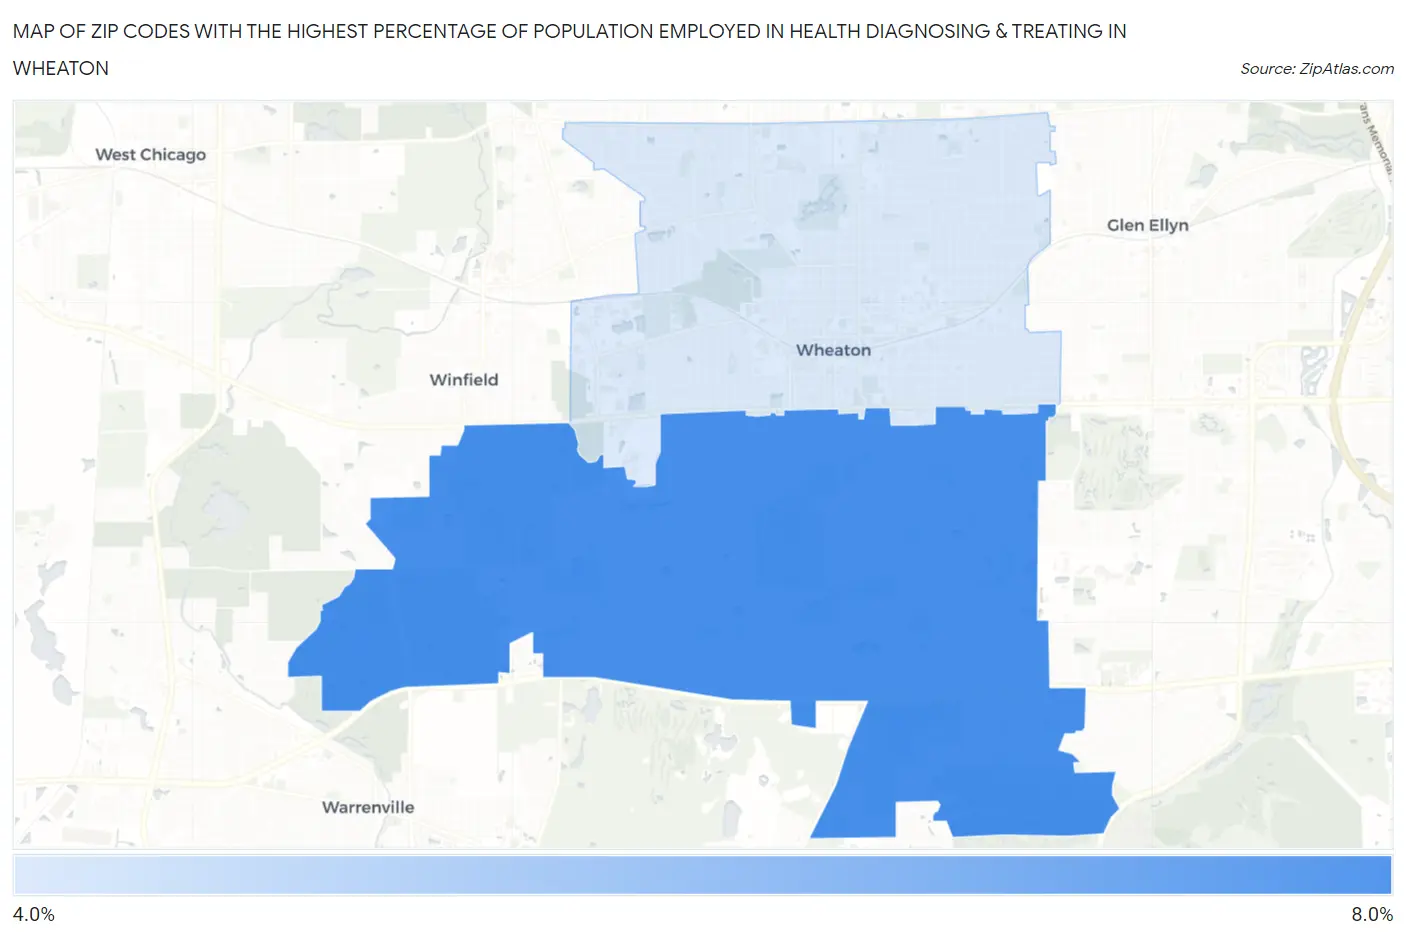
Map of Zip Codes with the Highest Percentage of Population Employed in Health Diagnosing & Treating in Wheaton
4.9%
6.9%
Zip Codes with the Highest Percentage of Population Employed in Health Diagnosing & Treating in Wheaton, IL
| Zip Code | % Employed | vs State | vs National | |
| 1. | 60189 | 6.9% | 6.2%(+0.624)#510 | 6.2%(+0.616)#10,811 |
| 2. | 60187 | 4.9% | 6.2%(-1.32)#858 | 6.2%(-1.33)#18,014 |
1
Common Questions
What are the Top Zip Codes with the Highest Percentage of Population Employed in Health Diagnosing & Treating in Wheaton, IL?
Top Zip Codes with the Highest Percentage of Population Employed in Health Diagnosing & Treating in Wheaton, IL are:
What zip code has the Highest Percentage of Population Employed in Health Diagnosing & Treating in Wheaton, IL?
60189 has the Highest Percentage of Population Employed in Health Diagnosing & Treating in Wheaton, IL with 6.9%.
What is the Percentage of Population Employed in Health Diagnosing & Treating in Wheaton, IL?
Percentage of Population Employed in Health Diagnosing & Treating in Wheaton is 6.0%.
What is the Percentage of Population Employed in Health Diagnosing & Treating in Illinois?
Percentage of Population Employed in Health Diagnosing & Treating in Illinois is 6.2%.
What is the Percentage of Population Employed in Health Diagnosing & Treating in the United States?
Percentage of Population Employed in Health Diagnosing & Treating in the United States is 6.2%.