Zip Codes with the Highest Percentage of Population Employed in Community & Social Service in Rockford, IL
RELATED REPORTS & OPTIONS
Community & Social Service
Rockford
Compare Zip Codes
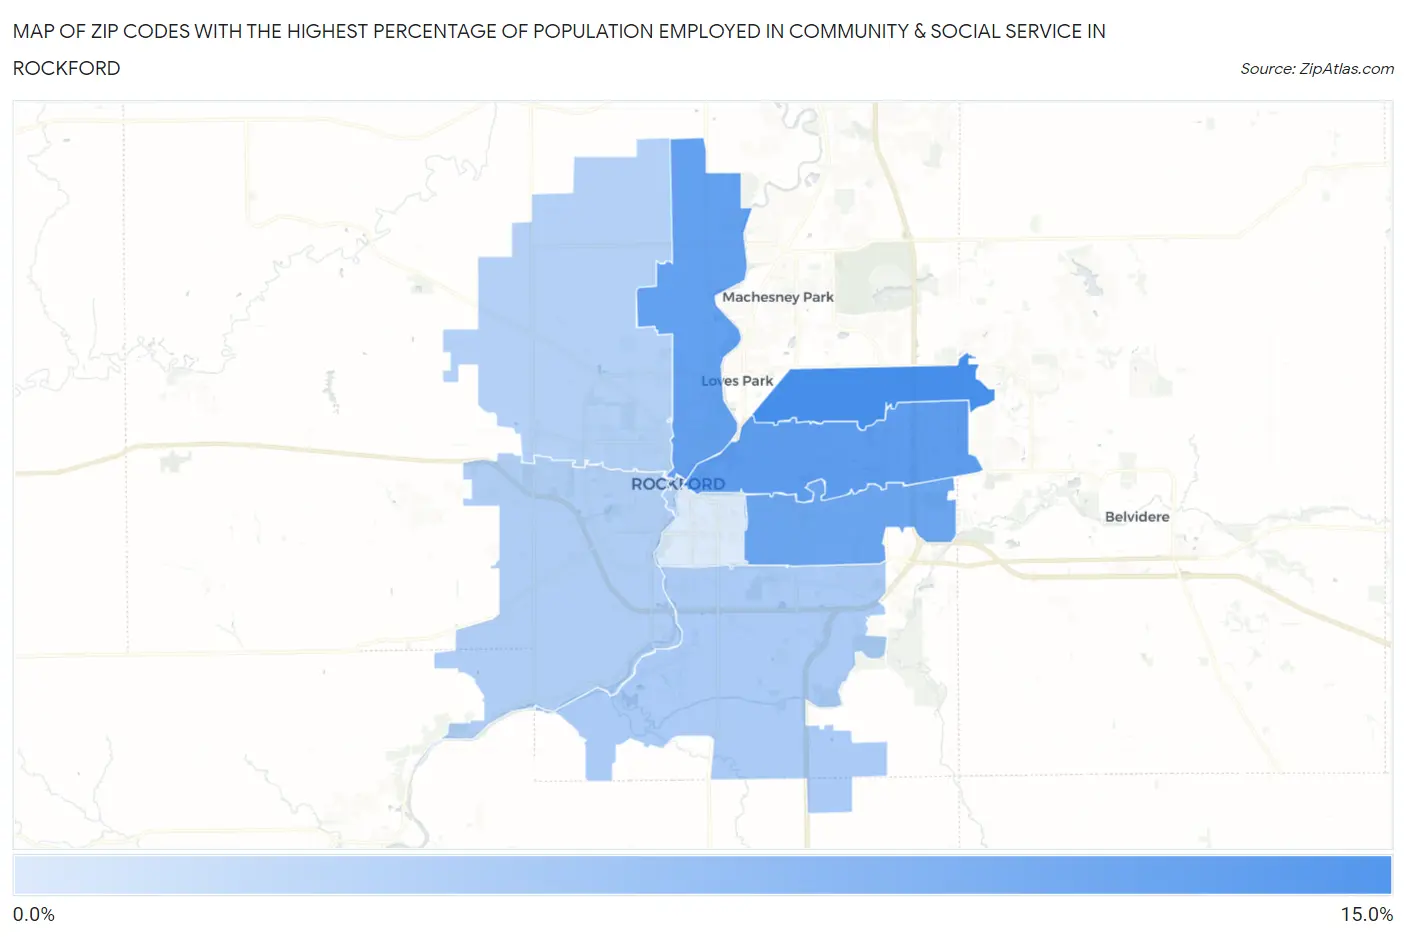
Map of Zip Codes with the Highest Percentage of Population Employed in Community & Social Service in Rockford
3.8%
11.3%
Zip Codes with the Highest Percentage of Population Employed in Community & Social Service in Rockford, IL
| Zip Code | % Employed | vs State | vs National | |
| 1. | 61114 | 11.3% | 11.3%(+0.057)#362 | 11.2%(+0.123)#10,816 |
| 2. | 61107 | 10.2% | 11.3%(-1.12)#506 | 11.2%(-1.05)#13,715 |
| 3. | 61103 | 9.9% | 11.3%(-1.41)#535 | 11.2%(-1.34)#14,472 |
| 4. | 61108 | 9.4% | 11.3%(-1.89)#593 | 11.2%(-1.82)#15,711 |
| 5. | 61109 | 6.3% | 11.3%(-5.01)#945 | 11.2%(-4.94)#23,774 |
| 6. | 61102 | 6.1% | 11.3%(-5.22)#963 | 11.2%(-5.15)#24,252 |
| 7. | 61101 | 5.9% | 11.3%(-5.41)#985 | 11.2%(-5.34)#24,631 |
| 8. | 61104 | 3.8% | 11.3%(-7.48)#1,157 | 11.2%(-7.41)#27,801 |
1
Common Questions
What are the Top 5 Zip Codes with the Highest Percentage of Population Employed in Community & Social Service in Rockford, IL?
Top 5 Zip Codes with the Highest Percentage of Population Employed in Community & Social Service in Rockford, IL are:
What zip code has the Highest Percentage of Population Employed in Community & Social Service in Rockford, IL?
61114 has the Highest Percentage of Population Employed in Community & Social Service in Rockford, IL with 11.3%.
What is the Percentage of Population Employed in Community & Social Service in Rockford, IL?
Percentage of Population Employed in Community & Social Service in Rockford is 8.3%.
What is the Percentage of Population Employed in Community & Social Service in Illinois?
Percentage of Population Employed in Community & Social Service in Illinois is 11.3%.
What is the Percentage of Population Employed in Community & Social Service in the United States?
Percentage of Population Employed in Community & Social Service in the United States is 11.2%.