Zip Codes with the Highest Percentage of Population Employed in Legal Services & Support in Rockford, IL
RELATED REPORTS & OPTIONS
Legal Services & Support
Rockford
Compare Zip Codes
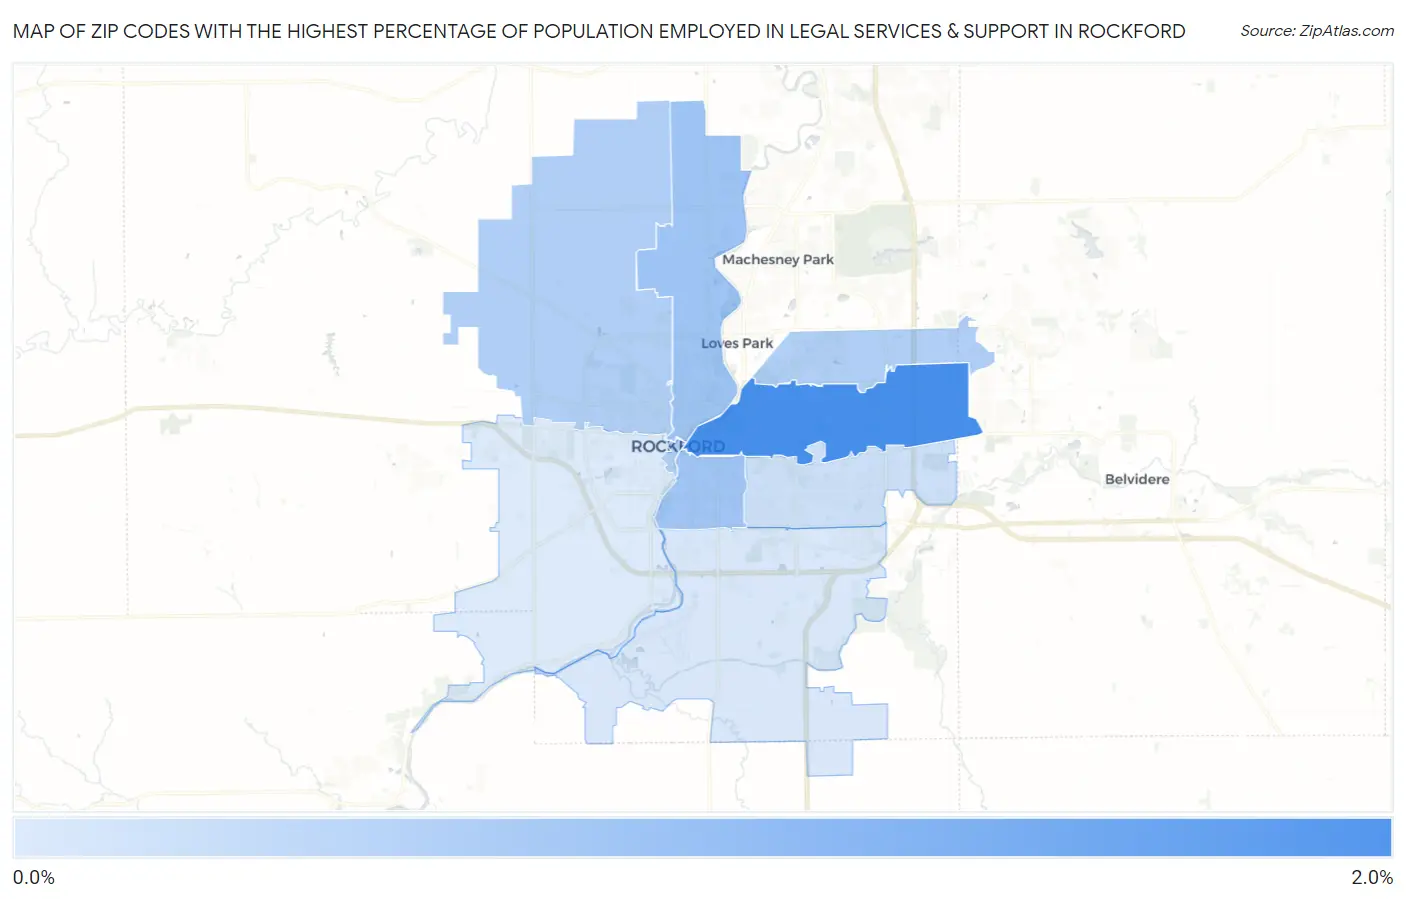
Map of Zip Codes with the Highest Percentage of Population Employed in Legal Services & Support in Rockford
0.091%
1.7%
Zip Codes with the Highest Percentage of Population Employed in Legal Services & Support in Rockford, IL
| Zip Code | % Employed | vs State | vs National | |
| 1. | 61107 | 1.7% | 1.3%(+0.393)#161 | 1.2%(+0.558)#4,167 |
| 2. | 61103 | 0.77% | 1.3%(-0.576)#358 | 1.2%(-0.410)#9,707 |
| 3. | 61104 | 0.75% | 1.3%(-0.601)#368 | 1.2%(-0.435)#9,944 |
| 4. | 61101 | 0.58% | 1.3%(-0.772)#457 | 1.2%(-0.607)#11,730 |
| 5. | 61114 | 0.57% | 1.3%(-0.781)#460 | 1.2%(-0.616)#11,845 |
| 6. | 61108 | 0.27% | 1.3%(-1.08)#627 | 1.2%(-0.919)#15,451 |
| 7. | 61109 | 0.15% | 1.3%(-1.20)#680 | 1.2%(-1.03)#16,682 |
| 8. | 61102 | 0.091% | 1.3%(-1.26)#692 | 1.2%(-1.09)#17,194 |
1
Common Questions
What are the Top 5 Zip Codes with the Highest Percentage of Population Employed in Legal Services & Support in Rockford, IL?
Top 5 Zip Codes with the Highest Percentage of Population Employed in Legal Services & Support in Rockford, IL are:
What zip code has the Highest Percentage of Population Employed in Legal Services & Support in Rockford, IL?
61107 has the Highest Percentage of Population Employed in Legal Services & Support in Rockford, IL with 1.7%.
What is the Percentage of Population Employed in Legal Services & Support in Rockford, IL?
Percentage of Population Employed in Legal Services & Support in Rockford is 0.73%.
What is the Percentage of Population Employed in Legal Services & Support in Illinois?
Percentage of Population Employed in Legal Services & Support in Illinois is 1.3%.
What is the Percentage of Population Employed in Legal Services & Support in the United States?
Percentage of Population Employed in Legal Services & Support in the United States is 1.2%.