Zip Codes with the Highest Percentage of Immigrants from Eastern Asia in Rockford, IL
RELATED REPORTS & OPTIONS
Eastern Asia
Rockford
Compare Zip Codes
Map of Zip Codes with the Highest Percentage of Immigrants from Eastern Asia in Rockford
0.083%
1.19%
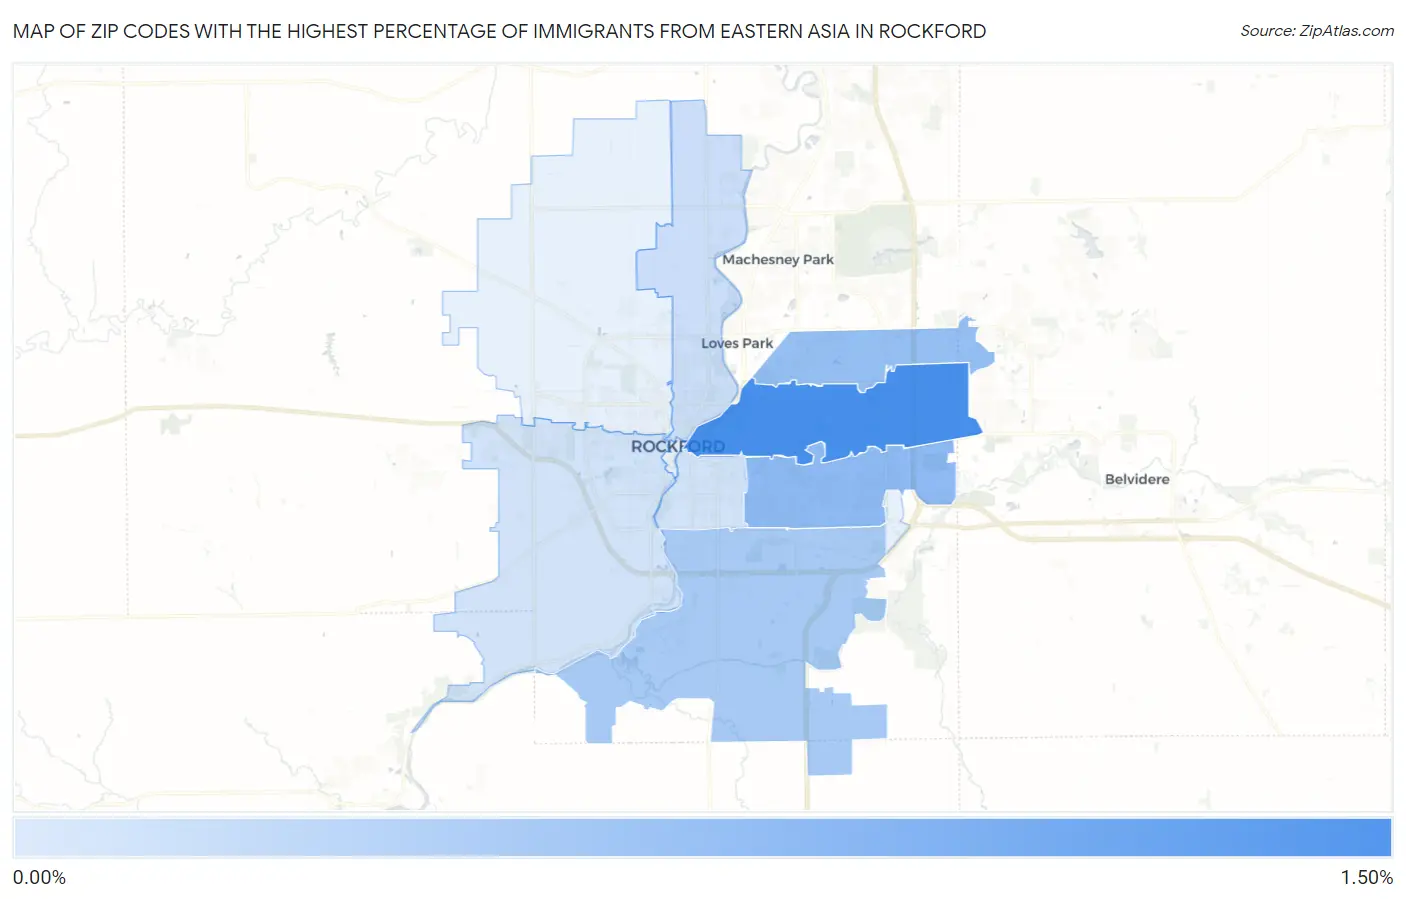
Zip Codes with the Highest Percentage of Immigrants from Eastern Asia in Rockford, IL
| Zip Code | Eastern Asia | vs State | vs National | |
| 1. | 61107 | 1.19% | 1.12% (+0.072)#119 | 1.28% (-0.081)#3,298 |
| 2. | 61108 | 0.63% | 1.12% (-0.496)#193 | 1.28% (-0.649)#5,667 |
| 3. | 61114 | 0.56% | 1.12% (-0.563)#202 | 1.28% (-0.716)#6,122 |
| 4. | 61109 | 0.42% | 1.12% (-0.698)#250 | 1.28% (-0.851)#7,316 |
| 5. | 61103 | 0.15% | 1.12% (-0.973)#435 | 1.28% (-1.13)#11,215 |
| 6. | 61104 | 0.087% | 1.12% (-1.04)#479 | 1.28% (-1.19)#12,446 |
| 7. | 61102 | 0.083% | 1.12% (-1.04)#487 | 1.28% (-1.19)#12,542 |
1
Common Questions
What are the Top 5 Zip Codes with the Highest Percentage of Immigrants from Eastern Asia in Rockford, IL?
Top 5 Zip Codes with the Highest Percentage of Immigrants from Eastern Asia in Rockford, IL are:
What zip code has the Highest Percentage of Immigrants from Eastern Asia in Rockford, IL?
61107 has the Highest Percentage of Immigrants from Eastern Asia in Rockford, IL with 1.19%.
What is the Percentage of Immigrants from Eastern Asia in Rockford, IL?
Percentage of Immigrants from Eastern Asia in Rockford is 0.45%.
What is the Percentage of Immigrants from Eastern Asia in Illinois?
Percentage of Immigrants from Eastern Asia in Illinois is 1.12%.
What is the Percentage of Immigrants from Eastern Asia in the United States?
Percentage of Immigrants from Eastern Asia in the United States is 1.28%.