Zip Codes with the Highest Percentage of Immigrants from Asia in Rockford, IL
RELATED REPORTS & OPTIONS
Asia
Rockford
Compare Zip Codes
Map of Zip Codes with the Highest Percentage of Immigrants from Asia in Rockford
0.65%
6.24%
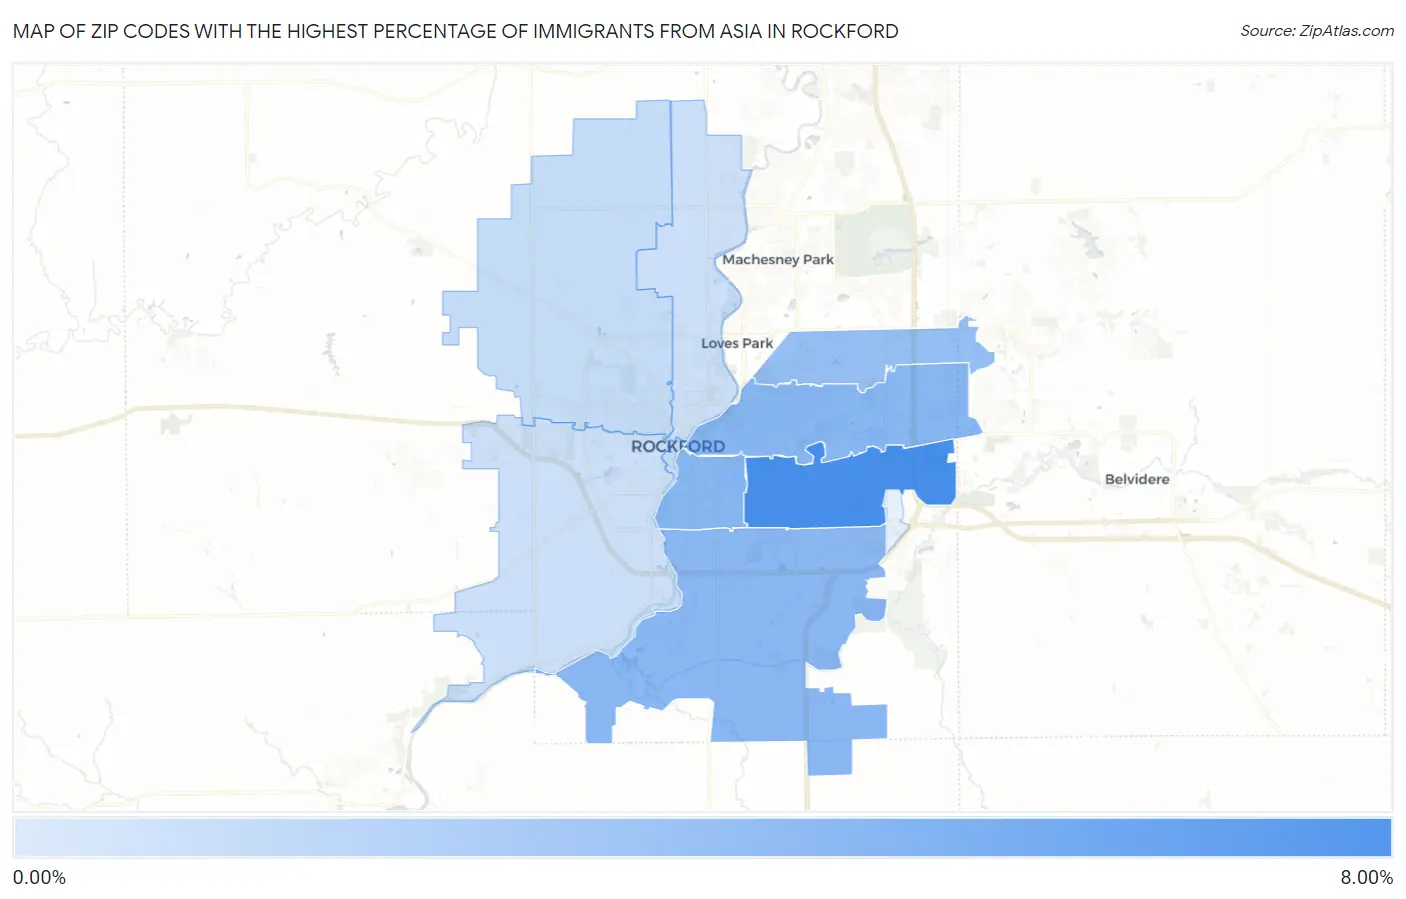
Zip Codes with the Highest Percentage of Immigrants from Asia in Rockford, IL
| Zip Code | Asia | vs State | vs National | |
| 1. | 61108 | 6.24% | 4.39% (+1.85)#106 | 4.26% (+1.98)#2,360 |
| 2. | 61104 | 3.51% | 4.39% (-0.885)#173 | 4.26% (-0.753)#4,282 |
| 3. | 61107 | 3.51% | 4.39% (-0.887)#174 | 4.26% (-0.755)#4,285 |
| 4. | 61109 | 3.37% | 4.39% (-1.02)#179 | 4.26% (-0.891)#4,452 |
| 5. | 61114 | 2.88% | 4.39% (-1.51)#207 | 4.26% (-1.38)#5,077 |
| 6. | 61101 | 0.91% | 4.39% (-3.48)#390 | 4.26% (-3.35)#10,826 |
| 7. | 61103 | 0.70% | 4.39% (-3.69)#437 | 4.26% (-3.56)#12,183 |
| 8. | 61102 | 0.65% | 4.39% (-3.74)#458 | 4.26% (-3.61)#12,543 |
1
Common Questions
What are the Top 5 Zip Codes with the Highest Percentage of Immigrants from Asia in Rockford, IL?
Top 5 Zip Codes with the Highest Percentage of Immigrants from Asia in Rockford, IL are:
What zip code has the Highest Percentage of Immigrants from Asia in Rockford, IL?
61108 has the Highest Percentage of Immigrants from Asia in Rockford, IL with 6.24%.
What is the Percentage of Immigrants from Asia in Rockford, IL?
Percentage of Immigrants from Asia in Rockford is 3.18%.
What is the Percentage of Immigrants from Asia in Illinois?
Percentage of Immigrants from Asia in Illinois is 4.39%.
What is the Percentage of Immigrants from Asia in the United States?
Percentage of Immigrants from Asia in the United States is 4.26%.