Zip Codes with the Highest Percentage of Population Employed in Architecture & Engineering in Elgin, IL
RELATED REPORTS & OPTIONS
Architecture & Engineering
Elgin
Compare Zip Codes
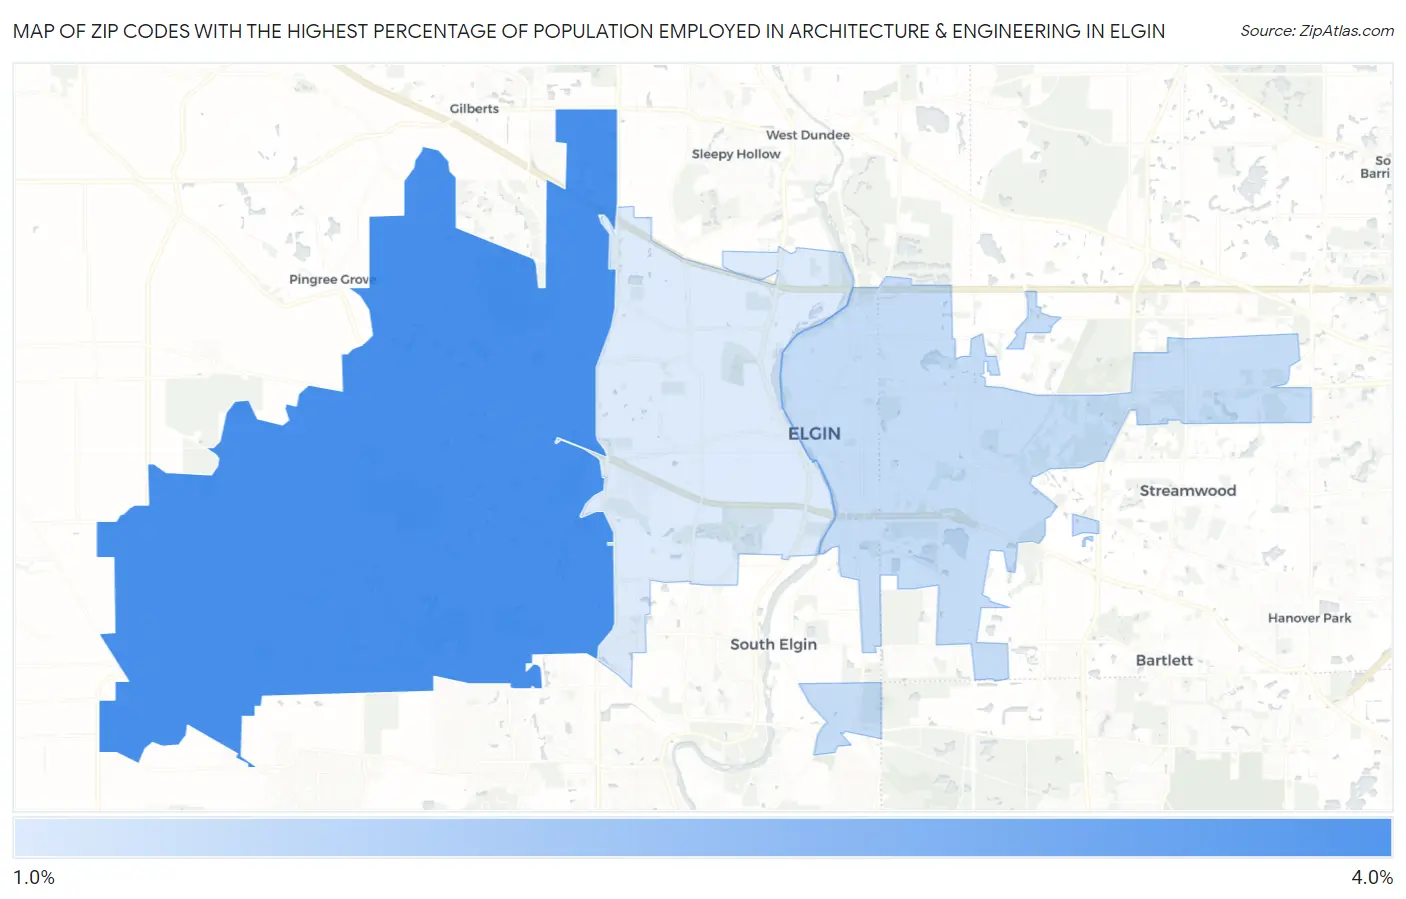
Map of Zip Codes with the Highest Percentage of Population Employed in Architecture & Engineering in Elgin
1.8%
3.5%
Zip Codes with the Highest Percentage of Population Employed in Architecture & Engineering in Elgin, IL
| Zip Code | % Employed | vs State | vs National | |
| 1. | 60124 | 3.5% | 1.9%(+1.61)#134 | 2.1%(+1.35)#3,736 |
| 2. | 60120 | 2.0% | 1.9%(+0.118)#381 | 2.1%(-0.137)#9,533 |
| 3. | 60123 | 1.8% | 1.9%(-0.134)#471 | 2.1%(-0.389)#11,070 |
1
Common Questions
What are the Top Zip Codes with the Highest Percentage of Population Employed in Architecture & Engineering in Elgin, IL?
Top Zip Codes with the Highest Percentage of Population Employed in Architecture & Engineering in Elgin, IL are:
What zip code has the Highest Percentage of Population Employed in Architecture & Engineering in Elgin, IL?
60124 has the Highest Percentage of Population Employed in Architecture & Engineering in Elgin, IL with 3.5%.
What is the Percentage of Population Employed in Architecture & Engineering in Elgin, IL?
Percentage of Population Employed in Architecture & Engineering in Elgin is 2.2%.
What is the Percentage of Population Employed in Architecture & Engineering in Illinois?
Percentage of Population Employed in Architecture & Engineering in Illinois is 1.9%.
What is the Percentage of Population Employed in Architecture & Engineering in the United States?
Percentage of Population Employed in Architecture & Engineering in the United States is 2.1%.