Zip Codes with the Highest Percentage of Population Employed in Architecture & Engineering in Mchenry, IL
RELATED REPORTS & OPTIONS
Architecture & Engineering
Mchenry
Compare Zip Codes
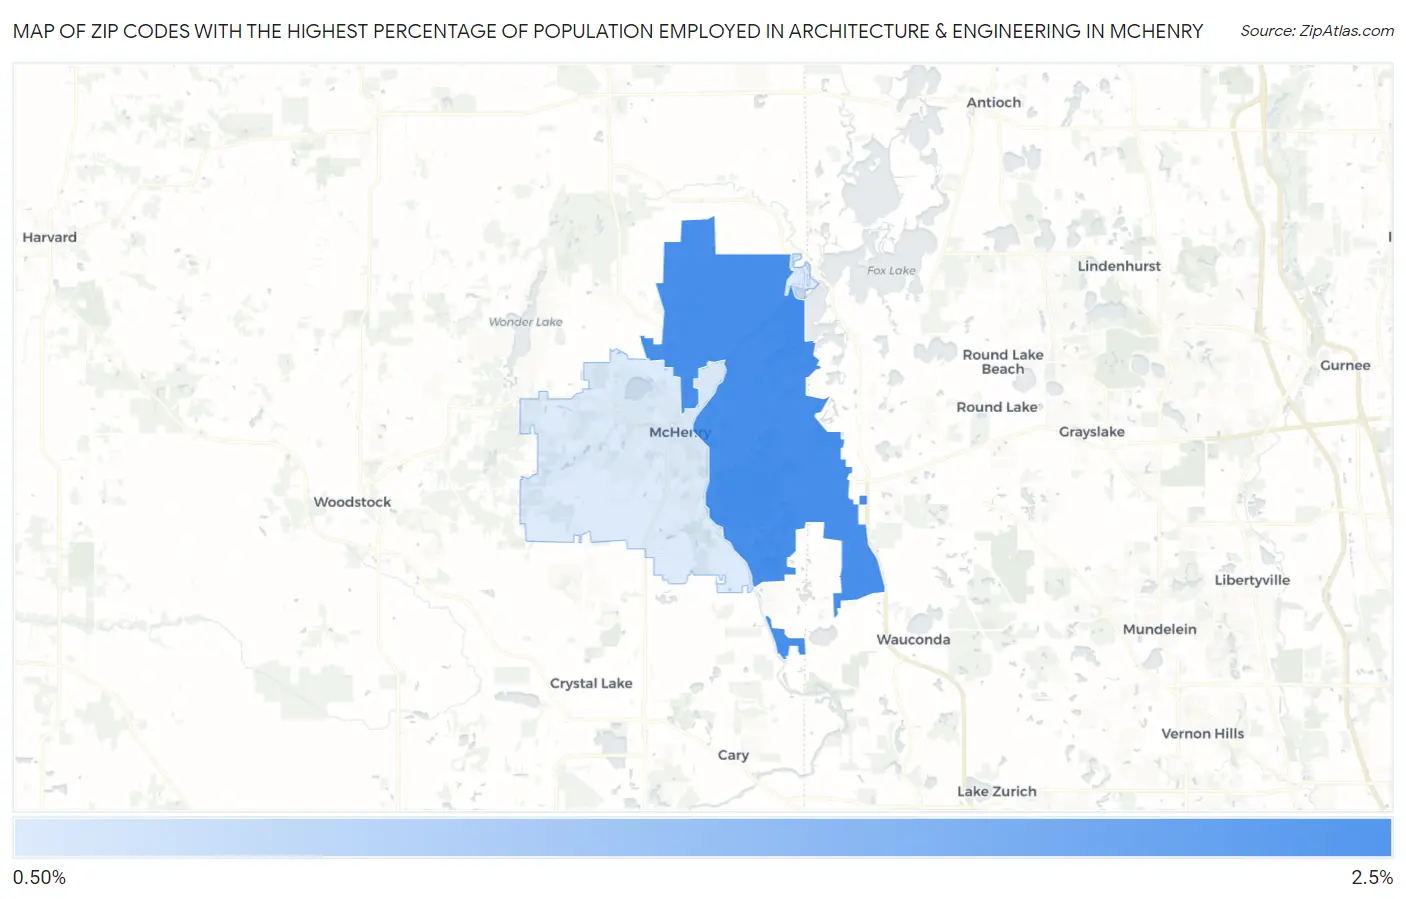
Map of Zip Codes with the Highest Percentage of Population Employed in Architecture & Engineering in Mchenry
1.2%
2.3%
Zip Codes with the Highest Percentage of Population Employed in Architecture & Engineering in Mchenry, IL
| Zip Code | % Employed | vs State | vs National | |
| 1. | 60051 | 2.3% | 1.9%(+0.408)#308 | 2.1%(+0.153)#7,926 |
| 2. | 60050 | 1.2% | 1.9%(-0.693)#631 | 2.1%(-0.948)#15,060 |
1
Common Questions
What are the Top Zip Codes with the Highest Percentage of Population Employed in Architecture & Engineering in Mchenry, IL?
Top Zip Codes with the Highest Percentage of Population Employed in Architecture & Engineering in Mchenry, IL are:
What zip code has the Highest Percentage of Population Employed in Architecture & Engineering in Mchenry, IL?
60051 has the Highest Percentage of Population Employed in Architecture & Engineering in Mchenry, IL with 2.3%.
What is the Percentage of Population Employed in Architecture & Engineering in Mchenry, IL?
Percentage of Population Employed in Architecture & Engineering in Mchenry is 1.1%.
What is the Percentage of Population Employed in Architecture & Engineering in Illinois?
Percentage of Population Employed in Architecture & Engineering in Illinois is 1.9%.
What is the Percentage of Population Employed in Architecture & Engineering in the United States?
Percentage of Population Employed in Architecture & Engineering in the United States is 2.1%.