Zip Codes with the Highest Percentage of Population Employed in Accommodation & Food Services in Tampa, FL
RELATED REPORTS & OPTIONS
Accommodation & Food Services
Tampa
Compare Zip Codes
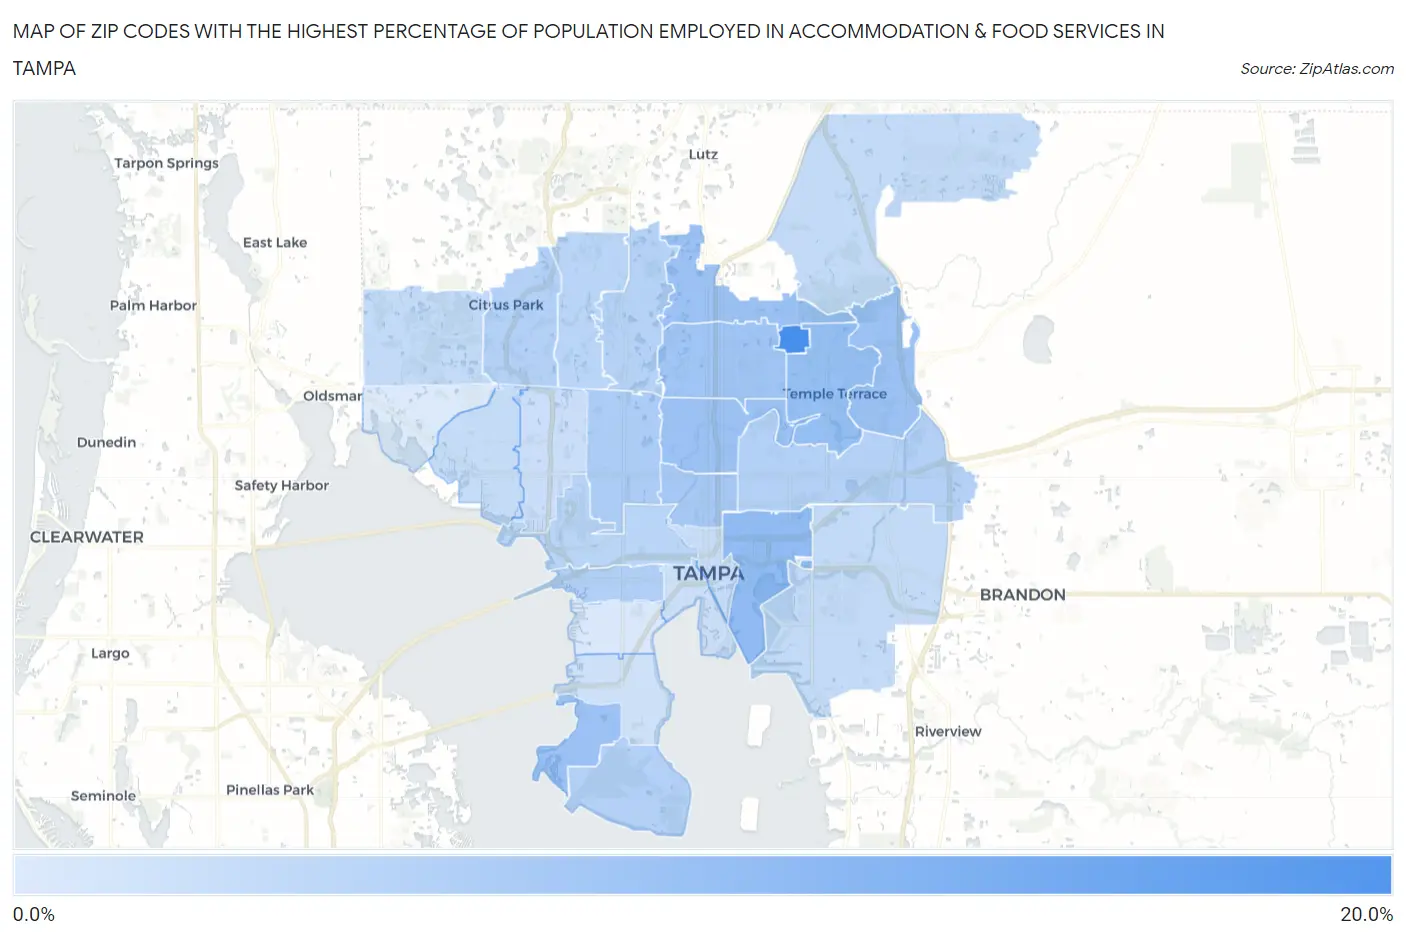
Map of Zip Codes with the Highest Percentage of Population Employed in Accommodation & Food Services in Tampa
4.1%
18.6%
Zip Codes with the Highest Percentage of Population Employed in Accommodation & Food Services in Tampa, FL
| Zip Code | % Employed | vs State | vs National | |
| 1. | 33620 | 18.6% | 8.4%(+10.2)#22 | 6.9%(+11.7)#1,008 |
| 2. | 33605 | 11.3% | 8.4%(+2.90)#168 | 6.9%(+4.39)#3,343 |
| 3. | 33617 | 10.7% | 8.4%(+2.30)#200 | 6.9%(+3.79)#3,822 |
| 4. | 33637 | 10.4% | 8.4%(+2.00)#219 | 6.9%(+3.49)#4,127 |
| 5. | 33613 | 10.2% | 8.4%(+1.85)#232 | 6.9%(+3.34)#4,279 |
| 6. | 33604 | 10.1% | 8.4%(+1.68)#248 | 6.9%(+3.17)#4,464 |
| 7. | 33616 | 10.0% | 8.4%(+1.67)#250 | 6.9%(+3.16)#4,487 |
| 8. | 33612 | 9.7% | 8.4%(+1.29)#292 | 6.9%(+2.78)#4,984 |
| 9. | 33603 | 9.2% | 8.4%(+0.865)#328 | 6.9%(+2.35)#5,604 |
| 10. | 33614 | 8.5% | 8.4%(+0.149)#403 | 6.9%(+1.64)#6,794 |
| 11. | 33609 | 8.1% | 8.4%(-0.293)#454 | 6.9%(+1.20)#7,668 |
| 12. | 33621 | 7.9% | 8.4%(-0.423)#465 | 6.9%(+1.07)#7,936 |
| 13. | 33610 | 7.9% | 8.4%(-0.449)#468 | 6.9%(+1.04)#7,982 |
| 14. | 33625 | 7.9% | 8.4%(-0.501)#474 | 6.9%(+0.988)#8,098 |
| 15. | 33618 | 7.6% | 8.4%(-0.736)#500 | 6.9%(+0.753)#8,670 |
| 16. | 33624 | 7.3% | 8.4%(-1.07)#531 | 6.9%(+0.420)#9,512 |
| 17. | 33607 | 7.2% | 8.4%(-1.18)#551 | 6.9%(+0.306)#9,842 |
| 18. | 33647 | 6.4% | 8.4%(-1.96)#649 | 6.9%(-0.468)#12,120 |
| 19. | 33619 | 6.4% | 8.4%(-1.98)#651 | 6.9%(-0.490)#12,191 |
| 20. | 33626 | 6.3% | 8.4%(-2.09)#664 | 6.9%(-0.599)#12,542 |
| 21. | 33615 | 6.2% | 8.4%(-2.19)#679 | 6.9%(-0.699)#12,861 |
| 22. | 33602 | 6.0% | 8.4%(-2.36)#699 | 6.9%(-0.875)#13,428 |
| 23. | 33634 | 5.7% | 8.4%(-2.68)#730 | 6.9%(-1.19)#14,425 |
| 24. | 33606 | 5.6% | 8.4%(-2.79)#737 | 6.9%(-1.30)#14,777 |
| 25. | 33611 | 5.3% | 8.4%(-3.06)#768 | 6.9%(-1.57)#15,749 |
| 26. | 33629 | 4.3% | 8.4%(-4.10)#846 | 6.9%(-2.61)#19,273 |
| 27. | 33635 | 4.1% | 8.4%(-4.31)#859 | 6.9%(-2.82)#19,956 |
1
Common Questions
What are the Top 10 Zip Codes with the Highest Percentage of Population Employed in Accommodation & Food Services in Tampa, FL?
Top 10 Zip Codes with the Highest Percentage of Population Employed in Accommodation & Food Services in Tampa, FL are:
What zip code has the Highest Percentage of Population Employed in Accommodation & Food Services in Tampa, FL?
33620 has the Highest Percentage of Population Employed in Accommodation & Food Services in Tampa, FL with 18.6%.
What is the Percentage of Population Employed in Accommodation & Food Services in Tampa, FL?
Percentage of Population Employed in Accommodation & Food Services in Tampa is 8.1%.
What is the Percentage of Population Employed in Accommodation & Food Services in Florida?
Percentage of Population Employed in Accommodation & Food Services in Florida is 8.4%.
What is the Percentage of Population Employed in Accommodation & Food Services in the United States?
Percentage of Population Employed in Accommodation & Food Services in the United States is 6.9%.