Tlingit-Haida vs Chilean Disability Age 65 to 74
COMPARE
Tlingit-Haida
Chilean
Disability Age 65 to 74
Disability Age 65 to 74 Comparison
Tlingit-Haida
Chileans
27.1%
DISABILITY AGE 65 TO 74
0.0/ 100
METRIC RATING
303rd/ 347
METRIC RANK
22.0%
DISABILITY AGE 65 TO 74
97.9/ 100
METRIC RATING
91st/ 347
METRIC RANK
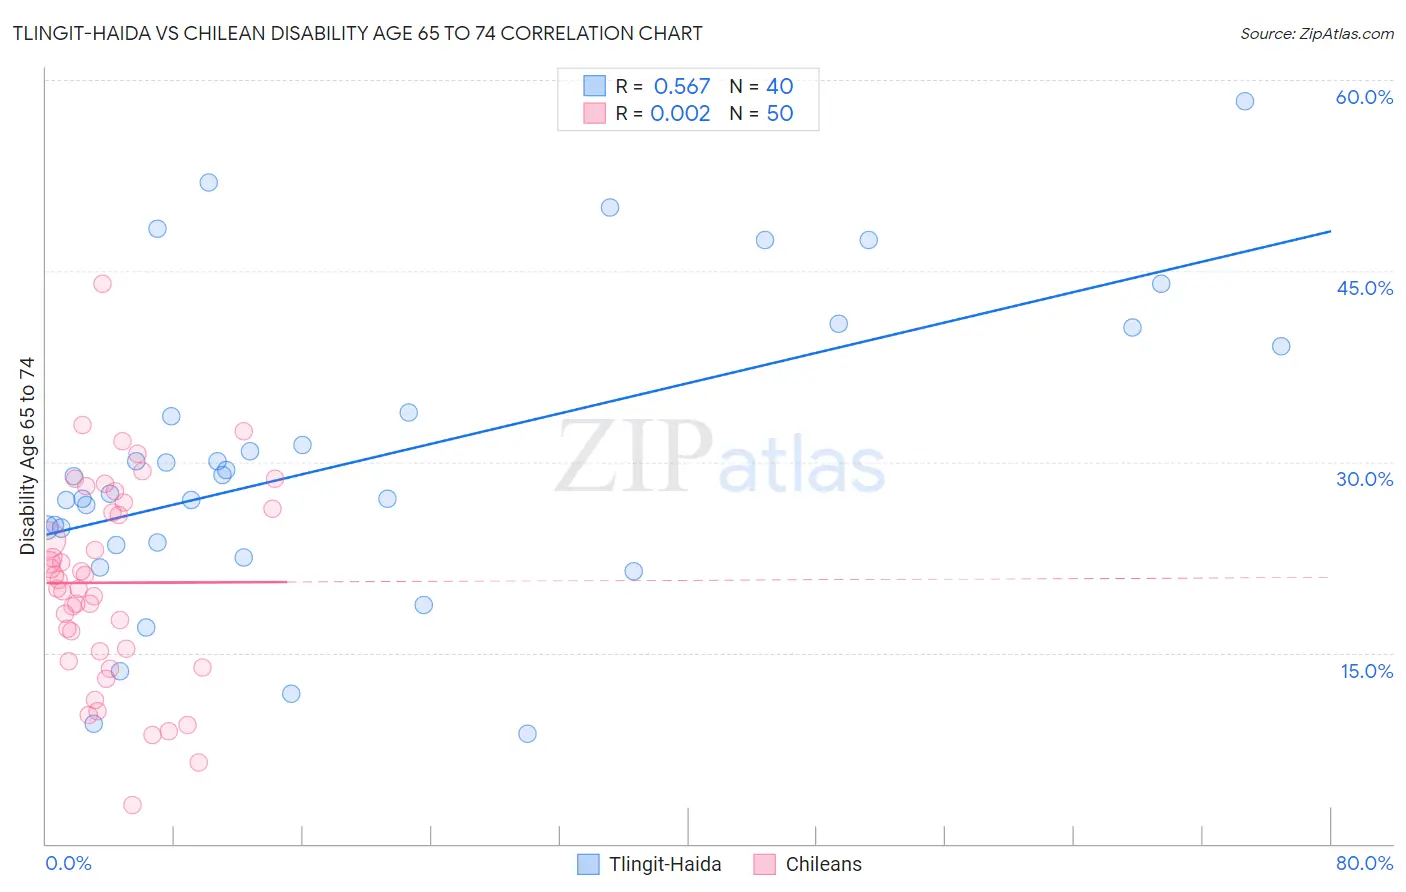
Tlingit-Haida vs Chilean Disability Age 65 to 74 Correlation Chart
The statistical analysis conducted on geographies consisting of 60,808,898 people shows a substantial positive correlation between the proportion of Tlingit-Haida and percentage of population with a disability between the ages 65 and 75 in the United States with a correlation coefficient (R) of 0.567 and weighted average of 27.1%. Similarly, the statistical analysis conducted on geographies consisting of 256,368,241 people shows no correlation between the proportion of Chileans and percentage of population with a disability between the ages 65 and 75 in the United States with a correlation coefficient (R) of 0.002 and weighted average of 22.0%, a difference of 23.1%.
Disability Age 65 to 74 Correlation Summary
| Measurement | Tlingit-Haida | Chilean |
| Minimum | 8.6% | 3.0% |
| Maximum | 58.3% | 43.9% |
| Range | 49.7% | 40.9% |
| Mean | 30.1% | 20.5% |
| Median | 28.2% | 20.4% |
| Interquartile 25% (IQ1) | 23.5% | 15.1% |
| Interquartile 75% (IQ3) | 36.5% | 26.3% |
| Interquartile Range (IQR) | 12.9% | 11.2% |
| Standard Deviation (Sample) | 11.7% | 8.0% |
| Standard Deviation (Population) | 11.6% | 7.9% |
Similar Demographics by Disability Age 65 to 74
Demographics Similar to Tlingit-Haida by Disability Age 65 to 74
In terms of disability age 65 to 74, the demographic groups most similar to Tlingit-Haida are Central American Indian (27.1%, a difference of 0.060%), Immigrants from Mexico (27.1%, a difference of 0.070%), Puget Sound Salish (27.2%, a difference of 0.12%), Mexican (27.2%, a difference of 0.22%), and Immigrants from Dominican Republic (27.0%, a difference of 0.39%).
| Demographics | Rating | Rank | Disability Age 65 to 74 |
| Bangladeshis | 0.0 /100 | #296 | Tragic 26.8% |
| Fijians | 0.0 /100 | #297 | Tragic 27.0% |
| Immigrants | Yemen | 0.0 /100 | #298 | Tragic 27.0% |
| Potawatomi | 0.0 /100 | #299 | Tragic 27.0% |
| Immigrants | Dominican Republic | 0.0 /100 | #300 | Tragic 27.0% |
| Immigrants | Mexico | 0.0 /100 | #301 | Tragic 27.1% |
| Central American Indians | 0.0 /100 | #302 | Tragic 27.1% |
| Tlingit-Haida | 0.0 /100 | #303 | Tragic 27.1% |
| Puget Sound Salish | 0.0 /100 | #304 | Tragic 27.2% |
| Mexicans | 0.0 /100 | #305 | Tragic 27.2% |
| Blacks/African Americans | 0.0 /100 | #306 | Tragic 27.3% |
| Ute | 0.0 /100 | #307 | Tragic 27.3% |
| Sioux | 0.0 /100 | #308 | Tragic 27.3% |
| Yaqui | 0.0 /100 | #309 | Tragic 27.4% |
| Shoshone | 0.0 /100 | #310 | Tragic 27.4% |
Demographics Similar to Chileans by Disability Age 65 to 74
In terms of disability age 65 to 74, the demographic groups most similar to Chileans are Italian (22.0%, a difference of 0.020%), Immigrants from Kuwait (22.0%, a difference of 0.030%), Immigrants from Netherlands (22.0%, a difference of 0.040%), Australian (22.0%, a difference of 0.050%), and Polish (22.0%, a difference of 0.060%).
| Demographics | Rating | Rank | Disability Age 65 to 74 |
| Immigrants | Spain | 98.5 /100 | #84 | Exceptional 21.9% |
| Immigrants | Lebanon | 98.4 /100 | #85 | Exceptional 21.9% |
| South Africans | 98.4 /100 | #86 | Exceptional 21.9% |
| Australians | 98.0 /100 | #87 | Exceptional 22.0% |
| Immigrants | Netherlands | 97.9 /100 | #88 | Exceptional 22.0% |
| Immigrants | Kuwait | 97.9 /100 | #89 | Exceptional 22.0% |
| Italians | 97.9 /100 | #90 | Exceptional 22.0% |
| Chileans | 97.9 /100 | #91 | Exceptional 22.0% |
| Poles | 97.8 /100 | #92 | Exceptional 22.0% |
| Immigrants | Canada | 97.8 /100 | #93 | Exceptional 22.1% |
| Immigrants | Chile | 97.7 /100 | #94 | Exceptional 22.1% |
| Romanians | 97.7 /100 | #95 | Exceptional 22.1% |
| Immigrants | North America | 97.5 /100 | #96 | Exceptional 22.1% |
| Immigrants | Southern Europe | 97.2 /100 | #97 | Exceptional 22.1% |
| Jordanians | 96.9 /100 | #98 | Exceptional 22.2% |