Tlingit-Haida vs Bolivian Disability Age 65 to 74
COMPARE
Tlingit-Haida
Bolivian
Disability Age 65 to 74
Disability Age 65 to 74 Comparison
Tlingit-Haida
Bolivians
27.1%
DISABILITY AGE 65 TO 74
0.0/ 100
METRIC RATING
303rd/ 347
METRIC RANK
21.0%
DISABILITY AGE 65 TO 74
99.9/ 100
METRIC RATING
25th/ 347
METRIC RANK
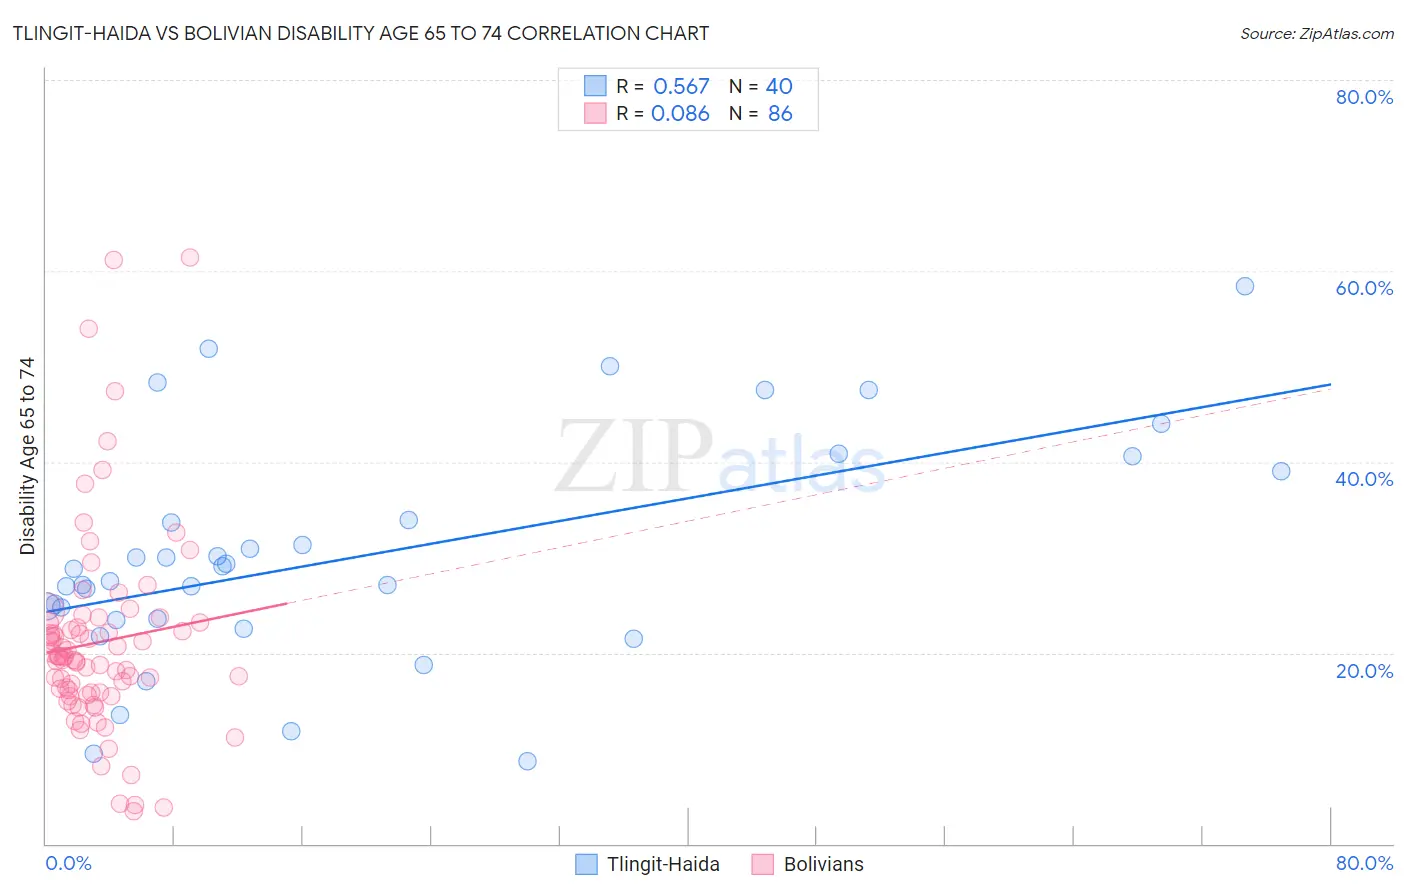
Tlingit-Haida vs Bolivian Disability Age 65 to 74 Correlation Chart
The statistical analysis conducted on geographies consisting of 60,808,898 people shows a substantial positive correlation between the proportion of Tlingit-Haida and percentage of population with a disability between the ages 65 and 75 in the United States with a correlation coefficient (R) of 0.567 and weighted average of 27.1%. Similarly, the statistical analysis conducted on geographies consisting of 184,504,529 people shows a slight positive correlation between the proportion of Bolivians and percentage of population with a disability between the ages 65 and 75 in the United States with a correlation coefficient (R) of 0.086 and weighted average of 21.0%, a difference of 29.3%.
Disability Age 65 to 74 Correlation Summary
| Measurement | Tlingit-Haida | Bolivian |
| Minimum | 8.6% | 3.5% |
| Maximum | 58.3% | 61.4% |
| Range | 49.7% | 57.9% |
| Mean | 30.1% | 21.1% |
| Median | 28.2% | 19.6% |
| Interquartile 25% (IQ1) | 23.5% | 15.9% |
| Interquartile 75% (IQ3) | 36.5% | 23.1% |
| Interquartile Range (IQR) | 12.9% | 7.2% |
| Standard Deviation (Sample) | 11.7% | 10.6% |
| Standard Deviation (Population) | 11.6% | 10.5% |
Similar Demographics by Disability Age 65 to 74
Demographics Similar to Tlingit-Haida by Disability Age 65 to 74
In terms of disability age 65 to 74, the demographic groups most similar to Tlingit-Haida are Central American Indian (27.1%, a difference of 0.060%), Immigrants from Mexico (27.1%, a difference of 0.070%), Puget Sound Salish (27.2%, a difference of 0.12%), Mexican (27.2%, a difference of 0.22%), and Immigrants from Dominican Republic (27.0%, a difference of 0.39%).
| Demographics | Rating | Rank | Disability Age 65 to 74 |
| Bangladeshis | 0.0 /100 | #296 | Tragic 26.8% |
| Fijians | 0.0 /100 | #297 | Tragic 27.0% |
| Immigrants | Yemen | 0.0 /100 | #298 | Tragic 27.0% |
| Potawatomi | 0.0 /100 | #299 | Tragic 27.0% |
| Immigrants | Dominican Republic | 0.0 /100 | #300 | Tragic 27.0% |
| Immigrants | Mexico | 0.0 /100 | #301 | Tragic 27.1% |
| Central American Indians | 0.0 /100 | #302 | Tragic 27.1% |
| Tlingit-Haida | 0.0 /100 | #303 | Tragic 27.1% |
| Puget Sound Salish | 0.0 /100 | #304 | Tragic 27.2% |
| Mexicans | 0.0 /100 | #305 | Tragic 27.2% |
| Blacks/African Americans | 0.0 /100 | #306 | Tragic 27.3% |
| Ute | 0.0 /100 | #307 | Tragic 27.3% |
| Sioux | 0.0 /100 | #308 | Tragic 27.3% |
| Yaqui | 0.0 /100 | #309 | Tragic 27.4% |
| Shoshone | 0.0 /100 | #310 | Tragic 27.4% |
Demographics Similar to Bolivians by Disability Age 65 to 74
In terms of disability age 65 to 74, the demographic groups most similar to Bolivians are Immigrants from Australia (21.0%, a difference of 0.020%), Immigrants from Sweden (21.0%, a difference of 0.030%), Soviet Union (21.0%, a difference of 0.040%), Immigrants from Belgium (21.0%, a difference of 0.090%), and Immigrants from Czechoslovakia (21.0%, a difference of 0.13%).
| Demographics | Rating | Rank | Disability Age 65 to 74 |
| Eastern Europeans | 100.0 /100 | #18 | Exceptional 20.6% |
| Burmese | 100.0 /100 | #19 | Exceptional 20.6% |
| Okinawans | 100.0 /100 | #20 | Exceptional 20.7% |
| Immigrants | Bolivia | 99.9 /100 | #21 | Exceptional 20.8% |
| Immigrants | Iran | 99.9 /100 | #22 | Exceptional 20.9% |
| Immigrants | Belgium | 99.9 /100 | #23 | Exceptional 21.0% |
| Soviet Union | 99.9 /100 | #24 | Exceptional 21.0% |
| Bolivians | 99.9 /100 | #25 | Exceptional 21.0% |
| Immigrants | Australia | 99.9 /100 | #26 | Exceptional 21.0% |
| Immigrants | Sweden | 99.9 /100 | #27 | Exceptional 21.0% |
| Immigrants | Czechoslovakia | 99.9 /100 | #28 | Exceptional 21.0% |
| Immigrants | Japan | 99.9 /100 | #29 | Exceptional 21.0% |
| Immigrants | Greece | 99.9 /100 | #30 | Exceptional 21.0% |
| Immigrants | Northern Europe | 99.9 /100 | #31 | Exceptional 21.0% |
| Turks | 99.9 /100 | #32 | Exceptional 21.0% |