Tlingit-Haida vs Spanish American Disability Age 65 to 74
COMPARE
Tlingit-Haida
Spanish American
Disability Age 65 to 74
Disability Age 65 to 74 Comparison
Tlingit-Haida
Spanish Americans
27.1%
DISABILITY AGE 65 TO 74
0.0/ 100
METRIC RATING
303rd/ 347
METRIC RANK
25.9%
DISABILITY AGE 65 TO 74
0.0/ 100
METRIC RATING
283rd/ 347
METRIC RANK
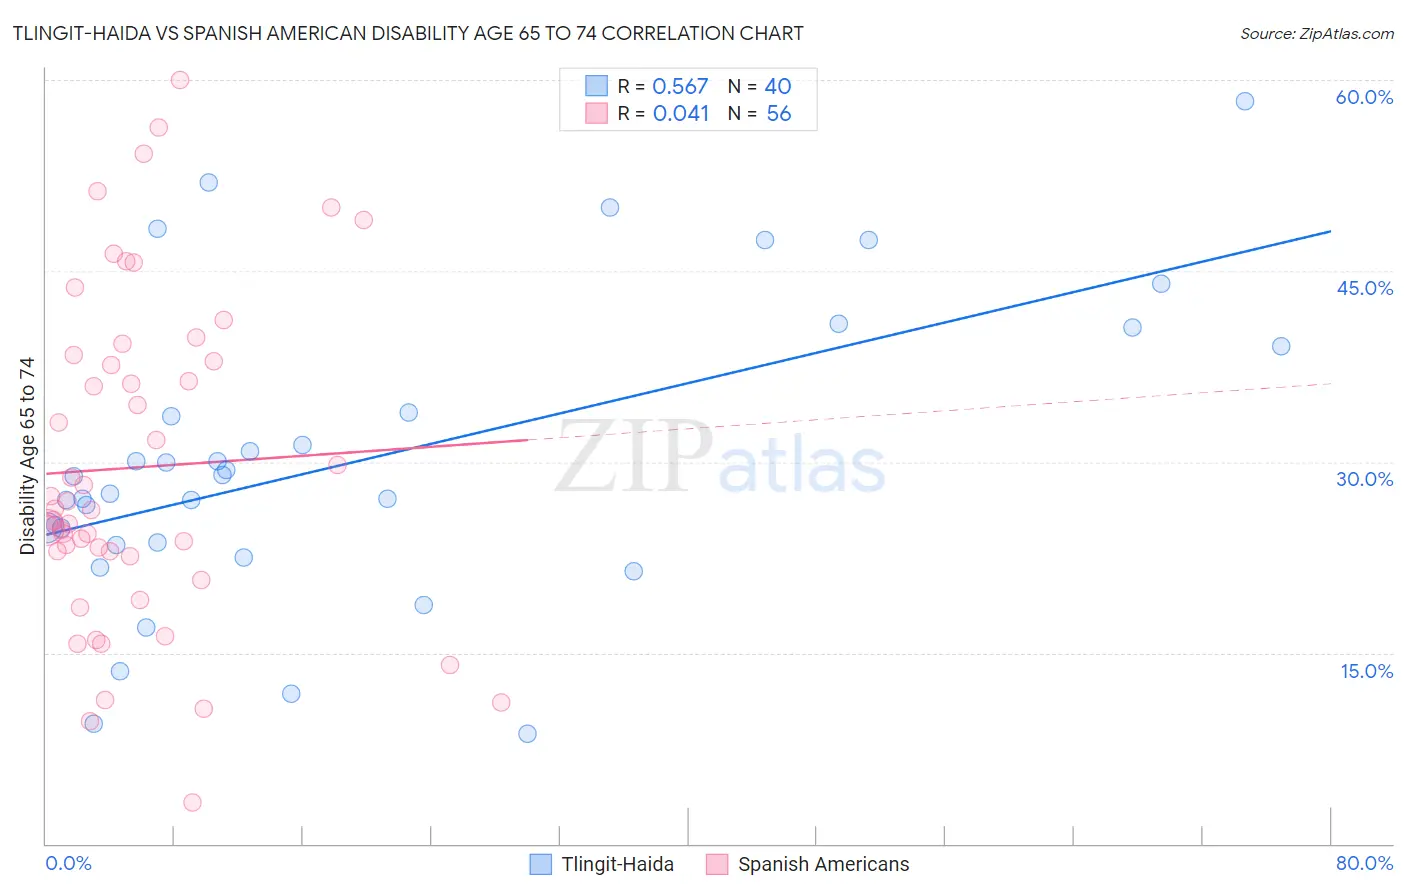
Tlingit-Haida vs Spanish American Disability Age 65 to 74 Correlation Chart
The statistical analysis conducted on geographies consisting of 60,808,898 people shows a substantial positive correlation between the proportion of Tlingit-Haida and percentage of population with a disability between the ages 65 and 75 in the United States with a correlation coefficient (R) of 0.567 and weighted average of 27.1%. Similarly, the statistical analysis conducted on geographies consisting of 103,158,709 people shows no correlation between the proportion of Spanish Americans and percentage of population with a disability between the ages 65 and 75 in the United States with a correlation coefficient (R) of 0.041 and weighted average of 25.9%, a difference of 4.5%.
Disability Age 65 to 74 Correlation Summary
| Measurement | Tlingit-Haida | Spanish American |
| Minimum | 8.6% | 3.2% |
| Maximum | 58.3% | 60.0% |
| Range | 49.7% | 56.8% |
| Mean | 30.1% | 29.6% |
| Median | 28.2% | 26.3% |
| Interquartile 25% (IQ1) | 23.5% | 22.8% |
| Interquartile 75% (IQ3) | 36.5% | 38.1% |
| Interquartile Range (IQR) | 12.9% | 15.3% |
| Standard Deviation (Sample) | 11.7% | 12.9% |
| Standard Deviation (Population) | 11.6% | 12.8% |
Demographics Similar to Tlingit-Haida and Spanish Americans by Disability Age 65 to 74
In terms of disability age 65 to 74, the demographic groups most similar to Tlingit-Haida are Central American Indian (27.1%, a difference of 0.060%), Immigrants from Mexico (27.1%, a difference of 0.070%), Immigrants from Dominican Republic (27.0%, a difference of 0.39%), Potawatomi (27.0%, a difference of 0.41%), and Immigrants from Yemen (27.0%, a difference of 0.45%). Similarly, the demographic groups most similar to Spanish Americans are Immigrants from the Azores (26.0%, a difference of 0.19%), Immigrants from Congo (26.0%, a difference of 0.21%), Immigrants from Micronesia (26.1%, a difference of 0.63%), Immigrants from Laos (26.1%, a difference of 0.70%), and Mexican American Indian (26.2%, a difference of 0.79%).
| Demographics | Rating | Rank | Disability Age 65 to 74 |
| Spanish Americans | 0.0 /100 | #283 | Tragic 25.9% |
| Immigrants | Azores | 0.0 /100 | #284 | Tragic 26.0% |
| Immigrants | Congo | 0.0 /100 | #285 | Tragic 26.0% |
| Immigrants | Micronesia | 0.0 /100 | #286 | Tragic 26.1% |
| Immigrants | Laos | 0.0 /100 | #287 | Tragic 26.1% |
| Mexican American Indians | 0.0 /100 | #288 | Tragic 26.2% |
| Africans | 0.0 /100 | #289 | Tragic 26.2% |
| Immigrants | Cabo Verde | 0.0 /100 | #290 | Tragic 26.3% |
| Spanish American Indians | 0.0 /100 | #291 | Tragic 26.4% |
| Blackfeet | 0.0 /100 | #292 | Tragic 26.6% |
| Immigrants | Central America | 0.0 /100 | #293 | Tragic 26.6% |
| Dominicans | 0.0 /100 | #294 | Tragic 26.7% |
| Hispanics or Latinos | 0.0 /100 | #295 | Tragic 26.7% |
| Bangladeshis | 0.0 /100 | #296 | Tragic 26.8% |
| Fijians | 0.0 /100 | #297 | Tragic 27.0% |
| Immigrants | Yemen | 0.0 /100 | #298 | Tragic 27.0% |
| Potawatomi | 0.0 /100 | #299 | Tragic 27.0% |
| Immigrants | Dominican Republic | 0.0 /100 | #300 | Tragic 27.0% |
| Immigrants | Mexico | 0.0 /100 | #301 | Tragic 27.1% |
| Central American Indians | 0.0 /100 | #302 | Tragic 27.1% |
| Tlingit-Haida | 0.0 /100 | #303 | Tragic 27.1% |