Tlingit-Haida vs Cheyenne Disability Age 65 to 74
COMPARE
Tlingit-Haida
Cheyenne
Disability Age 65 to 74
Disability Age 65 to 74 Comparison
Tlingit-Haida
Cheyenne
27.1%
DISABILITY AGE 65 TO 74
0.0/ 100
METRIC RATING
303rd/ 347
METRIC RANK
31.1%
DISABILITY AGE 65 TO 74
0.0/ 100
METRIC RATING
335th/ 347
METRIC RANK
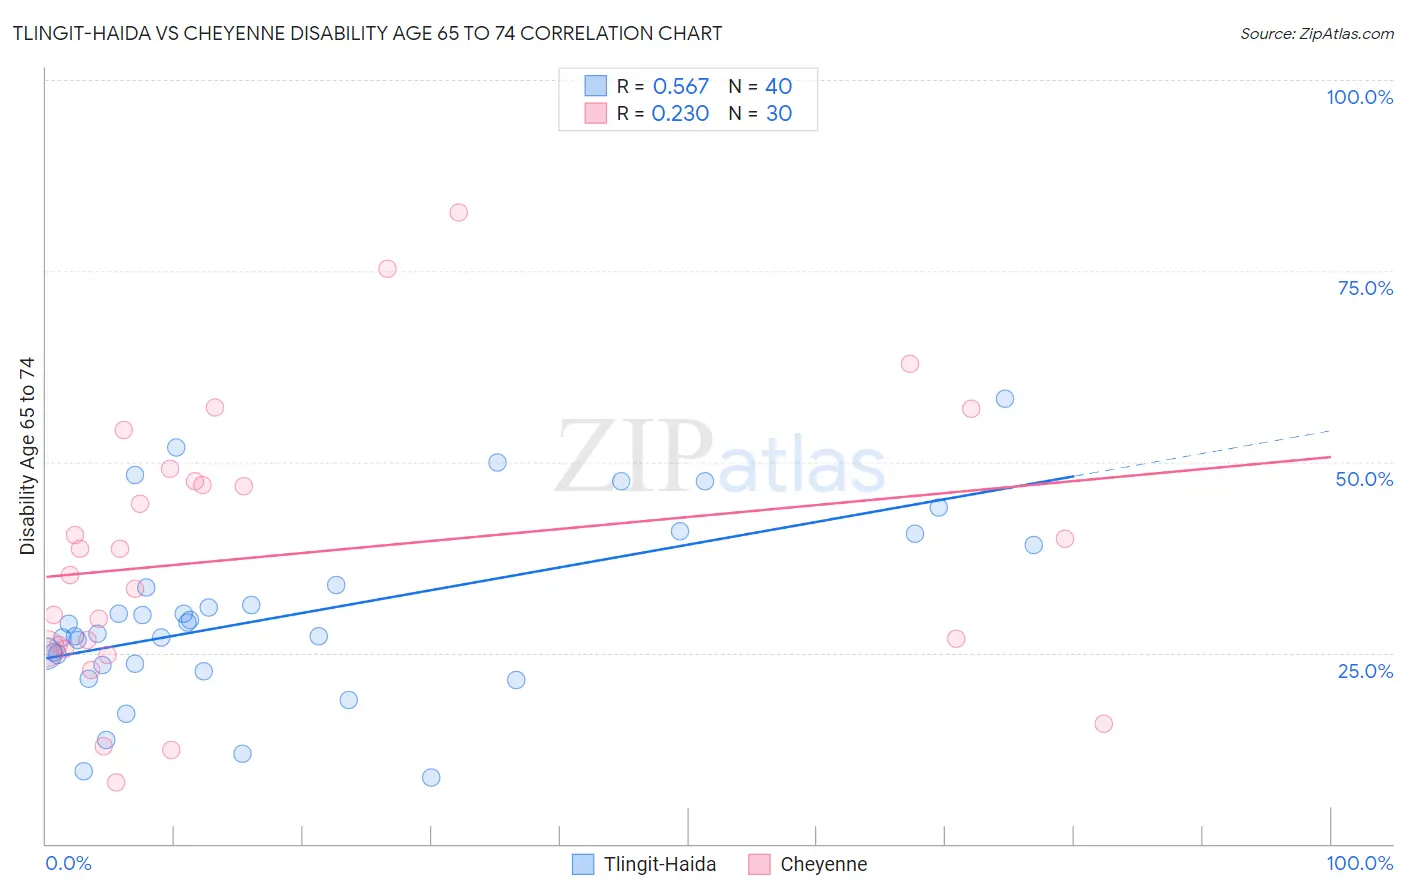
Tlingit-Haida vs Cheyenne Disability Age 65 to 74 Correlation Chart
The statistical analysis conducted on geographies consisting of 60,808,898 people shows a substantial positive correlation between the proportion of Tlingit-Haida and percentage of population with a disability between the ages 65 and 75 in the United States with a correlation coefficient (R) of 0.567 and weighted average of 27.1%. Similarly, the statistical analysis conducted on geographies consisting of 80,698,325 people shows a weak positive correlation between the proportion of Cheyenne and percentage of population with a disability between the ages 65 and 75 in the United States with a correlation coefficient (R) of 0.230 and weighted average of 31.1%, a difference of 14.5%.
Disability Age 65 to 74 Correlation Summary
| Measurement | Tlingit-Haida | Cheyenne |
| Minimum | 8.6% | 8.0% |
| Maximum | 58.3% | 82.6% |
| Range | 49.7% | 74.6% |
| Mean | 30.1% | 37.9% |
| Median | 28.2% | 36.9% |
| Interquartile 25% (IQ1) | 23.5% | 25.5% |
| Interquartile 75% (IQ3) | 36.5% | 47.5% |
| Interquartile Range (IQR) | 12.9% | 22.0% |
| Standard Deviation (Sample) | 11.7% | 18.0% |
| Standard Deviation (Population) | 11.6% | 17.7% |
Similar Demographics by Disability Age 65 to 74
Demographics Similar to Tlingit-Haida by Disability Age 65 to 74
In terms of disability age 65 to 74, the demographic groups most similar to Tlingit-Haida are Central American Indian (27.1%, a difference of 0.060%), Immigrants from Mexico (27.1%, a difference of 0.070%), Puget Sound Salish (27.2%, a difference of 0.12%), Mexican (27.2%, a difference of 0.22%), and Immigrants from Dominican Republic (27.0%, a difference of 0.39%).
| Demographics | Rating | Rank | Disability Age 65 to 74 |
| Bangladeshis | 0.0 /100 | #296 | Tragic 26.8% |
| Fijians | 0.0 /100 | #297 | Tragic 27.0% |
| Immigrants | Yemen | 0.0 /100 | #298 | Tragic 27.0% |
| Potawatomi | 0.0 /100 | #299 | Tragic 27.0% |
| Immigrants | Dominican Republic | 0.0 /100 | #300 | Tragic 27.0% |
| Immigrants | Mexico | 0.0 /100 | #301 | Tragic 27.1% |
| Central American Indians | 0.0 /100 | #302 | Tragic 27.1% |
| Tlingit-Haida | 0.0 /100 | #303 | Tragic 27.1% |
| Puget Sound Salish | 0.0 /100 | #304 | Tragic 27.2% |
| Mexicans | 0.0 /100 | #305 | Tragic 27.2% |
| Blacks/African Americans | 0.0 /100 | #306 | Tragic 27.3% |
| Ute | 0.0 /100 | #307 | Tragic 27.3% |
| Sioux | 0.0 /100 | #308 | Tragic 27.3% |
| Yaqui | 0.0 /100 | #309 | Tragic 27.4% |
| Shoshone | 0.0 /100 | #310 | Tragic 27.4% |
Demographics Similar to Cheyenne by Disability Age 65 to 74
In terms of disability age 65 to 74, the demographic groups most similar to Cheyenne are Yuman (31.5%, a difference of 1.3%), Alaska Native (30.6%, a difference of 1.4%), Colville (30.5%, a difference of 1.7%), Native/Alaskan (30.4%, a difference of 2.2%), and Chickasaw (30.2%, a difference of 2.9%).
| Demographics | Rating | Rank | Disability Age 65 to 74 |
| Hopi | 0.0 /100 | #328 | Tragic 30.0% |
| Choctaw | 0.0 /100 | #329 | Tragic 30.2% |
| Creek | 0.0 /100 | #330 | Tragic 30.2% |
| Chickasaw | 0.0 /100 | #331 | Tragic 30.2% |
| Natives/Alaskans | 0.0 /100 | #332 | Tragic 30.4% |
| Colville | 0.0 /100 | #333 | Tragic 30.5% |
| Alaska Natives | 0.0 /100 | #334 | Tragic 30.6% |
| Cheyenne | 0.0 /100 | #335 | Tragic 31.1% |
| Yuman | 0.0 /100 | #336 | Tragic 31.5% |
| Houma | 0.0 /100 | #337 | Tragic 32.3% |
| Alaskan Athabascans | 0.0 /100 | #338 | Tragic 32.4% |
| Kiowa | 0.0 /100 | #339 | Tragic 32.6% |
| Lumbee | 0.0 /100 | #340 | Tragic 32.7% |
| Tsimshian | 0.0 /100 | #341 | Tragic 32.9% |
| Pueblo | 0.0 /100 | #342 | Tragic 33.1% |