Tlingit-Haida vs Spanish Disability Age 65 to 74
COMPARE
Tlingit-Haida
Spanish
Disability Age 65 to 74
Disability Age 65 to 74 Comparison
Tlingit-Haida
Spanish
27.1%
DISABILITY AGE 65 TO 74
0.0/ 100
METRIC RATING
303rd/ 347
METRIC RANK
24.6%
DISABILITY AGE 65 TO 74
2.2/ 100
METRIC RATING
243rd/ 347
METRIC RANK
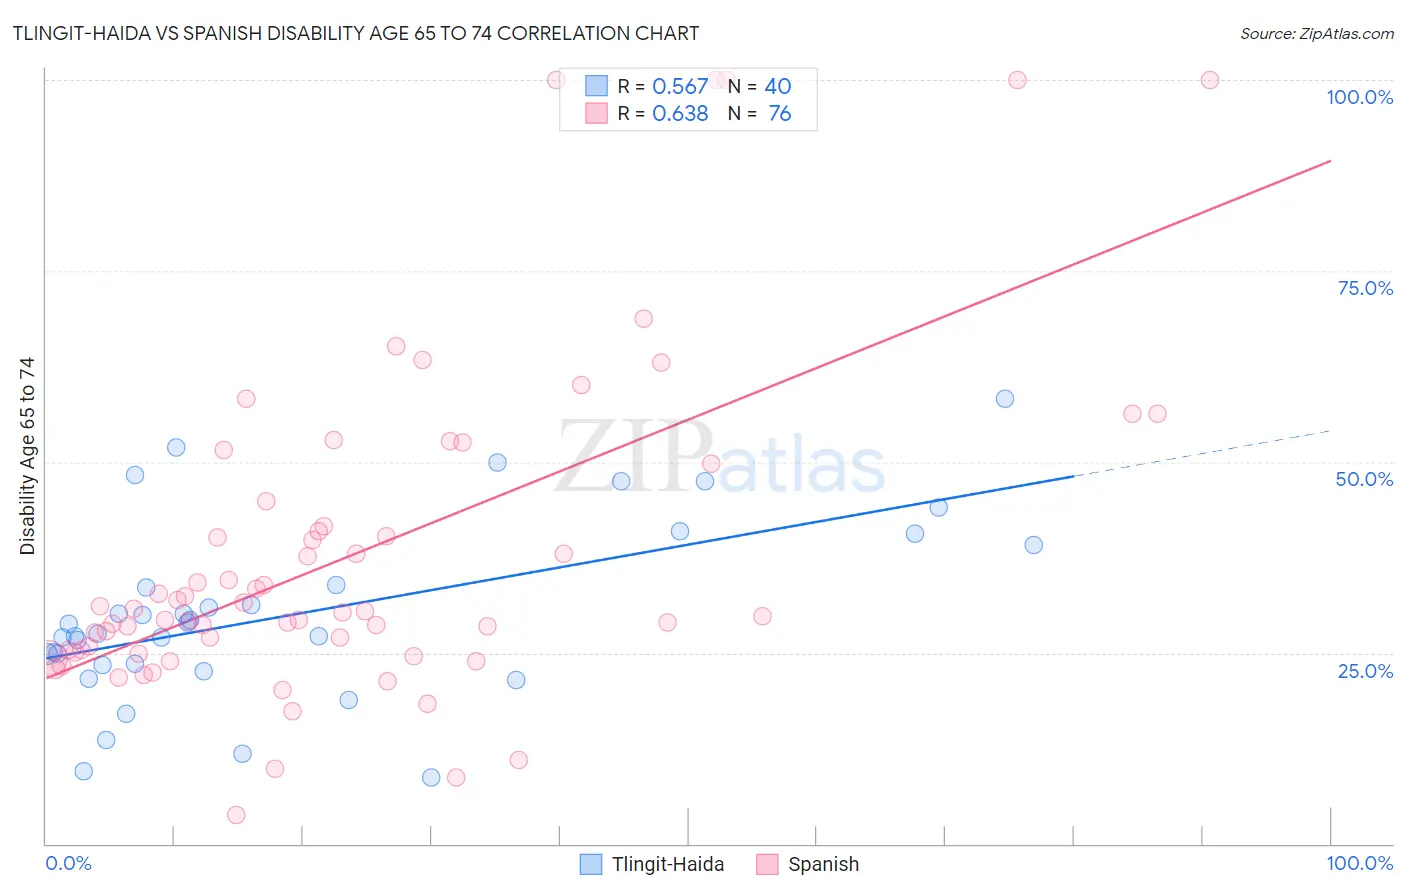
Tlingit-Haida vs Spanish Disability Age 65 to 74 Correlation Chart
The statistical analysis conducted on geographies consisting of 60,808,898 people shows a substantial positive correlation between the proportion of Tlingit-Haida and percentage of population with a disability between the ages 65 and 75 in the United States with a correlation coefficient (R) of 0.567 and weighted average of 27.1%. Similarly, the statistical analysis conducted on geographies consisting of 421,397,918 people shows a significant positive correlation between the proportion of Spanish and percentage of population with a disability between the ages 65 and 75 in the United States with a correlation coefficient (R) of 0.638 and weighted average of 24.6%, a difference of 10.1%.
Disability Age 65 to 74 Correlation Summary
| Measurement | Tlingit-Haida | Spanish |
| Minimum | 8.6% | 3.8% |
| Maximum | 58.3% | 100.0% |
| Range | 49.7% | 96.2% |
| Mean | 30.1% | 37.8% |
| Median | 28.2% | 30.4% |
| Interquartile 25% (IQ1) | 23.5% | 25.2% |
| Interquartile 75% (IQ3) | 36.5% | 43.2% |
| Interquartile Range (IQR) | 12.9% | 18.0% |
| Standard Deviation (Sample) | 11.7% | 21.4% |
| Standard Deviation (Population) | 11.6% | 21.2% |
Similar Demographics by Disability Age 65 to 74
Demographics Similar to Tlingit-Haida by Disability Age 65 to 74
In terms of disability age 65 to 74, the demographic groups most similar to Tlingit-Haida are Central American Indian (27.1%, a difference of 0.060%), Immigrants from Mexico (27.1%, a difference of 0.070%), Puget Sound Salish (27.2%, a difference of 0.12%), Mexican (27.2%, a difference of 0.22%), and Immigrants from Dominican Republic (27.0%, a difference of 0.39%).
| Demographics | Rating | Rank | Disability Age 65 to 74 |
| Bangladeshis | 0.0 /100 | #296 | Tragic 26.8% |
| Fijians | 0.0 /100 | #297 | Tragic 27.0% |
| Immigrants | Yemen | 0.0 /100 | #298 | Tragic 27.0% |
| Potawatomi | 0.0 /100 | #299 | Tragic 27.0% |
| Immigrants | Dominican Republic | 0.0 /100 | #300 | Tragic 27.0% |
| Immigrants | Mexico | 0.0 /100 | #301 | Tragic 27.1% |
| Central American Indians | 0.0 /100 | #302 | Tragic 27.1% |
| Tlingit-Haida | 0.0 /100 | #303 | Tragic 27.1% |
| Puget Sound Salish | 0.0 /100 | #304 | Tragic 27.2% |
| Mexicans | 0.0 /100 | #305 | Tragic 27.2% |
| Blacks/African Americans | 0.0 /100 | #306 | Tragic 27.3% |
| Ute | 0.0 /100 | #307 | Tragic 27.3% |
| Sioux | 0.0 /100 | #308 | Tragic 27.3% |
| Yaqui | 0.0 /100 | #309 | Tragic 27.4% |
| Shoshone | 0.0 /100 | #310 | Tragic 27.4% |
Demographics Similar to Spanish by Disability Age 65 to 74
In terms of disability age 65 to 74, the demographic groups most similar to Spanish are Immigrants from Senegal (24.6%, a difference of 0.010%), Immigrants from Western Africa (24.6%, a difference of 0.090%), Armenian (24.7%, a difference of 0.12%), British West Indian (24.7%, a difference of 0.13%), and Spaniard (24.6%, a difference of 0.18%).
| Demographics | Rating | Rank | Disability Age 65 to 74 |
| German Russians | 3.7 /100 | #236 | Tragic 24.4% |
| West Indians | 3.4 /100 | #237 | Tragic 24.5% |
| Immigrants | Ghana | 3.0 /100 | #238 | Tragic 24.5% |
| Immigrants | Caribbean | 2.6 /100 | #239 | Tragic 24.6% |
| Spaniards | 2.4 /100 | #240 | Tragic 24.6% |
| Immigrants | Western Africa | 2.3 /100 | #241 | Tragic 24.6% |
| Immigrants | Senegal | 2.2 /100 | #242 | Tragic 24.6% |
| Spanish | 2.2 /100 | #243 | Tragic 24.6% |
| Armenians | 2.0 /100 | #244 | Tragic 24.7% |
| British West Indians | 2.0 /100 | #245 | Tragic 24.7% |
| Immigrants | Iraq | 1.9 /100 | #246 | Tragic 24.7% |
| Indonesians | 1.1 /100 | #247 | Tragic 24.9% |
| Senegalese | 0.9 /100 | #248 | Tragic 24.9% |
| Immigrants | Fiji | 0.8 /100 | #249 | Tragic 25.0% |
| Salvadorans | 0.8 /100 | #250 | Tragic 25.0% |