Tlingit-Haida vs Belgian Disability Age 65 to 74
COMPARE
Tlingit-Haida
Belgian
Disability Age 65 to 74
Disability Age 65 to 74 Comparison
Tlingit-Haida
Belgians
27.1%
DISABILITY AGE 65 TO 74
0.0/ 100
METRIC RATING
303rd/ 347
METRIC RANK
22.7%
DISABILITY AGE 65 TO 74
85.3/ 100
METRIC RATING
141st/ 347
METRIC RANK
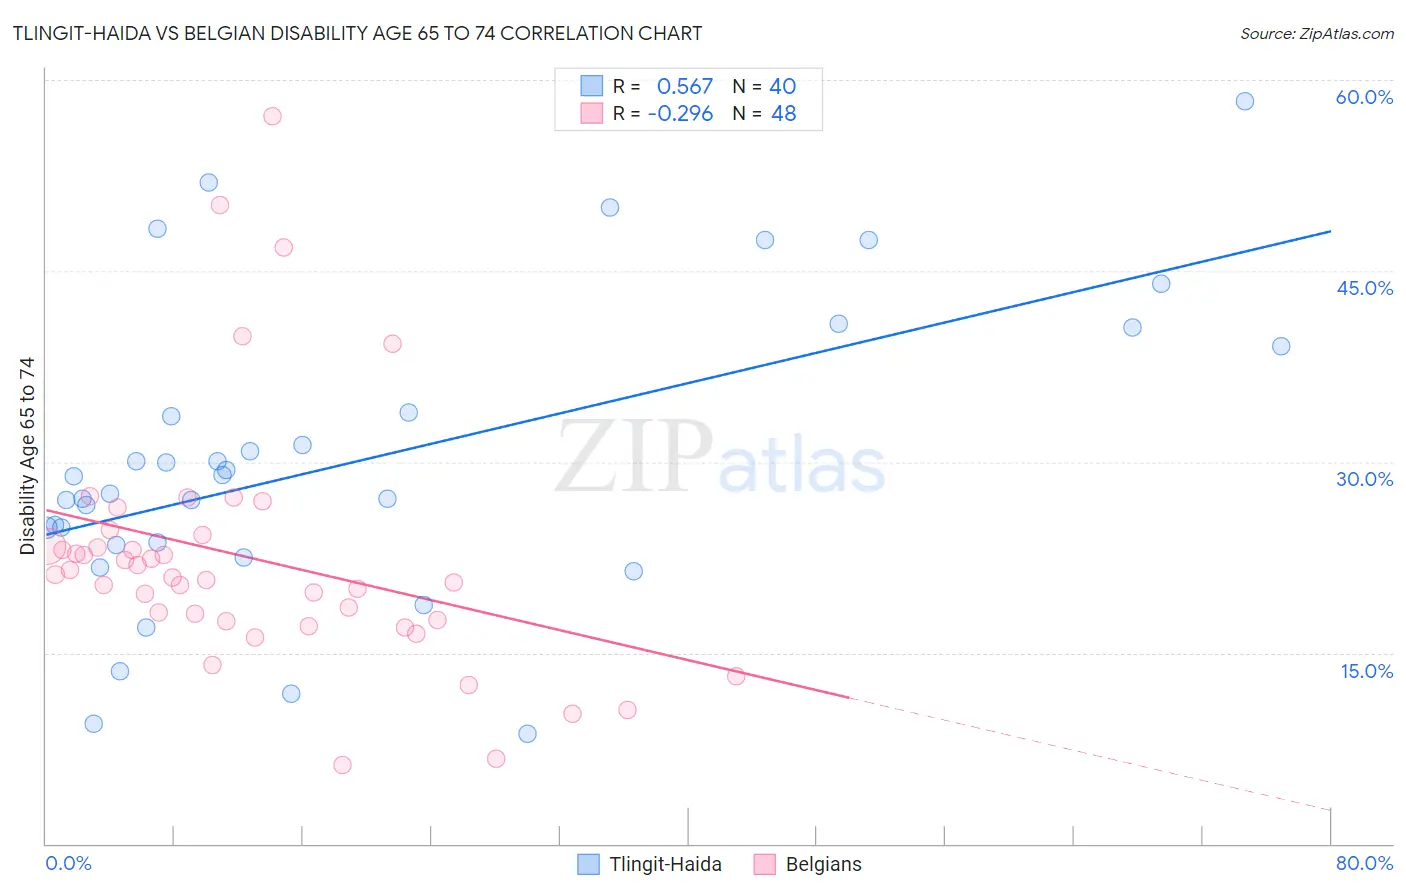
Tlingit-Haida vs Belgian Disability Age 65 to 74 Correlation Chart
The statistical analysis conducted on geographies consisting of 60,808,898 people shows a substantial positive correlation between the proportion of Tlingit-Haida and percentage of population with a disability between the ages 65 and 75 in the United States with a correlation coefficient (R) of 0.567 and weighted average of 27.1%. Similarly, the statistical analysis conducted on geographies consisting of 355,442,637 people shows a weak negative correlation between the proportion of Belgians and percentage of population with a disability between the ages 65 and 75 in the United States with a correlation coefficient (R) of -0.296 and weighted average of 22.7%, a difference of 19.3%.
Disability Age 65 to 74 Correlation Summary
| Measurement | Tlingit-Haida | Belgian |
| Minimum | 8.6% | 6.1% |
| Maximum | 58.3% | 57.1% |
| Range | 49.7% | 51.0% |
| Mean | 30.1% | 22.5% |
| Median | 28.2% | 21.0% |
| Interquartile 25% (IQ1) | 23.5% | 17.5% |
| Interquartile 75% (IQ3) | 36.5% | 23.8% |
| Interquartile Range (IQR) | 12.9% | 6.3% |
| Standard Deviation (Sample) | 11.7% | 9.9% |
| Standard Deviation (Population) | 11.6% | 9.8% |
Similar Demographics by Disability Age 65 to 74
Demographics Similar to Tlingit-Haida by Disability Age 65 to 74
In terms of disability age 65 to 74, the demographic groups most similar to Tlingit-Haida are Central American Indian (27.1%, a difference of 0.060%), Immigrants from Mexico (27.1%, a difference of 0.070%), Puget Sound Salish (27.2%, a difference of 0.12%), Mexican (27.2%, a difference of 0.22%), and Immigrants from Dominican Republic (27.0%, a difference of 0.39%).
| Demographics | Rating | Rank | Disability Age 65 to 74 |
| Bangladeshis | 0.0 /100 | #296 | Tragic 26.8% |
| Fijians | 0.0 /100 | #297 | Tragic 27.0% |
| Immigrants | Yemen | 0.0 /100 | #298 | Tragic 27.0% |
| Potawatomi | 0.0 /100 | #299 | Tragic 27.0% |
| Immigrants | Dominican Republic | 0.0 /100 | #300 | Tragic 27.0% |
| Immigrants | Mexico | 0.0 /100 | #301 | Tragic 27.1% |
| Central American Indians | 0.0 /100 | #302 | Tragic 27.1% |
| Tlingit-Haida | 0.0 /100 | #303 | Tragic 27.1% |
| Puget Sound Salish | 0.0 /100 | #304 | Tragic 27.2% |
| Mexicans | 0.0 /100 | #305 | Tragic 27.2% |
| Blacks/African Americans | 0.0 /100 | #306 | Tragic 27.3% |
| Ute | 0.0 /100 | #307 | Tragic 27.3% |
| Sioux | 0.0 /100 | #308 | Tragic 27.3% |
| Yaqui | 0.0 /100 | #309 | Tragic 27.4% |
| Shoshone | 0.0 /100 | #310 | Tragic 27.4% |
Demographics Similar to Belgians by Disability Age 65 to 74
In terms of disability age 65 to 74, the demographic groups most similar to Belgians are Ugandan (22.7%, a difference of 0.010%), Immigrants from Ethiopia (22.7%, a difference of 0.010%), Immigrants from Syria (22.7%, a difference of 0.050%), Arab (22.8%, a difference of 0.070%), and Danish (22.8%, a difference of 0.11%).
| Demographics | Rating | Rank | Disability Age 65 to 74 |
| Afghans | 88.6 /100 | #134 | Excellent 22.6% |
| Immigrants | Ukraine | 88.4 /100 | #135 | Excellent 22.6% |
| Ethiopians | 87.9 /100 | #136 | Excellent 22.7% |
| Taiwanese | 87.6 /100 | #137 | Excellent 22.7% |
| Immigrants | Moldova | 87.3 /100 | #138 | Excellent 22.7% |
| Immigrants | Syria | 85.8 /100 | #139 | Excellent 22.7% |
| Ugandans | 85.4 /100 | #140 | Excellent 22.7% |
| Belgians | 85.3 /100 | #141 | Excellent 22.7% |
| Immigrants | Ethiopia | 85.3 /100 | #142 | Excellent 22.7% |
| Arabs | 84.8 /100 | #143 | Excellent 22.8% |
| Danes | 84.4 /100 | #144 | Excellent 22.8% |
| Immigrants | Uganda | 84.0 /100 | #145 | Excellent 22.8% |
| Alsatians | 83.7 /100 | #146 | Excellent 22.8% |
| Immigrants | Uzbekistan | 83.1 /100 | #147 | Excellent 22.8% |
| New Zealanders | 79.9 /100 | #148 | Good 22.9% |