Tlingit-Haida vs Laotian Disability Age 65 to 74
COMPARE
Tlingit-Haida
Laotian
Disability Age 65 to 74
Disability Age 65 to 74 Comparison
Tlingit-Haida
Laotians
27.1%
DISABILITY AGE 65 TO 74
0.0/ 100
METRIC RATING
303rd/ 347
METRIC RANK
22.3%
DISABILITY AGE 65 TO 74
94.9/ 100
METRIC RATING
115th/ 347
METRIC RANK
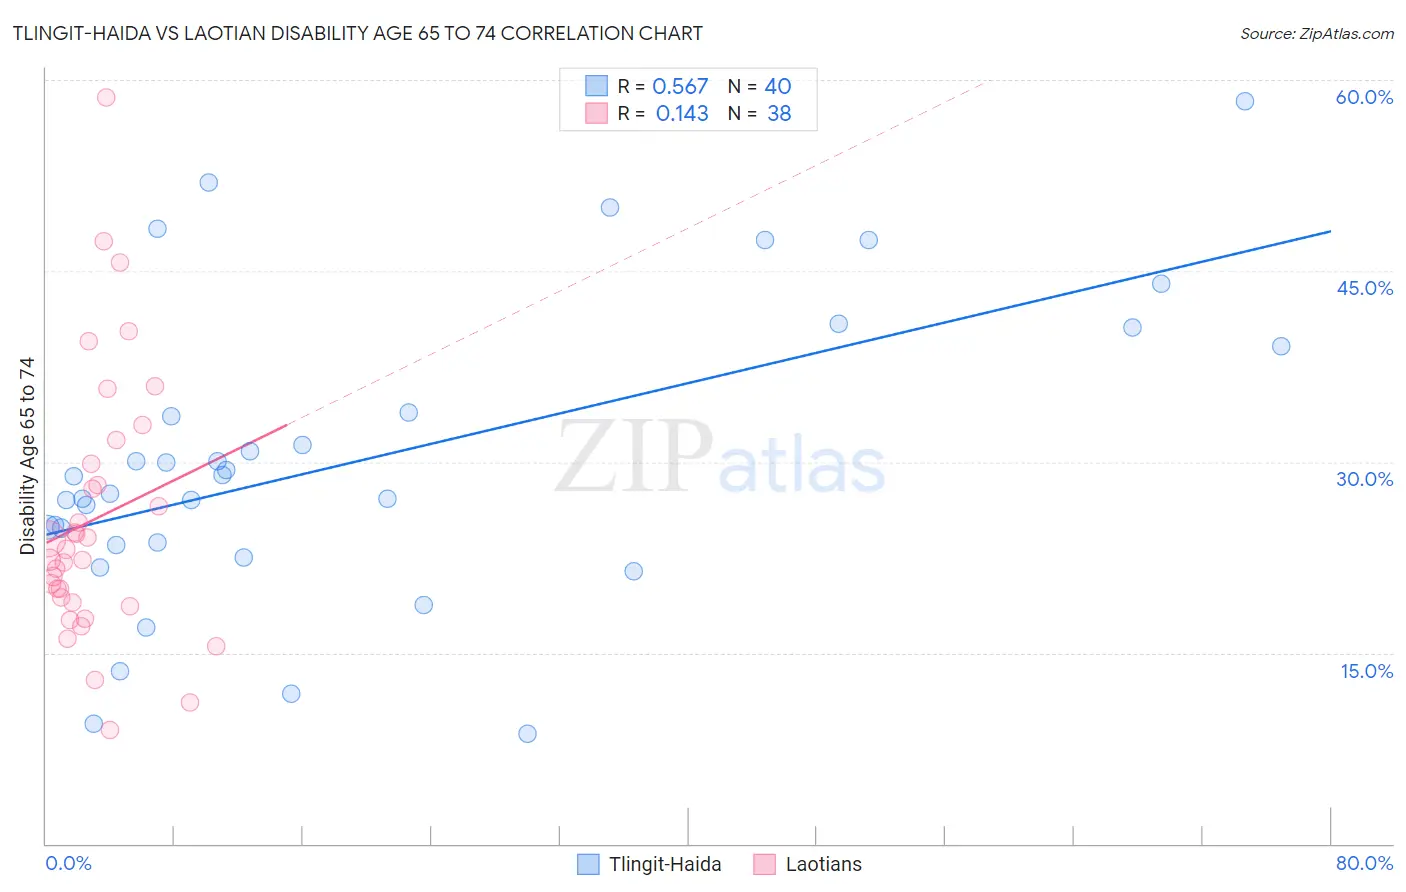
Tlingit-Haida vs Laotian Disability Age 65 to 74 Correlation Chart
The statistical analysis conducted on geographies consisting of 60,808,898 people shows a substantial positive correlation between the proportion of Tlingit-Haida and percentage of population with a disability between the ages 65 and 75 in the United States with a correlation coefficient (R) of 0.567 and weighted average of 27.1%. Similarly, the statistical analysis conducted on geographies consisting of 224,537,885 people shows a poor positive correlation between the proportion of Laotians and percentage of population with a disability between the ages 65 and 75 in the United States with a correlation coefficient (R) of 0.143 and weighted average of 22.3%, a difference of 21.4%.
Disability Age 65 to 74 Correlation Summary
| Measurement | Tlingit-Haida | Laotian |
| Minimum | 8.6% | 8.9% |
| Maximum | 58.3% | 58.7% |
| Range | 49.7% | 49.8% |
| Mean | 30.1% | 25.5% |
| Median | 28.2% | 22.7% |
| Interquartile 25% (IQ1) | 23.5% | 19.0% |
| Interquartile 75% (IQ3) | 36.5% | 29.9% |
| Interquartile Range (IQR) | 12.9% | 10.9% |
| Standard Deviation (Sample) | 11.7% | 10.5% |
| Standard Deviation (Population) | 11.6% | 10.3% |
Similar Demographics by Disability Age 65 to 74
Demographics Similar to Tlingit-Haida by Disability Age 65 to 74
In terms of disability age 65 to 74, the demographic groups most similar to Tlingit-Haida are Central American Indian (27.1%, a difference of 0.060%), Immigrants from Mexico (27.1%, a difference of 0.070%), Puget Sound Salish (27.2%, a difference of 0.12%), Mexican (27.2%, a difference of 0.22%), and Immigrants from Dominican Republic (27.0%, a difference of 0.39%).
| Demographics | Rating | Rank | Disability Age 65 to 74 |
| Bangladeshis | 0.0 /100 | #296 | Tragic 26.8% |
| Fijians | 0.0 /100 | #297 | Tragic 27.0% |
| Immigrants | Yemen | 0.0 /100 | #298 | Tragic 27.0% |
| Potawatomi | 0.0 /100 | #299 | Tragic 27.0% |
| Immigrants | Dominican Republic | 0.0 /100 | #300 | Tragic 27.0% |
| Immigrants | Mexico | 0.0 /100 | #301 | Tragic 27.1% |
| Central American Indians | 0.0 /100 | #302 | Tragic 27.1% |
| Tlingit-Haida | 0.0 /100 | #303 | Tragic 27.1% |
| Puget Sound Salish | 0.0 /100 | #304 | Tragic 27.2% |
| Mexicans | 0.0 /100 | #305 | Tragic 27.2% |
| Blacks/African Americans | 0.0 /100 | #306 | Tragic 27.3% |
| Ute | 0.0 /100 | #307 | Tragic 27.3% |
| Sioux | 0.0 /100 | #308 | Tragic 27.3% |
| Yaqui | 0.0 /100 | #309 | Tragic 27.4% |
| Shoshone | 0.0 /100 | #310 | Tragic 27.4% |
Demographics Similar to Laotians by Disability Age 65 to 74
In terms of disability age 65 to 74, the demographic groups most similar to Laotians are Brazilian (22.4%, a difference of 0.040%), Swedish (22.4%, a difference of 0.050%), Ukrainian (22.3%, a difference of 0.060%), Austrian (22.4%, a difference of 0.060%), and Immigrants from Northern Africa (22.4%, a difference of 0.060%).
| Demographics | Rating | Rank | Disability Age 65 to 74 |
| Immigrants | Zimbabwe | 96.1 /100 | #108 | Exceptional 22.3% |
| Albanians | 95.8 /100 | #109 | Exceptional 22.3% |
| Immigrants | Peru | 95.7 /100 | #110 | Exceptional 22.3% |
| Serbians | 95.7 /100 | #111 | Exceptional 22.3% |
| Immigrants | South America | 95.5 /100 | #112 | Exceptional 22.3% |
| Syrians | 95.3 /100 | #113 | Exceptional 22.3% |
| Ukrainians | 95.1 /100 | #114 | Exceptional 22.3% |
| Laotians | 94.9 /100 | #115 | Exceptional 22.3% |
| Brazilians | 94.8 /100 | #116 | Exceptional 22.4% |
| Swedes | 94.7 /100 | #117 | Exceptional 22.4% |
| Austrians | 94.7 /100 | #118 | Exceptional 22.4% |
| Immigrants | Northern Africa | 94.7 /100 | #119 | Exceptional 22.4% |
| Immigrants | Kazakhstan | 93.9 /100 | #120 | Exceptional 22.4% |
| Czechs | 93.5 /100 | #121 | Exceptional 22.4% |
| Immigrants | Jordan | 93.5 /100 | #122 | Exceptional 22.4% |