Tlingit-Haida vs Cuban Disability Age 65 to 74
COMPARE
Tlingit-Haida
Cuban
Disability Age 65 to 74
Disability Age 65 to 74 Comparison
Tlingit-Haida
Cubans
27.1%
DISABILITY AGE 65 TO 74
0.0/ 100
METRIC RATING
303rd/ 347
METRIC RANK
23.3%
DISABILITY AGE 65 TO 74
51.9/ 100
METRIC RATING
171st/ 347
METRIC RANK
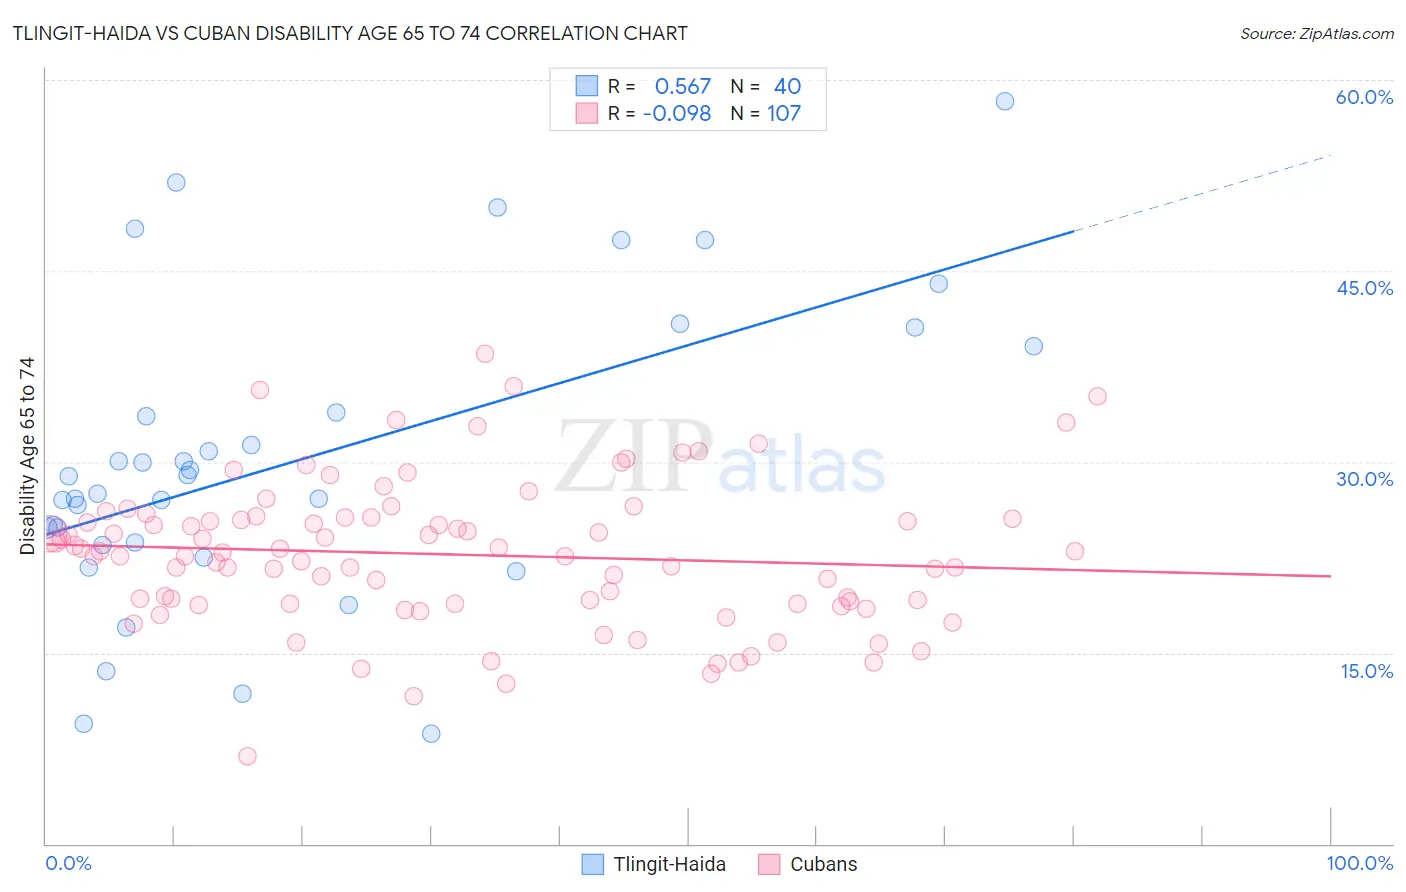
Tlingit-Haida vs Cuban Disability Age 65 to 74 Correlation Chart
The statistical analysis conducted on geographies consisting of 60,808,898 people shows a substantial positive correlation between the proportion of Tlingit-Haida and percentage of population with a disability between the ages 65 and 75 in the United States with a correlation coefficient (R) of 0.567 and weighted average of 27.1%. Similarly, the statistical analysis conducted on geographies consisting of 448,265,538 people shows a slight negative correlation between the proportion of Cubans and percentage of population with a disability between the ages 65 and 75 in the United States with a correlation coefficient (R) of -0.098 and weighted average of 23.3%, a difference of 16.4%.
Disability Age 65 to 74 Correlation Summary
| Measurement | Tlingit-Haida | Cuban |
| Minimum | 8.6% | 6.9% |
| Maximum | 58.3% | 38.5% |
| Range | 49.7% | 31.6% |
| Mean | 30.1% | 22.7% |
| Median | 28.2% | 22.9% |
| Interquartile 25% (IQ1) | 23.5% | 18.9% |
| Interquartile 75% (IQ3) | 36.5% | 25.6% |
| Interquartile Range (IQR) | 12.9% | 6.7% |
| Standard Deviation (Sample) | 11.7% | 5.7% |
| Standard Deviation (Population) | 11.6% | 5.7% |
Similar Demographics by Disability Age 65 to 74
Demographics Similar to Tlingit-Haida by Disability Age 65 to 74
In terms of disability age 65 to 74, the demographic groups most similar to Tlingit-Haida are Central American Indian (27.1%, a difference of 0.060%), Immigrants from Mexico (27.1%, a difference of 0.070%), Puget Sound Salish (27.2%, a difference of 0.12%), Mexican (27.2%, a difference of 0.22%), and Immigrants from Dominican Republic (27.0%, a difference of 0.39%).
| Demographics | Rating | Rank | Disability Age 65 to 74 |
| Bangladeshis | 0.0 /100 | #296 | Tragic 26.8% |
| Fijians | 0.0 /100 | #297 | Tragic 27.0% |
| Immigrants | Yemen | 0.0 /100 | #298 | Tragic 27.0% |
| Potawatomi | 0.0 /100 | #299 | Tragic 27.0% |
| Immigrants | Dominican Republic | 0.0 /100 | #300 | Tragic 27.0% |
| Immigrants | Mexico | 0.0 /100 | #301 | Tragic 27.1% |
| Central American Indians | 0.0 /100 | #302 | Tragic 27.1% |
| Tlingit-Haida | 0.0 /100 | #303 | Tragic 27.1% |
| Puget Sound Salish | 0.0 /100 | #304 | Tragic 27.2% |
| Mexicans | 0.0 /100 | #305 | Tragic 27.2% |
| Blacks/African Americans | 0.0 /100 | #306 | Tragic 27.3% |
| Ute | 0.0 /100 | #307 | Tragic 27.3% |
| Sioux | 0.0 /100 | #308 | Tragic 27.3% |
| Yaqui | 0.0 /100 | #309 | Tragic 27.4% |
| Shoshone | 0.0 /100 | #310 | Tragic 27.4% |
Demographics Similar to Cubans by Disability Age 65 to 74
In terms of disability age 65 to 74, the demographic groups most similar to Cubans are German (23.3%, a difference of 0.080%), Yugoslavian (23.3%, a difference of 0.10%), Immigrants from South Eastern Asia (23.3%, a difference of 0.11%), Moroccan (23.3%, a difference of 0.13%), and Icelander (23.3%, a difference of 0.14%).
| Demographics | Rating | Rank | Disability Age 65 to 74 |
| Sierra Leoneans | 60.9 /100 | #164 | Good 23.2% |
| Vietnamese | 60.8 /100 | #165 | Good 23.2% |
| Immigrants | Afghanistan | 60.5 /100 | #166 | Good 23.2% |
| Immigrants | Bosnia and Herzegovina | 57.6 /100 | #167 | Average 23.2% |
| Pakistanis | 57.0 /100 | #168 | Average 23.2% |
| Icelanders | 54.3 /100 | #169 | Average 23.3% |
| Moroccans | 54.2 /100 | #170 | Average 23.3% |
| Cubans | 51.9 /100 | #171 | Average 23.3% |
| Germans | 50.5 /100 | #172 | Average 23.3% |
| Yugoslavians | 50.2 /100 | #173 | Average 23.3% |
| Immigrants | South Eastern Asia | 50.0 /100 | #174 | Average 23.3% |
| Dutch | 49.4 /100 | #175 | Average 23.3% |
| Immigrants | Eritrea | 47.5 /100 | #176 | Average 23.4% |
| Immigrants | Haiti | 47.5 /100 | #177 | Average 23.4% |
| Guyanese | 45.8 /100 | #178 | Average 23.4% |