Thai vs Bermudan Disability
COMPARE
Thai
Bermudan
Disability
Disability Comparison
Thais
Bermudans
9.7%
DISABILITY
100.0/ 100
METRIC RATING
4th/ 347
METRIC RANK
12.3%
DISABILITY
1.1/ 100
METRIC RATING
252nd/ 347
METRIC RANK
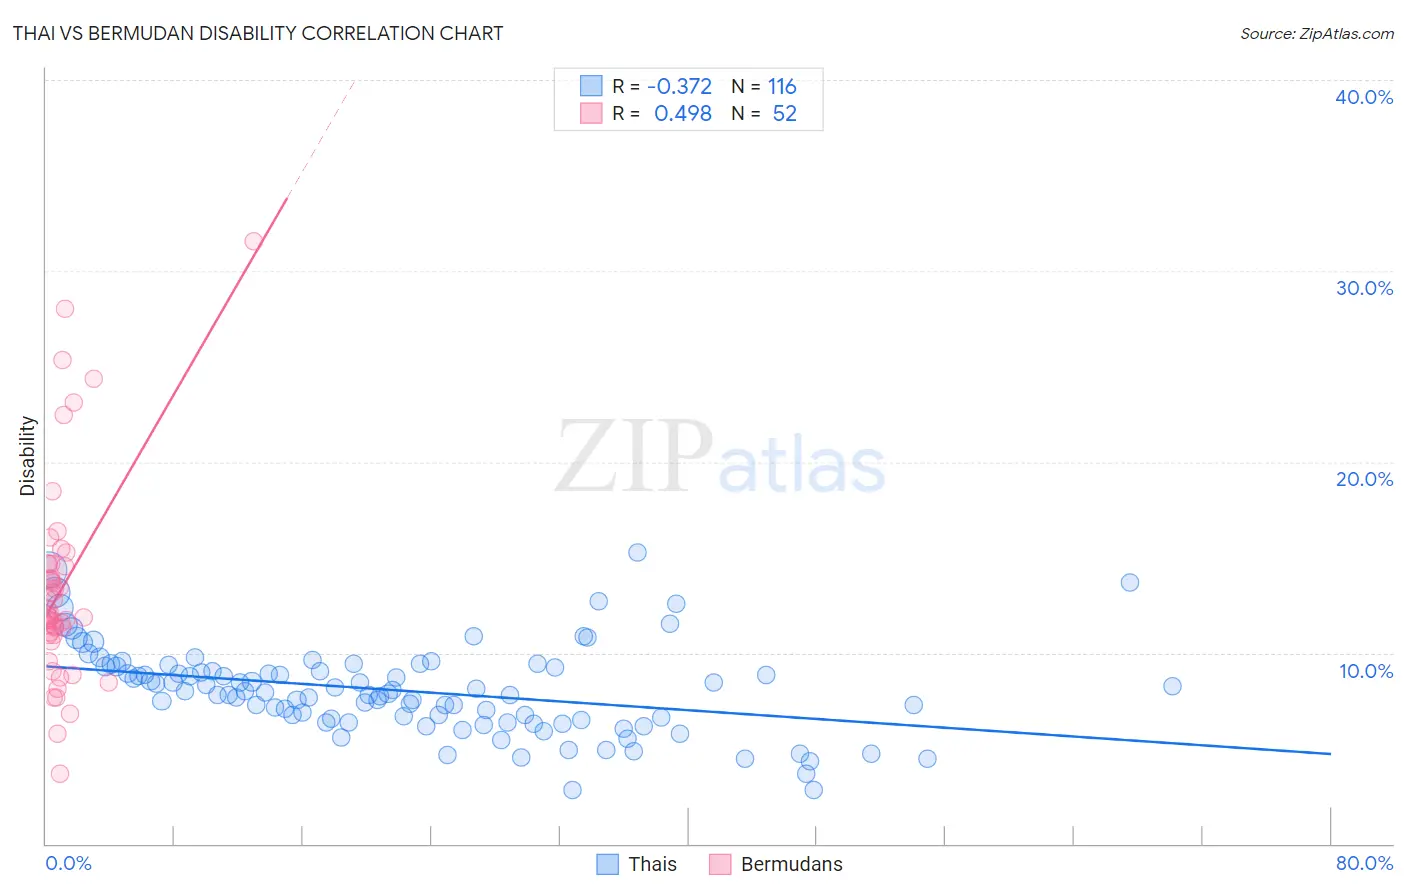
Thai vs Bermudan Disability Correlation Chart
The statistical analysis conducted on geographies consisting of 475,831,416 people shows a mild negative correlation between the proportion of Thais and percentage of population with a disability in the United States with a correlation coefficient (R) of -0.372 and weighted average of 9.7%. Similarly, the statistical analysis conducted on geographies consisting of 55,721,549 people shows a moderate positive correlation between the proportion of Bermudans and percentage of population with a disability in the United States with a correlation coefficient (R) of 0.498 and weighted average of 12.3%, a difference of 26.5%.
Disability Correlation Summary
| Measurement | Thai | Bermudan |
| Minimum | 2.8% | 3.7% |
| Maximum | 15.2% | 31.6% |
| Range | 12.4% | 27.9% |
| Mean | 8.0% | 13.4% |
| Median | 7.9% | 12.0% |
| Interquartile 25% (IQ1) | 6.5% | 10.9% |
| Interquartile 75% (IQ3) | 9.2% | 14.7% |
| Interquartile Range (IQR) | 2.7% | 3.7% |
| Standard Deviation (Sample) | 2.3% | 5.4% |
| Standard Deviation (Population) | 2.3% | 5.4% |
Similar Demographics by Disability
Demographics Similar to Thais by Disability
In terms of disability, the demographic groups most similar to Thais are Immigrants from Taiwan (9.6%, a difference of 1.1%), Filipino (9.6%, a difference of 1.1%), Immigrants from Bolivia (9.9%, a difference of 1.6%), Immigrants from India (9.5%, a difference of 2.1%), and Immigrants from South Central Asia (9.9%, a difference of 2.5%).
| Demographics | Rating | Rank | Disability |
| Immigrants | India | 100.0 /100 | #1 | Exceptional 9.5% |
| Filipinos | 100.0 /100 | #2 | Exceptional 9.6% |
| Immigrants | Taiwan | 100.0 /100 | #3 | Exceptional 9.6% |
| Thais | 100.0 /100 | #4 | Exceptional 9.7% |
| Immigrants | Bolivia | 100.0 /100 | #5 | Exceptional 9.9% |
| Immigrants | South Central Asia | 100.0 /100 | #6 | Exceptional 9.9% |
| Immigrants | Singapore | 100.0 /100 | #7 | Exceptional 10.0% |
| Bolivians | 100.0 /100 | #8 | Exceptional 10.0% |
| Immigrants | Hong Kong | 100.0 /100 | #9 | Exceptional 10.0% |
| Immigrants | China | 100.0 /100 | #10 | Exceptional 10.1% |
| Iranians | 100.0 /100 | #11 | Exceptional 10.1% |
| Immigrants | Israel | 100.0 /100 | #12 | Exceptional 10.1% |
| Immigrants | Eastern Asia | 100.0 /100 | #13 | Exceptional 10.2% |
| Immigrants | Korea | 100.0 /100 | #14 | Exceptional 10.2% |
| Okinawans | 100.0 /100 | #15 | Exceptional 10.3% |
Demographics Similar to Bermudans by Disability
In terms of disability, the demographic groups most similar to Bermudans are Subsaharan African (12.3%, a difference of 0.19%), European (12.3%, a difference of 0.19%), Carpatho Rusyn (12.3%, a difference of 0.20%), Guamanian/Chamorro (12.3%, a difference of 0.21%), and Indonesian (12.2%, a difference of 0.25%).
| Demographics | Rating | Rank | Disability |
| Liberians | 1.5 /100 | #245 | Tragic 12.2% |
| Swiss | 1.5 /100 | #246 | Tragic 12.2% |
| Indonesians | 1.4 /100 | #247 | Tragic 12.2% |
| Guamanians/Chamorros | 1.4 /100 | #248 | Tragic 12.3% |
| Carpatho Rusyns | 1.4 /100 | #249 | Tragic 12.3% |
| Sub-Saharan Africans | 1.4 /100 | #250 | Tragic 12.3% |
| Europeans | 1.4 /100 | #251 | Tragic 12.3% |
| Bermudans | 1.1 /100 | #252 | Tragic 12.3% |
| Belgians | 0.8 /100 | #253 | Tragic 12.3% |
| German Russians | 0.8 /100 | #254 | Tragic 12.3% |
| Slovenes | 0.6 /100 | #255 | Tragic 12.4% |
| Immigrants | Dominica | 0.6 /100 | #256 | Tragic 12.4% |
| Immigrants | Laos | 0.5 /100 | #257 | Tragic 12.4% |
| Slavs | 0.5 /100 | #258 | Tragic 12.4% |
| Canadians | 0.4 /100 | #259 | Tragic 12.4% |