Thai vs Black/African American Disability
COMPARE
Thai
Black/African American
Disability
Disability Comparison
Thais
Blacks/African Americans
9.7%
DISABILITY
100.0/ 100
METRIC RATING
4th/ 347
METRIC RANK
13.7%
DISABILITY
0.0/ 100
METRIC RATING
314th/ 347
METRIC RANK
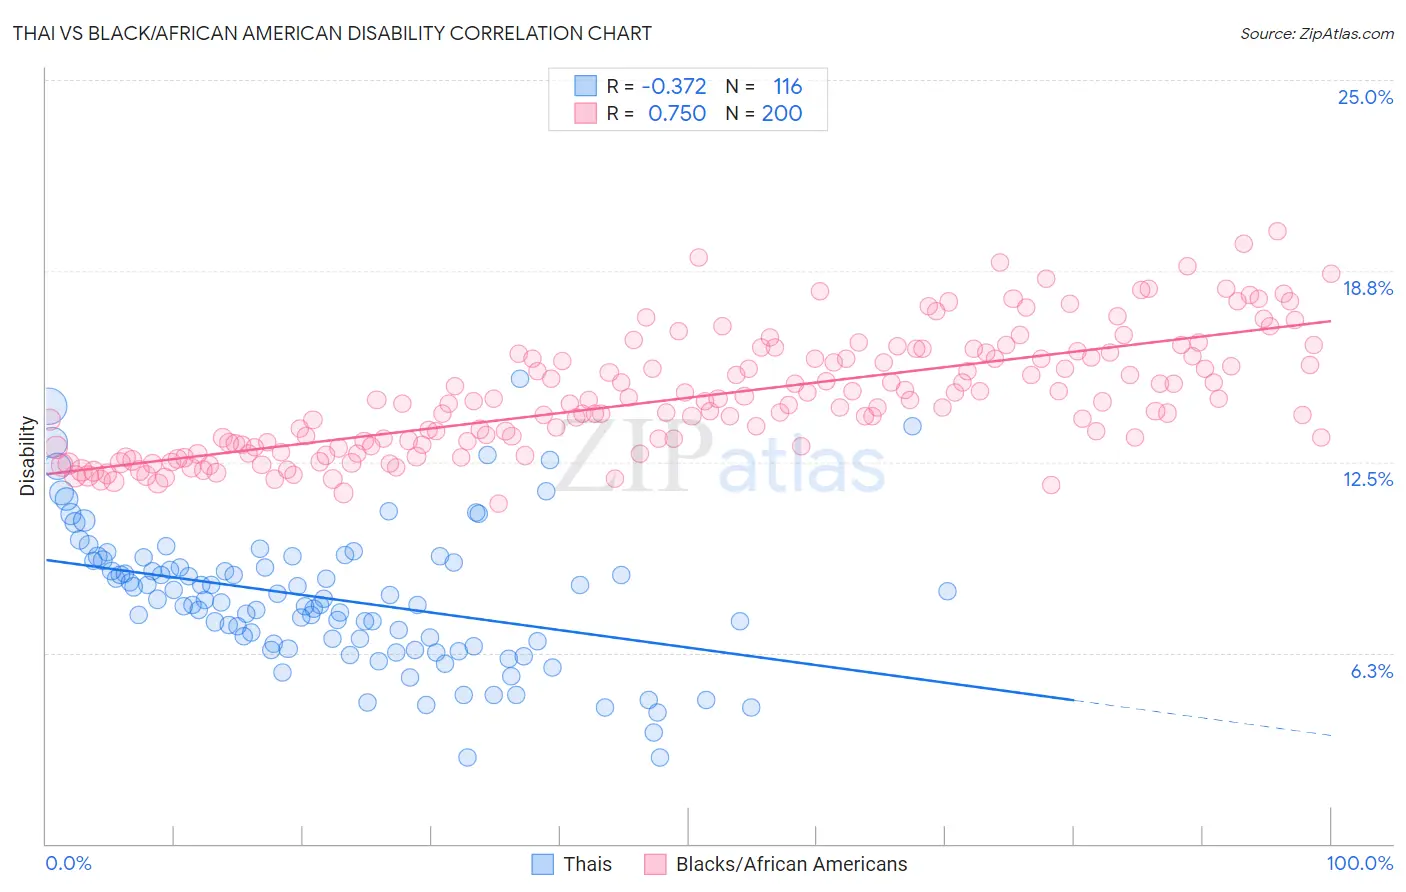
Thai vs Black/African American Disability Correlation Chart
The statistical analysis conducted on geographies consisting of 475,831,416 people shows a mild negative correlation between the proportion of Thais and percentage of population with a disability in the United States with a correlation coefficient (R) of -0.372 and weighted average of 9.7%. Similarly, the statistical analysis conducted on geographies consisting of 565,891,121 people shows a strong positive correlation between the proportion of Blacks/African Americans and percentage of population with a disability in the United States with a correlation coefficient (R) of 0.750 and weighted average of 13.7%, a difference of 41.1%.
Disability Correlation Summary
| Measurement | Thai | Black/African American |
| Minimum | 2.8% | 11.1% |
| Maximum | 15.2% | 20.0% |
| Range | 12.4% | 8.9% |
| Mean | 8.0% | 14.6% |
| Median | 7.9% | 14.4% |
| Interquartile 25% (IQ1) | 6.5% | 13.0% |
| Interquartile 75% (IQ3) | 9.2% | 15.9% |
| Interquartile Range (IQR) | 2.7% | 2.9% |
| Standard Deviation (Sample) | 2.3% | 1.9% |
| Standard Deviation (Population) | 2.3% | 1.9% |
Similar Demographics by Disability
Demographics Similar to Thais by Disability
In terms of disability, the demographic groups most similar to Thais are Immigrants from Taiwan (9.6%, a difference of 1.1%), Filipino (9.6%, a difference of 1.1%), Immigrants from Bolivia (9.9%, a difference of 1.6%), Immigrants from India (9.5%, a difference of 2.1%), and Immigrants from South Central Asia (9.9%, a difference of 2.5%).
| Demographics | Rating | Rank | Disability |
| Immigrants | India | 100.0 /100 | #1 | Exceptional 9.5% |
| Filipinos | 100.0 /100 | #2 | Exceptional 9.6% |
| Immigrants | Taiwan | 100.0 /100 | #3 | Exceptional 9.6% |
| Thais | 100.0 /100 | #4 | Exceptional 9.7% |
| Immigrants | Bolivia | 100.0 /100 | #5 | Exceptional 9.9% |
| Immigrants | South Central Asia | 100.0 /100 | #6 | Exceptional 9.9% |
| Immigrants | Singapore | 100.0 /100 | #7 | Exceptional 10.0% |
| Bolivians | 100.0 /100 | #8 | Exceptional 10.0% |
| Immigrants | Hong Kong | 100.0 /100 | #9 | Exceptional 10.0% |
| Immigrants | China | 100.0 /100 | #10 | Exceptional 10.1% |
| Iranians | 100.0 /100 | #11 | Exceptional 10.1% |
| Immigrants | Israel | 100.0 /100 | #12 | Exceptional 10.1% |
| Immigrants | Eastern Asia | 100.0 /100 | #13 | Exceptional 10.2% |
| Immigrants | Korea | 100.0 /100 | #14 | Exceptional 10.2% |
| Okinawans | 100.0 /100 | #15 | Exceptional 10.3% |
Demographics Similar to Blacks/African Americans by Disability
In terms of disability, the demographic groups most similar to Blacks/African Americans are Puget Sound Salish (13.7%, a difference of 0.0%), Pima (13.7%, a difference of 0.030%), Immigrants from Cabo Verde (13.7%, a difference of 0.030%), Cree (13.7%, a difference of 0.040%), and Spanish American (13.6%, a difference of 0.39%).
| Demographics | Rating | Rank | Disability |
| Shoshone | 0.0 /100 | #307 | Tragic 13.5% |
| French American Indians | 0.0 /100 | #308 | Tragic 13.5% |
| Tlingit-Haida | 0.0 /100 | #309 | Tragic 13.5% |
| Blackfeet | 0.0 /100 | #310 | Tragic 13.6% |
| Delaware | 0.0 /100 | #311 | Tragic 13.6% |
| Spanish Americans | 0.0 /100 | #312 | Tragic 13.6% |
| Cree | 0.0 /100 | #313 | Tragic 13.7% |
| Blacks/African Americans | 0.0 /100 | #314 | Tragic 13.7% |
| Puget Sound Salish | 0.0 /100 | #315 | Tragic 13.7% |
| Pima | 0.0 /100 | #316 | Tragic 13.7% |
| Immigrants | Cabo Verde | 0.0 /100 | #317 | Tragic 13.7% |
| Menominee | 0.0 /100 | #318 | Tragic 13.8% |
| Iroquois | 0.0 /100 | #319 | Tragic 13.8% |
| Apache | 0.0 /100 | #320 | Tragic 13.9% |
| Paiute | 0.0 /100 | #321 | Tragic 13.9% |