Nonimmigrants vs Immigrants from the Azores Disability
COMPARE
Nonimmigrants
Immigrants from the Azores
Disability
Disability Comparison
Nonimmigrants
Immigrants from the Azores
13.2%
DISABILITY
0.0/ 100
METRIC RATING
295th/ 347
METRIC RANK
14.2%
DISABILITY
0.0/ 100
METRIC RATING
328th/ 347
METRIC RANK
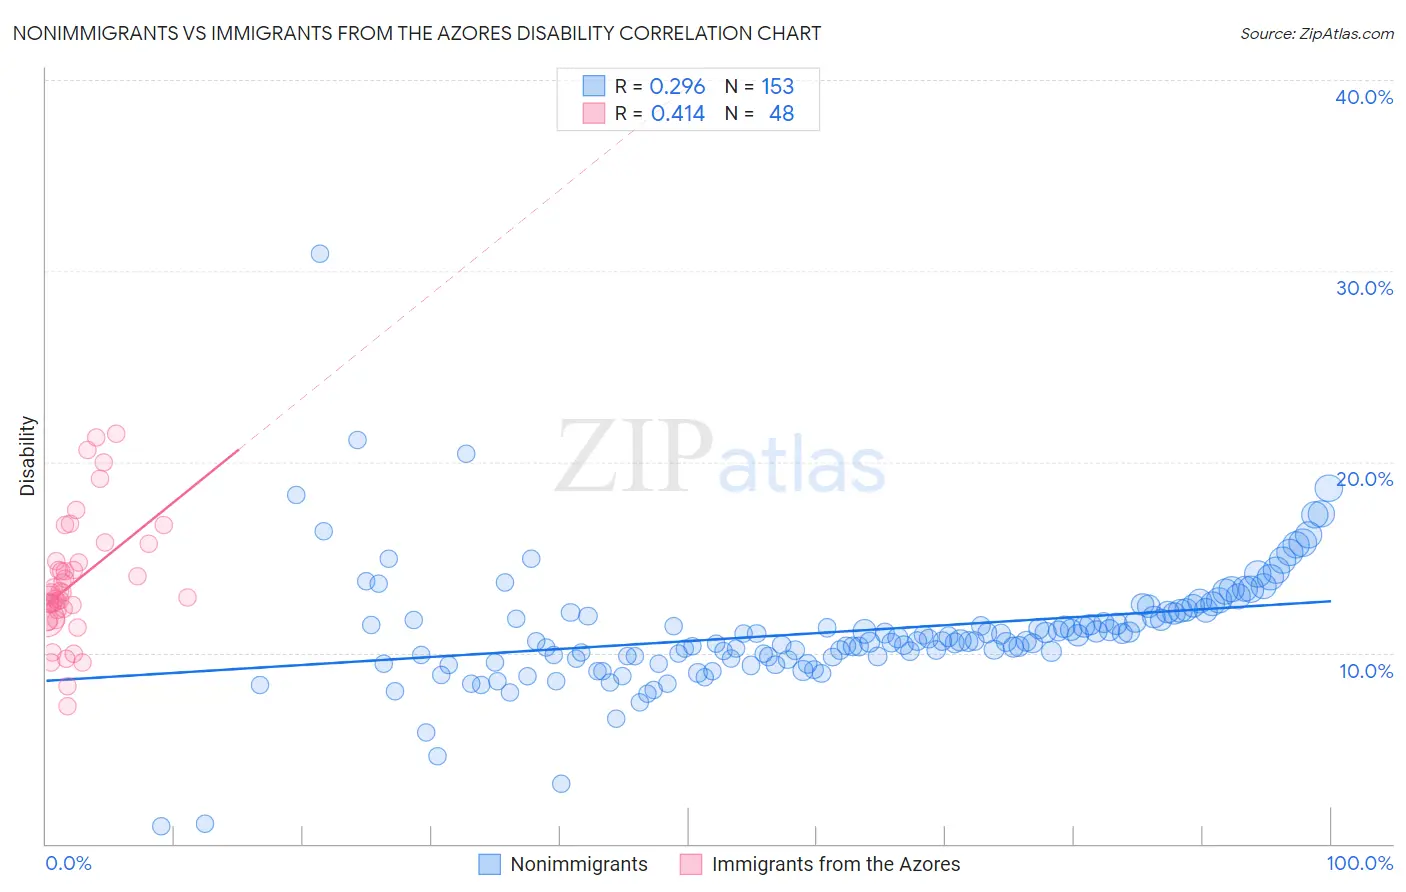
Nonimmigrants vs Immigrants from the Azores Disability Correlation Chart
The statistical analysis conducted on geographies consisting of 585,046,981 people shows a weak positive correlation between the proportion of Nonimmigrants and percentage of population with a disability in the United States with a correlation coefficient (R) of 0.296 and weighted average of 13.2%. Similarly, the statistical analysis conducted on geographies consisting of 46,257,178 people shows a moderate positive correlation between the proportion of Immigrants from the Azores and percentage of population with a disability in the United States with a correlation coefficient (R) of 0.414 and weighted average of 14.2%, a difference of 7.7%.
Disability Correlation Summary
| Measurement | Nonimmigrants | Immigrants from the Azores |
| Minimum | 0.89% | 7.2% |
| Maximum | 30.9% | 21.5% |
| Range | 30.0% | 14.3% |
| Mean | 11.1% | 13.7% |
| Median | 10.6% | 13.1% |
| Interquartile 25% (IQ1) | 9.7% | 12.0% |
| Interquartile 75% (IQ3) | 12.1% | 14.8% |
| Interquartile Range (IQR) | 2.4% | 2.7% |
| Standard Deviation (Sample) | 3.2% | 3.2% |
| Standard Deviation (Population) | 3.2% | 3.1% |
Similar Demographics by Disability
Demographics Similar to Nonimmigrants by Disability
In terms of disability, the demographic groups most similar to Nonimmigrants are Central American Indian (13.2%, a difference of 0.040%), Hopi (13.2%, a difference of 0.10%), Alaska Native (13.2%, a difference of 0.11%), Celtic (13.1%, a difference of 0.12%), and French (13.2%, a difference of 0.12%).
| Demographics | Rating | Rank | Disability |
| Whites/Caucasians | 0.0 /100 | #288 | Tragic 13.0% |
| Slovaks | 0.0 /100 | #289 | Tragic 13.0% |
| Cheyenne | 0.0 /100 | #290 | Tragic 13.0% |
| Yaqui | 0.0 /100 | #291 | Tragic 13.1% |
| Aleuts | 0.0 /100 | #292 | Tragic 13.1% |
| Marshallese | 0.0 /100 | #293 | Tragic 13.1% |
| Celtics | 0.0 /100 | #294 | Tragic 13.1% |
| Immigrants | Nonimmigrants | 0.0 /100 | #295 | Tragic 13.2% |
| Central American Indians | 0.0 /100 | #296 | Tragic 13.2% |
| Hopi | 0.0 /100 | #297 | Tragic 13.2% |
| Alaska Natives | 0.0 /100 | #298 | Tragic 13.2% |
| French | 0.0 /100 | #299 | Tragic 13.2% |
| Pennsylvania Germans | 0.0 /100 | #300 | Tragic 13.2% |
| Immigrants | Micronesia | 0.0 /100 | #301 | Tragic 13.2% |
| Arapaho | 0.0 /100 | #302 | Tragic 13.2% |
Demographics Similar to Immigrants from the Azores by Disability
In terms of disability, the demographic groups most similar to Immigrants from the Azores are Ottawa (14.2%, a difference of 0.0%), Osage (14.2%, a difference of 0.020%), Native/Alaskan (14.2%, a difference of 0.060%), Chippewa (14.1%, a difference of 0.10%), and Potawatomi (14.2%, a difference of 0.12%).
| Demographics | Rating | Rank | Disability |
| Paiute | 0.0 /100 | #321 | Tragic 13.9% |
| Americans | 0.0 /100 | #322 | Tragic 13.9% |
| Comanche | 0.0 /100 | #323 | Tragic 14.1% |
| Chippewa | 0.0 /100 | #324 | Tragic 14.1% |
| Natives/Alaskans | 0.0 /100 | #325 | Tragic 14.2% |
| Osage | 0.0 /100 | #326 | Tragic 14.2% |
| Ottawa | 0.0 /100 | #327 | Tragic 14.2% |
| Immigrants | Azores | 0.0 /100 | #328 | Tragic 14.2% |
| Potawatomi | 0.0 /100 | #329 | Tragic 14.2% |
| Navajo | 0.0 /100 | #330 | Tragic 14.3% |
| Alaskan Athabascans | 0.0 /100 | #331 | Tragic 14.4% |
| Pueblo | 0.0 /100 | #332 | Tragic 14.4% |
| Cajuns | 0.0 /100 | #333 | Tragic 14.6% |
| Yuman | 0.0 /100 | #334 | Tragic 14.6% |
| Tohono O'odham | 0.0 /100 | #335 | Tragic 14.8% |