Nonimmigrants vs Mexican Disability
COMPARE
Nonimmigrants
Mexican
Disability
Disability Comparison
Nonimmigrants
Mexicans
13.2%
DISABILITY
0.0/ 100
METRIC RATING
295th/ 347
METRIC RANK
12.1%
DISABILITY
3.7/ 100
METRIC RATING
224th/ 347
METRIC RANK
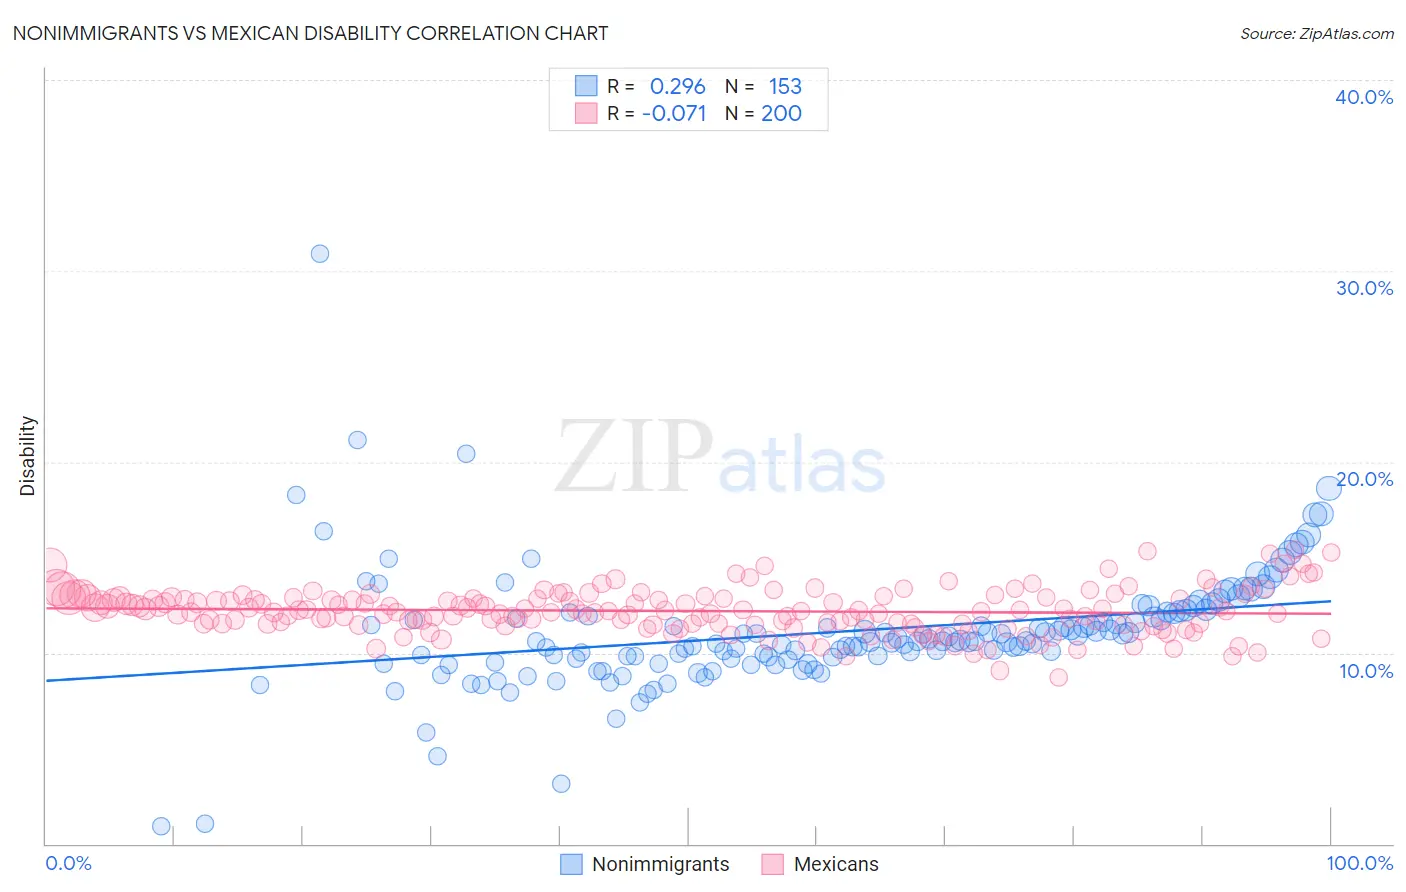
Nonimmigrants vs Mexican Disability Correlation Chart
The statistical analysis conducted on geographies consisting of 585,046,981 people shows a weak positive correlation between the proportion of Nonimmigrants and percentage of population with a disability in the United States with a correlation coefficient (R) of 0.296 and weighted average of 13.2%. Similarly, the statistical analysis conducted on geographies consisting of 565,156,927 people shows a slight negative correlation between the proportion of Mexicans and percentage of population with a disability in the United States with a correlation coefficient (R) of -0.071 and weighted average of 12.1%, a difference of 8.5%.
Disability Correlation Summary
| Measurement | Nonimmigrants | Mexican |
| Minimum | 0.89% | 8.7% |
| Maximum | 30.9% | 15.4% |
| Range | 30.0% | 6.7% |
| Mean | 11.1% | 12.2% |
| Median | 10.6% | 12.2% |
| Interquartile 25% (IQ1) | 9.7% | 11.5% |
| Interquartile 75% (IQ3) | 12.1% | 12.9% |
| Interquartile Range (IQR) | 2.4% | 1.3% |
| Standard Deviation (Sample) | 3.2% | 1.2% |
| Standard Deviation (Population) | 3.2% | 1.2% |
Similar Demographics by Disability
Demographics Similar to Nonimmigrants by Disability
In terms of disability, the demographic groups most similar to Nonimmigrants are Central American Indian (13.2%, a difference of 0.040%), Hopi (13.2%, a difference of 0.10%), Alaska Native (13.2%, a difference of 0.11%), Celtic (13.1%, a difference of 0.12%), and French (13.2%, a difference of 0.12%).
| Demographics | Rating | Rank | Disability |
| Whites/Caucasians | 0.0 /100 | #288 | Tragic 13.0% |
| Slovaks | 0.0 /100 | #289 | Tragic 13.0% |
| Cheyenne | 0.0 /100 | #290 | Tragic 13.0% |
| Yaqui | 0.0 /100 | #291 | Tragic 13.1% |
| Aleuts | 0.0 /100 | #292 | Tragic 13.1% |
| Marshallese | 0.0 /100 | #293 | Tragic 13.1% |
| Celtics | 0.0 /100 | #294 | Tragic 13.1% |
| Immigrants | Nonimmigrants | 0.0 /100 | #295 | Tragic 13.2% |
| Central American Indians | 0.0 /100 | #296 | Tragic 13.2% |
| Hopi | 0.0 /100 | #297 | Tragic 13.2% |
| Alaska Natives | 0.0 /100 | #298 | Tragic 13.2% |
| French | 0.0 /100 | #299 | Tragic 13.2% |
| Pennsylvania Germans | 0.0 /100 | #300 | Tragic 13.2% |
| Immigrants | Micronesia | 0.0 /100 | #301 | Tragic 13.2% |
| Arapaho | 0.0 /100 | #302 | Tragic 13.2% |
Demographics Similar to Mexicans by Disability
In terms of disability, the demographic groups most similar to Mexicans are Hispanic or Latino (12.1%, a difference of 0.060%), Senegalese (12.1%, a difference of 0.080%), Spanish American Indian (12.1%, a difference of 0.10%), Jamaican (12.1%, a difference of 0.13%), and Northern European (12.1%, a difference of 0.14%).
| Demographics | Rating | Rank | Disability |
| Immigrants | North America | 5.3 /100 | #217 | Tragic 12.1% |
| Immigrants | Jamaica | 5.0 /100 | #218 | Tragic 12.1% |
| Croatians | 4.9 /100 | #219 | Tragic 12.1% |
| Immigrants | Bahamas | 4.7 /100 | #220 | Tragic 12.1% |
| Northern Europeans | 4.2 /100 | #221 | Tragic 12.1% |
| Spanish American Indians | 4.1 /100 | #222 | Tragic 12.1% |
| Hispanics or Latinos | 3.9 /100 | #223 | Tragic 12.1% |
| Mexicans | 3.7 /100 | #224 | Tragic 12.1% |
| Senegalese | 3.5 /100 | #225 | Tragic 12.1% |
| Jamaicans | 3.3 /100 | #226 | Tragic 12.1% |
| Alsatians | 3.3 /100 | #227 | Tragic 12.1% |
| West Indians | 2.9 /100 | #228 | Tragic 12.2% |
| Inupiat | 2.8 /100 | #229 | Tragic 12.2% |
| Samoans | 2.6 /100 | #230 | Tragic 12.2% |
| Malaysians | 2.5 /100 | #231 | Tragic 12.2% |