Macedonian vs Greek Male Disability
COMPARE
Macedonian
Greek
Male Disability
Male Disability Comparison
Macedonians
Greeks
11.0%
MALE DISABILITY
84.2/ 100
METRIC RATING
131st/ 347
METRIC RANK
11.4%
MALE DISABILITY
22.2/ 100
METRIC RATING
193rd/ 347
METRIC RANK
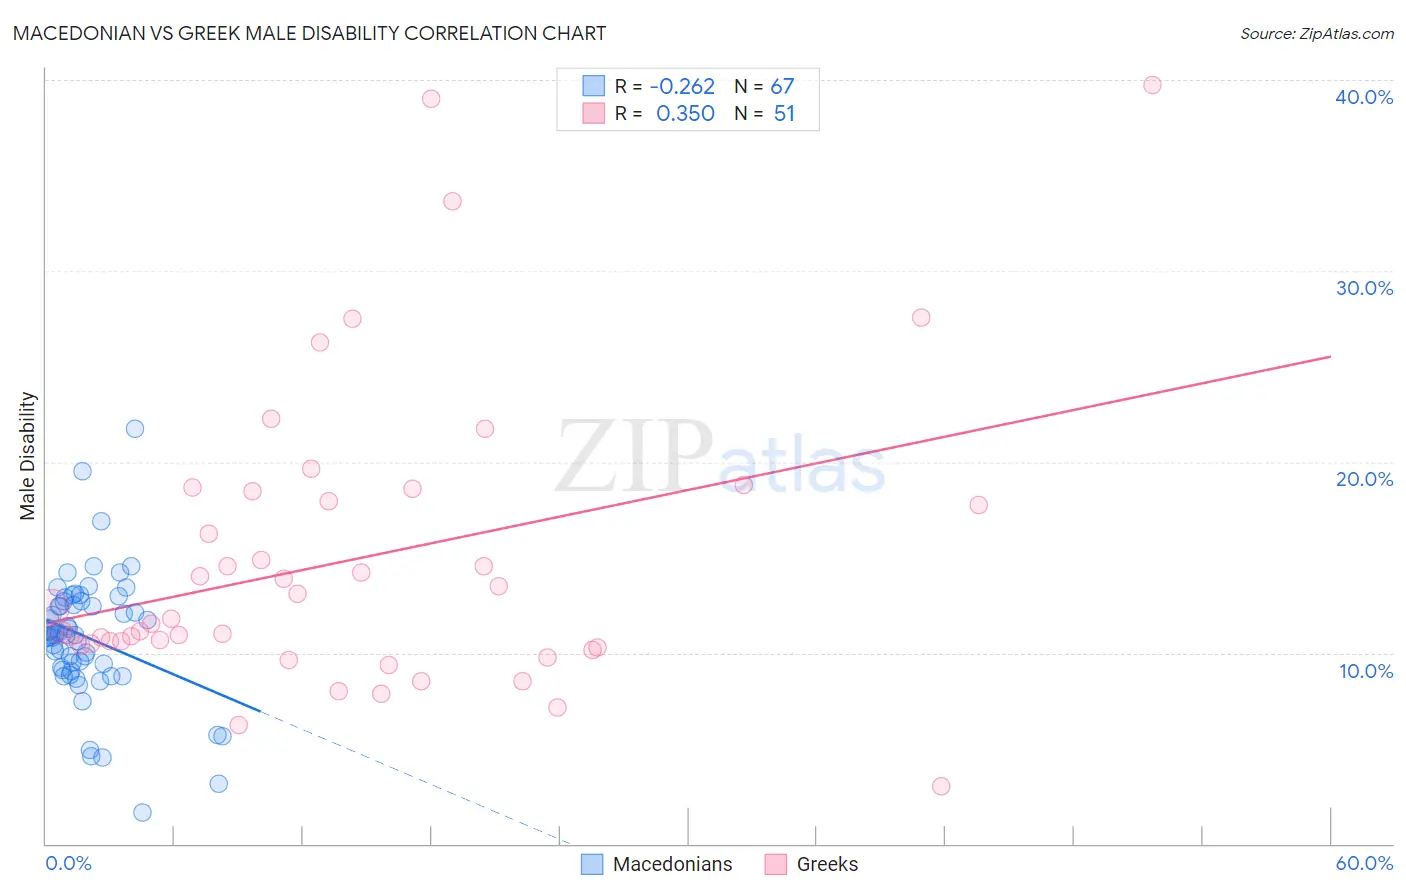
Macedonian vs Greek Male Disability Correlation Chart
The statistical analysis conducted on geographies consisting of 132,656,892 people shows a weak negative correlation between the proportion of Macedonians and percentage of males with a disability in the United States with a correlation coefficient (R) of -0.262 and weighted average of 11.0%. Similarly, the statistical analysis conducted on geographies consisting of 482,664,692 people shows a mild positive correlation between the proportion of Greeks and percentage of males with a disability in the United States with a correlation coefficient (R) of 0.350 and weighted average of 11.4%, a difference of 4.1%.
Male Disability Correlation Summary
| Measurement | Macedonian | Greek |
| Minimum | 1.6% | 3.0% |
| Maximum | 21.7% | 39.7% |
| Range | 20.1% | 36.7% |
| Mean | 10.8% | 14.9% |
| Median | 11.0% | 11.8% |
| Interquartile 25% (IQ1) | 9.1% | 10.4% |
| Interquartile 75% (IQ3) | 12.7% | 18.5% |
| Interquartile Range (IQR) | 3.6% | 8.1% |
| Standard Deviation (Sample) | 3.3% | 7.8% |
| Standard Deviation (Population) | 3.3% | 7.7% |
Similar Demographics by Male Disability
Demographics Similar to Macedonians by Male Disability
In terms of male disability, the demographic groups most similar to Macedonians are Immigrants from Fiji (11.0%, a difference of 0.020%), Ugandan (11.0%, a difference of 0.030%), Bhutanese (11.0%, a difference of 0.080%), Trinidadian and Tobagonian (11.0%, a difference of 0.10%), and Immigrants from Latvia (10.9%, a difference of 0.14%).
| Demographics | Rating | Rank | Male Disability |
| South American Indians | 88.1 /100 | #124 | Excellent 10.9% |
| Immigrants | North Macedonia | 88.1 /100 | #125 | Excellent 10.9% |
| Immigrants | Trinidad and Tobago | 86.9 /100 | #126 | Excellent 10.9% |
| Immigrants | Ukraine | 86.8 /100 | #127 | Excellent 10.9% |
| Immigrants | Latvia | 85.5 /100 | #128 | Excellent 10.9% |
| Immigrants | Philippines | 85.4 /100 | #129 | Excellent 10.9% |
| Brazilians | 85.4 /100 | #130 | Excellent 10.9% |
| Macedonians | 84.2 /100 | #131 | Excellent 11.0% |
| Immigrants | Fiji | 84.0 /100 | #132 | Excellent 11.0% |
| Ugandans | 83.9 /100 | #133 | Excellent 11.0% |
| Bhutanese | 83.4 /100 | #134 | Excellent 11.0% |
| Trinidadians and Tobagonians | 83.3 /100 | #135 | Excellent 11.0% |
| Immigrants | Costa Rica | 82.8 /100 | #136 | Excellent 11.0% |
| Immigrants | Europe | 82.0 /100 | #137 | Excellent 11.0% |
| Nigerians | 81.9 /100 | #138 | Excellent 11.0% |
Demographics Similar to Greeks by Male Disability
In terms of male disability, the demographic groups most similar to Greeks are Assyrian/Chaldean/Syriac (11.4%, a difference of 0.070%), Senegalese (11.4%, a difference of 0.080%), Belizean (11.4%, a difference of 0.080%), Immigrants from Oceania (11.4%, a difference of 0.11%), and Immigrants from Bosnia and Herzegovina (11.4%, a difference of 0.24%).
| Demographics | Rating | Rank | Male Disability |
| Immigrants | Zaire | 27.6 /100 | #186 | Fair 11.4% |
| Immigrants | Austria | 27.3 /100 | #187 | Fair 11.4% |
| Estonians | 26.8 /100 | #188 | Fair 11.4% |
| Immigrants | Netherlands | 25.9 /100 | #189 | Fair 11.4% |
| Immigrants | Bosnia and Herzegovina | 25.4 /100 | #190 | Fair 11.4% |
| Senegalese | 23.2 /100 | #191 | Fair 11.4% |
| Assyrians/Chaldeans/Syriacs | 23.2 /100 | #192 | Fair 11.4% |
| Greeks | 22.2 /100 | #193 | Fair 11.4% |
| Belizeans | 21.2 /100 | #194 | Fair 11.4% |
| Immigrants | Oceania | 20.9 /100 | #195 | Fair 11.4% |
| West Indians | 18.4 /100 | #196 | Poor 11.4% |
| Somalis | 18.2 /100 | #197 | Poor 11.4% |
| Immigrants | Jamaica | 16.3 /100 | #198 | Poor 11.5% |
| Lebanese | 15.4 /100 | #199 | Poor 11.5% |
| Immigrants | Iraq | 13.0 /100 | #200 | Poor 11.5% |