Macedonian vs Immigrants from Hungary Male Disability
COMPARE
Macedonian
Immigrants from Hungary
Male Disability
Male Disability Comparison
Macedonians
Immigrants from Hungary
11.0%
MALE DISABILITY
84.2/ 100
METRIC RATING
131st/ 347
METRIC RANK
11.1%
MALE DISABILITY
61.2/ 100
METRIC RATING
166th/ 347
METRIC RANK
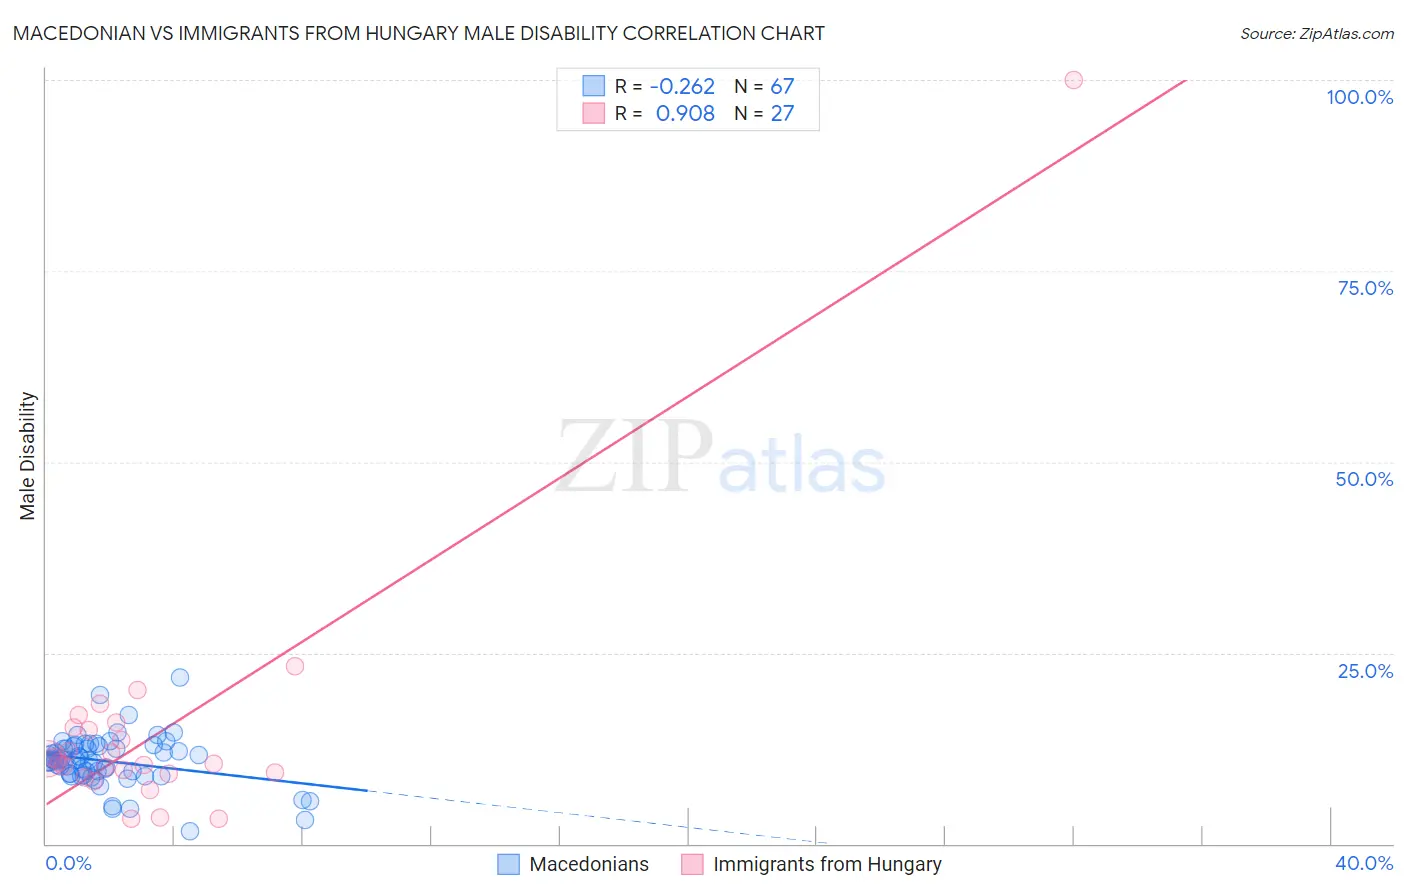
Macedonian vs Immigrants from Hungary Male Disability Correlation Chart
The statistical analysis conducted on geographies consisting of 132,656,892 people shows a weak negative correlation between the proportion of Macedonians and percentage of males with a disability in the United States with a correlation coefficient (R) of -0.262 and weighted average of 11.0%. Similarly, the statistical analysis conducted on geographies consisting of 195,705,126 people shows a near-perfect positive correlation between the proportion of Immigrants from Hungary and percentage of males with a disability in the United States with a correlation coefficient (R) of 0.908 and weighted average of 11.1%, a difference of 1.7%.
Male Disability Correlation Summary
| Measurement | Macedonian | Immigrants from Hungary |
| Minimum | 1.6% | 3.2% |
| Maximum | 21.7% | 100.0% |
| Range | 20.1% | 96.8% |
| Mean | 10.8% | 14.7% |
| Median | 11.0% | 10.7% |
| Interquartile 25% (IQ1) | 9.1% | 9.1% |
| Interquartile 75% (IQ3) | 12.7% | 15.3% |
| Interquartile Range (IQR) | 3.6% | 6.1% |
| Standard Deviation (Sample) | 3.3% | 17.7% |
| Standard Deviation (Population) | 3.3% | 17.4% |
Similar Demographics by Male Disability
Demographics Similar to Macedonians by Male Disability
In terms of male disability, the demographic groups most similar to Macedonians are Immigrants from Fiji (11.0%, a difference of 0.020%), Ugandan (11.0%, a difference of 0.030%), Bhutanese (11.0%, a difference of 0.080%), Trinidadian and Tobagonian (11.0%, a difference of 0.10%), and Immigrants from Latvia (10.9%, a difference of 0.14%).
| Demographics | Rating | Rank | Male Disability |
| South American Indians | 88.1 /100 | #124 | Excellent 10.9% |
| Immigrants | North Macedonia | 88.1 /100 | #125 | Excellent 10.9% |
| Immigrants | Trinidad and Tobago | 86.9 /100 | #126 | Excellent 10.9% |
| Immigrants | Ukraine | 86.8 /100 | #127 | Excellent 10.9% |
| Immigrants | Latvia | 85.5 /100 | #128 | Excellent 10.9% |
| Immigrants | Philippines | 85.4 /100 | #129 | Excellent 10.9% |
| Brazilians | 85.4 /100 | #130 | Excellent 10.9% |
| Macedonians | 84.2 /100 | #131 | Excellent 11.0% |
| Immigrants | Fiji | 84.0 /100 | #132 | Excellent 11.0% |
| Ugandans | 83.9 /100 | #133 | Excellent 11.0% |
| Bhutanese | 83.4 /100 | #134 | Excellent 11.0% |
| Trinidadians and Tobagonians | 83.3 /100 | #135 | Excellent 11.0% |
| Immigrants | Costa Rica | 82.8 /100 | #136 | Excellent 11.0% |
| Immigrants | Europe | 82.0 /100 | #137 | Excellent 11.0% |
| Nigerians | 81.9 /100 | #138 | Excellent 11.0% |
Demographics Similar to Immigrants from Hungary by Male Disability
In terms of male disability, the demographic groups most similar to Immigrants from Hungary are Luxembourger (11.1%, a difference of 0.040%), British West Indian (11.1%, a difference of 0.090%), Immigrants from Kenya (11.1%, a difference of 0.15%), Immigrants from Haiti (11.1%, a difference of 0.25%), and Immigrants from West Indies (11.1%, a difference of 0.27%).
| Demographics | Rating | Rank | Male Disability |
| Guatemalans | 67.2 /100 | #159 | Good 11.1% |
| Albanians | 66.5 /100 | #160 | Good 11.1% |
| Immigrants | West Indies | 65.7 /100 | #161 | Good 11.1% |
| Immigrants | Haiti | 65.3 /100 | #162 | Good 11.1% |
| Immigrants | Kenya | 63.8 /100 | #163 | Good 11.1% |
| British West Indians | 62.8 /100 | #164 | Good 11.1% |
| Luxembourgers | 61.9 /100 | #165 | Good 11.1% |
| Immigrants | Hungary | 61.2 /100 | #166 | Good 11.1% |
| Immigrants | Southern Europe | 54.4 /100 | #167 | Average 11.2% |
| Immigrants | Latin America | 54.0 /100 | #168 | Average 11.2% |
| Barbadians | 53.4 /100 | #169 | Average 11.2% |
| New Zealanders | 52.9 /100 | #170 | Average 11.2% |
| Haitians | 52.5 /100 | #171 | Average 11.2% |
| Romanians | 50.7 /100 | #172 | Average 11.2% |
| Immigrants | Burma/Myanmar | 50.4 /100 | #173 | Average 11.2% |