Macedonian vs White/Caucasian Male Disability
COMPARE
Macedonian
White/Caucasian
Male Disability
Male Disability Comparison
Macedonians
Whites/Caucasians
11.0%
MALE DISABILITY
84.2/ 100
METRIC RATING
131st/ 347
METRIC RANK
12.8%
MALE DISABILITY
0.0/ 100
METRIC RATING
291st/ 347
METRIC RANK
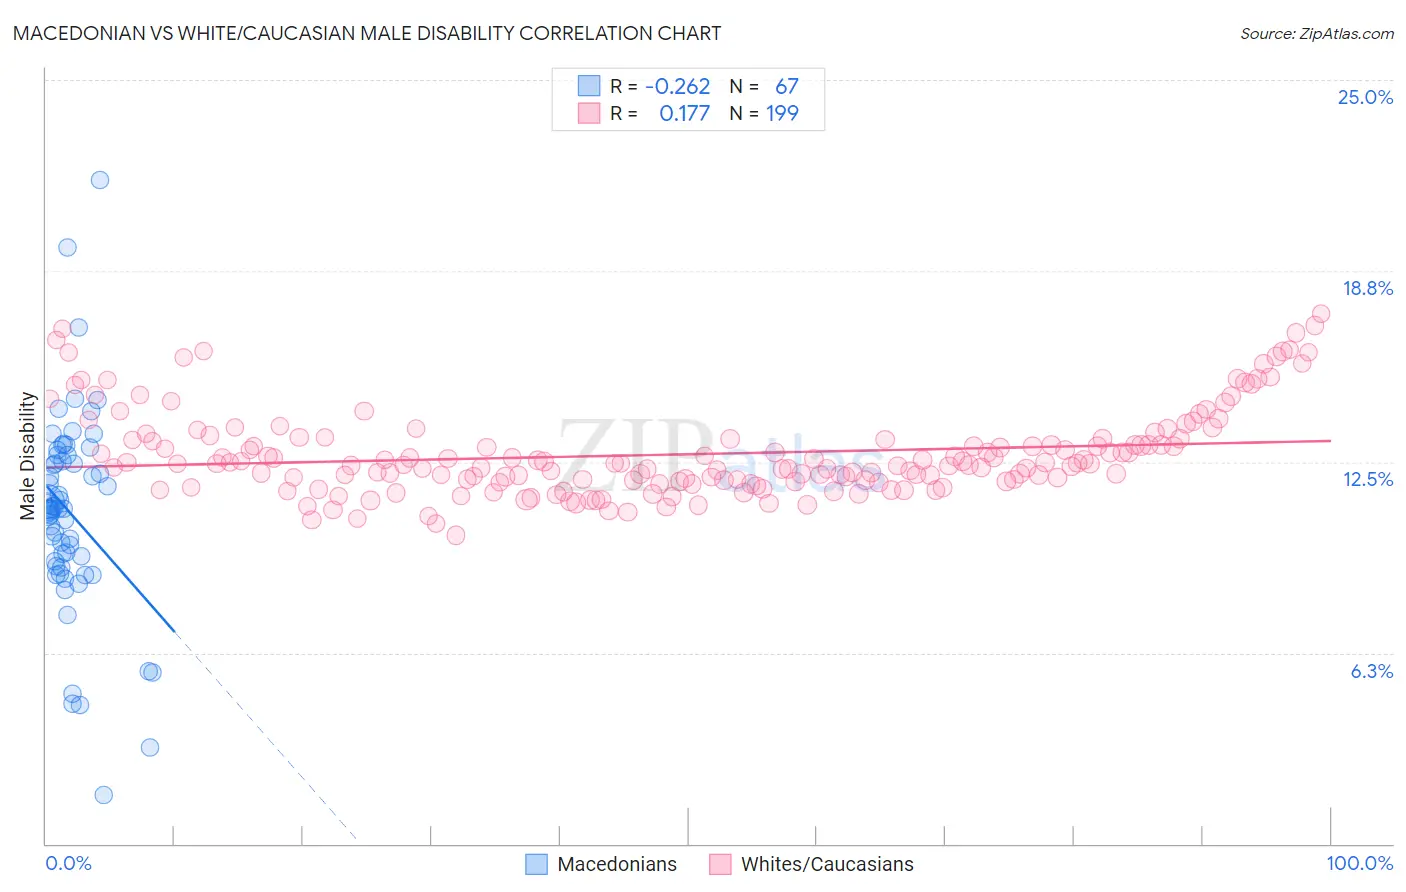
Macedonian vs White/Caucasian Male Disability Correlation Chart
The statistical analysis conducted on geographies consisting of 132,656,892 people shows a weak negative correlation between the proportion of Macedonians and percentage of males with a disability in the United States with a correlation coefficient (R) of -0.262 and weighted average of 11.0%. Similarly, the statistical analysis conducted on geographies consisting of 582,973,983 people shows a poor positive correlation between the proportion of Whites/Caucasians and percentage of males with a disability in the United States with a correlation coefficient (R) of 0.177 and weighted average of 12.8%, a difference of 17.2%.
Male Disability Correlation Summary
| Measurement | Macedonian | White/Caucasian |
| Minimum | 1.6% | 10.1% |
| Maximum | 21.7% | 17.4% |
| Range | 20.1% | 7.3% |
| Mean | 10.8% | 12.7% |
| Median | 11.0% | 12.4% |
| Interquartile 25% (IQ1) | 9.1% | 11.9% |
| Interquartile 75% (IQ3) | 12.7% | 13.2% |
| Interquartile Range (IQR) | 3.6% | 1.4% |
| Standard Deviation (Sample) | 3.3% | 1.4% |
| Standard Deviation (Population) | 3.3% | 1.4% |
Similar Demographics by Male Disability
Demographics Similar to Macedonians by Male Disability
In terms of male disability, the demographic groups most similar to Macedonians are Immigrants from Fiji (11.0%, a difference of 0.020%), Ugandan (11.0%, a difference of 0.030%), Bhutanese (11.0%, a difference of 0.080%), Trinidadian and Tobagonian (11.0%, a difference of 0.10%), and Immigrants from Latvia (10.9%, a difference of 0.14%).
| Demographics | Rating | Rank | Male Disability |
| South American Indians | 88.1 /100 | #124 | Excellent 10.9% |
| Immigrants | North Macedonia | 88.1 /100 | #125 | Excellent 10.9% |
| Immigrants | Trinidad and Tobago | 86.9 /100 | #126 | Excellent 10.9% |
| Immigrants | Ukraine | 86.8 /100 | #127 | Excellent 10.9% |
| Immigrants | Latvia | 85.5 /100 | #128 | Excellent 10.9% |
| Immigrants | Philippines | 85.4 /100 | #129 | Excellent 10.9% |
| Brazilians | 85.4 /100 | #130 | Excellent 10.9% |
| Macedonians | 84.2 /100 | #131 | Excellent 11.0% |
| Immigrants | Fiji | 84.0 /100 | #132 | Excellent 11.0% |
| Ugandans | 83.9 /100 | #133 | Excellent 11.0% |
| Bhutanese | 83.4 /100 | #134 | Excellent 11.0% |
| Trinidadians and Tobagonians | 83.3 /100 | #135 | Excellent 11.0% |
| Immigrants | Costa Rica | 82.8 /100 | #136 | Excellent 11.0% |
| Immigrants | Europe | 82.0 /100 | #137 | Excellent 11.0% |
| Nigerians | 81.9 /100 | #138 | Excellent 11.0% |
Demographics Similar to Whites/Caucasians by Male Disability
In terms of male disability, the demographic groups most similar to Whites/Caucasians are English (12.8%, a difference of 0.060%), Pima (12.8%, a difference of 0.090%), Immigrants from Cabo Verde (12.8%, a difference of 0.24%), Yaqui (12.9%, a difference of 0.34%), and Yup'ik (12.8%, a difference of 0.43%).
| Demographics | Rating | Rank | Male Disability |
| Spanish | 0.0 /100 | #284 | Tragic 12.7% |
| Welsh | 0.0 /100 | #285 | Tragic 12.7% |
| Scottish | 0.0 /100 | #286 | Tragic 12.8% |
| Cape Verdeans | 0.0 /100 | #287 | Tragic 12.8% |
| Yup'ik | 0.0 /100 | #288 | Tragic 12.8% |
| Immigrants | Cabo Verde | 0.0 /100 | #289 | Tragic 12.8% |
| Pima | 0.0 /100 | #290 | Tragic 12.8% |
| Whites/Caucasians | 0.0 /100 | #291 | Tragic 12.8% |
| English | 0.0 /100 | #292 | Tragic 12.8% |
| Yaqui | 0.0 /100 | #293 | Tragic 12.9% |
| Marshallese | 0.0 /100 | #294 | Tragic 12.9% |
| Immigrants | Micronesia | 0.0 /100 | #295 | Tragic 12.9% |
| Immigrants | Nonimmigrants | 0.0 /100 | #296 | Tragic 12.9% |
| Inupiat | 0.0 /100 | #297 | Tragic 13.0% |
| Pennsylvania Germans | 0.0 /100 | #298 | Tragic 13.0% |