Macedonian vs Palestinian Male Disability
COMPARE
Macedonian
Palestinian
Male Disability
Male Disability Comparison
Macedonians
Palestinians
11.0%
MALE DISABILITY
84.2/ 100
METRIC RATING
131st/ 347
METRIC RANK
10.7%
MALE DISABILITY
97.4/ 100
METRIC RATING
92nd/ 347
METRIC RANK
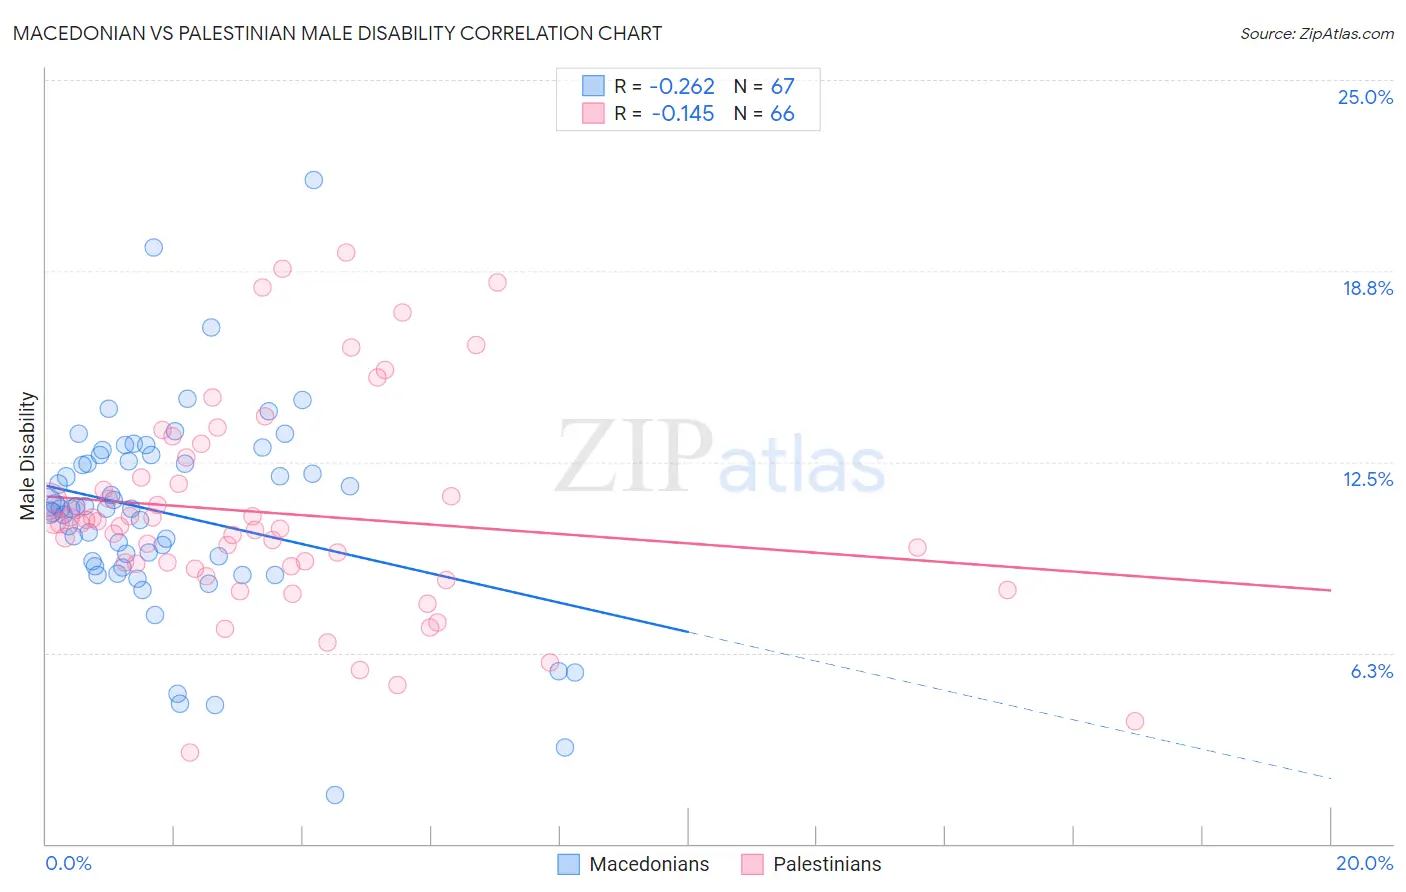
Macedonian vs Palestinian Male Disability Correlation Chart
The statistical analysis conducted on geographies consisting of 132,656,892 people shows a weak negative correlation between the proportion of Macedonians and percentage of males with a disability in the United States with a correlation coefficient (R) of -0.262 and weighted average of 11.0%. Similarly, the statistical analysis conducted on geographies consisting of 216,464,245 people shows a poor negative correlation between the proportion of Palestinians and percentage of males with a disability in the United States with a correlation coefficient (R) of -0.145 and weighted average of 10.7%, a difference of 2.8%.
Male Disability Correlation Summary
| Measurement | Macedonian | Palestinian |
| Minimum | 1.6% | 3.0% |
| Maximum | 21.7% | 19.3% |
| Range | 20.1% | 16.3% |
| Mean | 10.8% | 10.8% |
| Median | 11.0% | 10.5% |
| Interquartile 25% (IQ1) | 9.1% | 9.1% |
| Interquartile 75% (IQ3) | 12.7% | 12.0% |
| Interquartile Range (IQR) | 3.6% | 2.9% |
| Standard Deviation (Sample) | 3.3% | 3.4% |
| Standard Deviation (Population) | 3.3% | 3.4% |
Similar Demographics by Male Disability
Demographics Similar to Macedonians by Male Disability
In terms of male disability, the demographic groups most similar to Macedonians are Immigrants from Fiji (11.0%, a difference of 0.020%), Ugandan (11.0%, a difference of 0.030%), Bhutanese (11.0%, a difference of 0.080%), Trinidadian and Tobagonian (11.0%, a difference of 0.10%), and Immigrants from Latvia (10.9%, a difference of 0.14%).
| Demographics | Rating | Rank | Male Disability |
| South American Indians | 88.1 /100 | #124 | Excellent 10.9% |
| Immigrants | North Macedonia | 88.1 /100 | #125 | Excellent 10.9% |
| Immigrants | Trinidad and Tobago | 86.9 /100 | #126 | Excellent 10.9% |
| Immigrants | Ukraine | 86.8 /100 | #127 | Excellent 10.9% |
| Immigrants | Latvia | 85.5 /100 | #128 | Excellent 10.9% |
| Immigrants | Philippines | 85.4 /100 | #129 | Excellent 10.9% |
| Brazilians | 85.4 /100 | #130 | Excellent 10.9% |
| Macedonians | 84.2 /100 | #131 | Excellent 11.0% |
| Immigrants | Fiji | 84.0 /100 | #132 | Excellent 11.0% |
| Ugandans | 83.9 /100 | #133 | Excellent 11.0% |
| Bhutanese | 83.4 /100 | #134 | Excellent 11.0% |
| Trinidadians and Tobagonians | 83.3 /100 | #135 | Excellent 11.0% |
| Immigrants | Costa Rica | 82.8 /100 | #136 | Excellent 11.0% |
| Immigrants | Europe | 82.0 /100 | #137 | Excellent 11.0% |
| Nigerians | 81.9 /100 | #138 | Excellent 11.0% |
Demographics Similar to Palestinians by Male Disability
In terms of male disability, the demographic groups most similar to Palestinians are Immigrants from St. Vincent and the Grenadines (10.7%, a difference of 0.13%), Immigrants from France (10.6%, a difference of 0.15%), Immigrants from Morocco (10.6%, a difference of 0.18%), Immigrants from Western Asia (10.6%, a difference of 0.24%), and Immigrants from Nicaragua (10.6%, a difference of 0.24%).
| Demographics | Rating | Rank | Male Disability |
| Sri Lankans | 97.9 /100 | #85 | Exceptional 10.6% |
| Immigrants | Ireland | 97.9 /100 | #86 | Exceptional 10.6% |
| Immigrants | Vietnam | 97.9 /100 | #87 | Exceptional 10.6% |
| Immigrants | Western Asia | 97.8 /100 | #88 | Exceptional 10.6% |
| Immigrants | Nicaragua | 97.8 /100 | #89 | Exceptional 10.6% |
| Immigrants | Morocco | 97.7 /100 | #90 | Exceptional 10.6% |
| Immigrants | France | 97.6 /100 | #91 | Exceptional 10.6% |
| Palestinians | 97.4 /100 | #92 | Exceptional 10.7% |
| Immigrants | St. Vincent and the Grenadines | 97.1 /100 | #93 | Exceptional 10.7% |
| Immigrants | Sweden | 96.9 /100 | #94 | Exceptional 10.7% |
| Chileans | 96.9 /100 | #95 | Exceptional 10.7% |
| Nicaraguans | 96.6 /100 | #96 | Exceptional 10.7% |
| Immigrants | Armenia | 96.6 /100 | #97 | Exceptional 10.7% |
| Immigrants | Romania | 96.5 /100 | #98 | Exceptional 10.7% |
| Immigrants | Switzerland | 96.1 /100 | #99 | Exceptional 10.7% |