Immigrants from Peru vs Korean Disability
COMPARE
Immigrants from Peru
Korean
Disability
Disability Comparison
Immigrants from Peru
Koreans
10.8%
DISABILITY
99.9/ 100
METRIC RATING
45th/ 347
METRIC RANK
11.3%
DISABILITY
93.8/ 100
METRIC RATING
118th/ 347
METRIC RANK
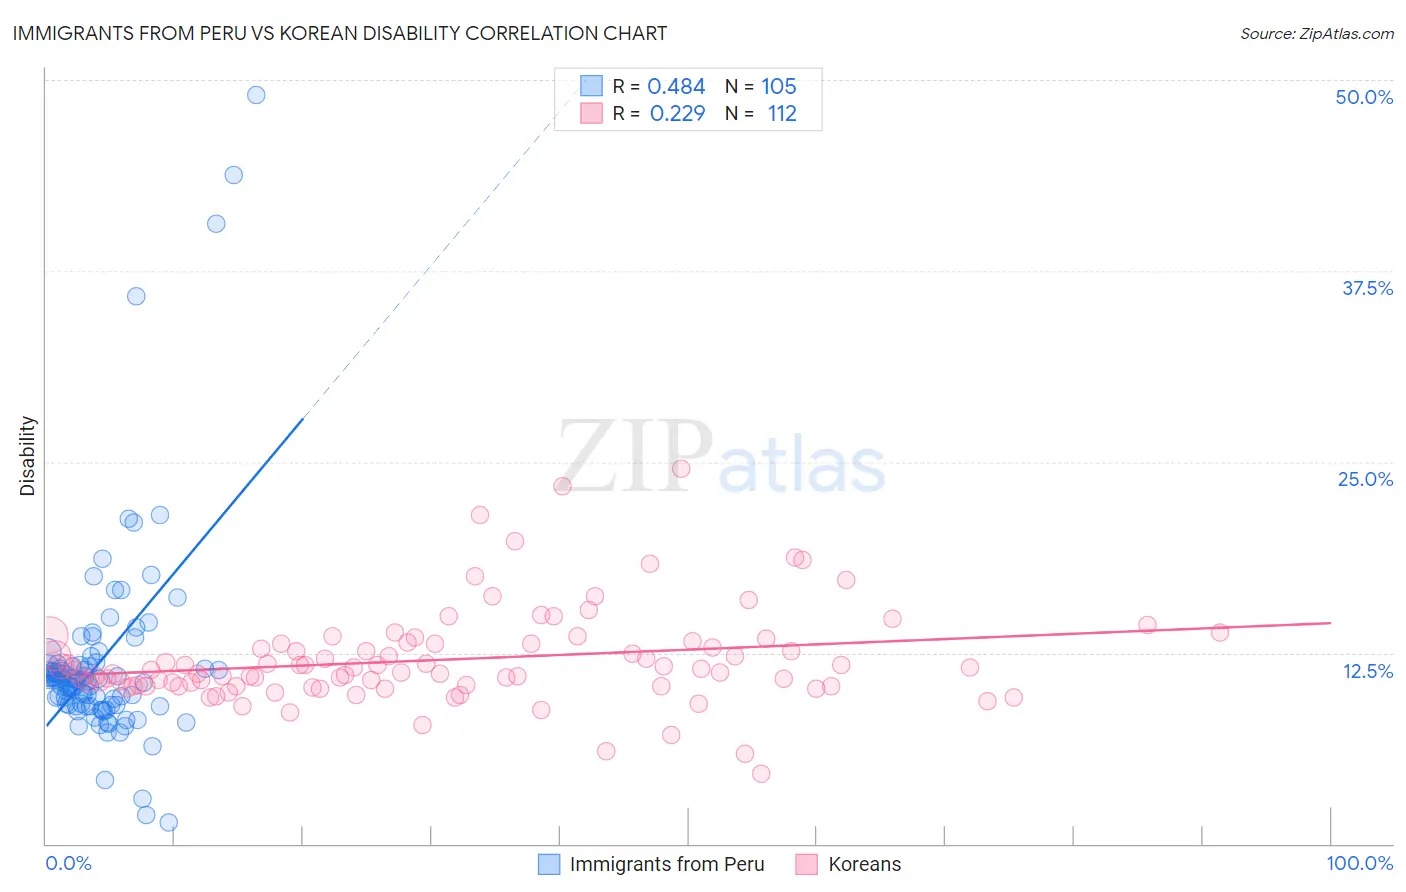
Immigrants from Peru vs Korean Disability Correlation Chart
The statistical analysis conducted on geographies consisting of 328,839,266 people shows a moderate positive correlation between the proportion of Immigrants from Peru and percentage of population with a disability in the United States with a correlation coefficient (R) of 0.484 and weighted average of 10.8%. Similarly, the statistical analysis conducted on geographies consisting of 510,851,171 people shows a weak positive correlation between the proportion of Koreans and percentage of population with a disability in the United States with a correlation coefficient (R) of 0.229 and weighted average of 11.3%, a difference of 4.8%.
Disability Correlation Summary
| Measurement | Immigrants from Peru | Korean |
| Minimum | 1.4% | 4.6% |
| Maximum | 49.0% | 24.5% |
| Range | 47.6% | 20.0% |
| Mean | 12.0% | 12.1% |
| Median | 10.7% | 11.3% |
| Interquartile 25% (IQ1) | 9.1% | 10.3% |
| Interquartile 75% (IQ3) | 11.7% | 13.1% |
| Interquartile Range (IQR) | 2.6% | 2.8% |
| Standard Deviation (Sample) | 7.0% | 3.1% |
| Standard Deviation (Population) | 6.9% | 3.1% |
Similar Demographics by Disability
Demographics Similar to Immigrants from Peru by Disability
In terms of disability, the demographic groups most similar to Immigrants from Peru are Tongan (10.8%, a difference of 0.010%), Taiwanese (10.8%, a difference of 0.020%), Soviet Union (10.9%, a difference of 0.21%), Vietnamese (10.9%, a difference of 0.27%), and Immigrants from Saudi Arabia (10.9%, a difference of 0.27%).
| Demographics | Rating | Rank | Disability |
| Afghans | 99.9 /100 | #38 | Exceptional 10.8% |
| Cambodians | 99.9 /100 | #39 | Exceptional 10.8% |
| Mongolians | 99.9 /100 | #40 | Exceptional 10.8% |
| Immigrants | Australia | 99.9 /100 | #41 | Exceptional 10.8% |
| Immigrants | Nepal | 99.9 /100 | #42 | Exceptional 10.8% |
| Israelis | 99.9 /100 | #43 | Exceptional 10.8% |
| Immigrants | Japan | 99.9 /100 | #44 | Exceptional 10.8% |
| Immigrants | Peru | 99.9 /100 | #45 | Exceptional 10.8% |
| Tongans | 99.9 /100 | #46 | Exceptional 10.8% |
| Taiwanese | 99.9 /100 | #47 | Exceptional 10.8% |
| Soviet Union | 99.9 /100 | #48 | Exceptional 10.9% |
| Vietnamese | 99.9 /100 | #49 | Exceptional 10.9% |
| Immigrants | Saudi Arabia | 99.9 /100 | #50 | Exceptional 10.9% |
| Peruvians | 99.8 /100 | #51 | Exceptional 10.9% |
| South Americans | 99.8 /100 | #52 | Exceptional 10.9% |
Demographics Similar to Koreans by Disability
In terms of disability, the demographic groups most similar to Koreans are Luxembourger (11.3%, a difference of 0.010%), Central American (11.4%, a difference of 0.050%), Immigrants from North Macedonia (11.4%, a difference of 0.060%), Immigrants from Northern Europe (11.3%, a difference of 0.070%), and Immigrants from Costa Rica (11.4%, a difference of 0.070%).
| Demographics | Rating | Rank | Disability |
| Immigrants | South Eastern Asia | 95.4 /100 | #111 | Exceptional 11.3% |
| Immigrants | Uzbekistan | 94.9 /100 | #112 | Exceptional 11.3% |
| Guyanese | 94.7 /100 | #113 | Exceptional 11.3% |
| Immigrants | Syria | 94.7 /100 | #114 | Exceptional 11.3% |
| Immigrants | Philippines | 94.6 /100 | #115 | Exceptional 11.3% |
| Immigrants | Northern Europe | 94.1 /100 | #116 | Exceptional 11.3% |
| Luxembourgers | 93.9 /100 | #117 | Exceptional 11.3% |
| Koreans | 93.8 /100 | #118 | Exceptional 11.3% |
| Central Americans | 93.5 /100 | #119 | Exceptional 11.4% |
| Immigrants | North Macedonia | 93.5 /100 | #120 | Exceptional 11.4% |
| Immigrants | Costa Rica | 93.4 /100 | #121 | Exceptional 11.4% |
| Brazilians | 93.3 /100 | #122 | Exceptional 11.4% |
| South Africans | 92.3 /100 | #123 | Exceptional 11.4% |
| South American Indians | 92.2 /100 | #124 | Exceptional 11.4% |
| Costa Ricans | 91.9 /100 | #125 | Exceptional 11.4% |