Immigrants from Peru vs Immigrants from Hong Kong Disability
COMPARE
Immigrants from Peru
Immigrants from Hong Kong
Disability
Disability Comparison
Immigrants from Peru
Immigrants from Hong Kong
10.8%
DISABILITY
99.9/ 100
METRIC RATING
45th/ 347
METRIC RANK
10.0%
DISABILITY
100.0/ 100
METRIC RATING
9th/ 347
METRIC RANK
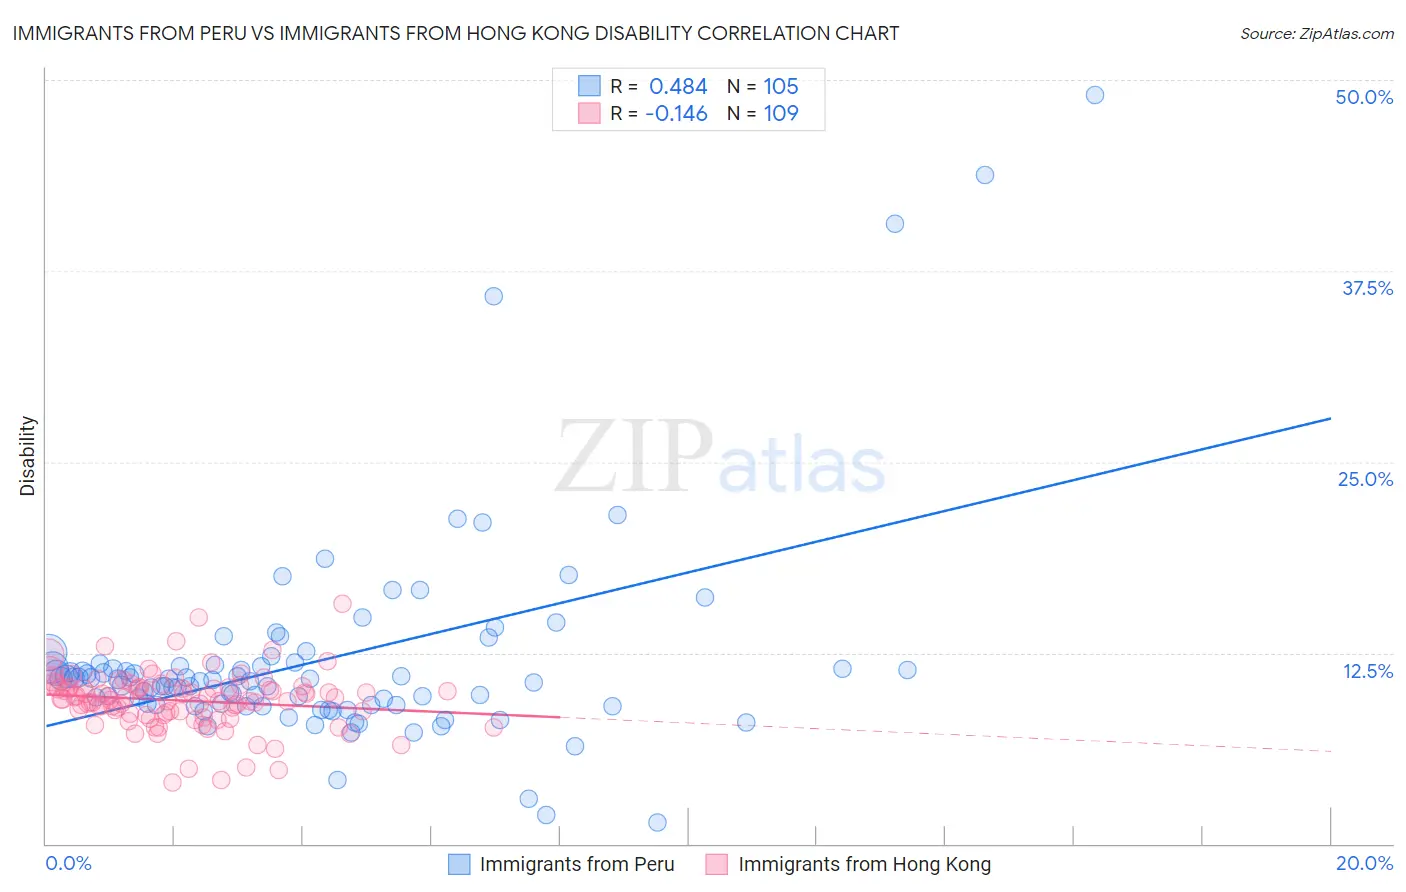
Immigrants from Peru vs Immigrants from Hong Kong Disability Correlation Chart
The statistical analysis conducted on geographies consisting of 328,839,266 people shows a moderate positive correlation between the proportion of Immigrants from Peru and percentage of population with a disability in the United States with a correlation coefficient (R) of 0.484 and weighted average of 10.8%. Similarly, the statistical analysis conducted on geographies consisting of 253,995,136 people shows a poor negative correlation between the proportion of Immigrants from Hong Kong and percentage of population with a disability in the United States with a correlation coefficient (R) of -0.146 and weighted average of 10.0%, a difference of 7.9%.
Disability Correlation Summary
| Measurement | Immigrants from Peru | Immigrants from Hong Kong |
| Minimum | 1.4% | 4.0% |
| Maximum | 49.0% | 15.7% |
| Range | 47.6% | 11.7% |
| Mean | 12.0% | 9.4% |
| Median | 10.7% | 9.5% |
| Interquartile 25% (IQ1) | 9.1% | 8.5% |
| Interquartile 75% (IQ3) | 11.7% | 10.2% |
| Interquartile Range (IQR) | 2.6% | 1.8% |
| Standard Deviation (Sample) | 7.0% | 1.9% |
| Standard Deviation (Population) | 6.9% | 1.9% |
Similar Demographics by Disability
Demographics Similar to Immigrants from Peru by Disability
In terms of disability, the demographic groups most similar to Immigrants from Peru are Tongan (10.8%, a difference of 0.010%), Taiwanese (10.8%, a difference of 0.020%), Soviet Union (10.9%, a difference of 0.21%), Vietnamese (10.9%, a difference of 0.27%), and Immigrants from Saudi Arabia (10.9%, a difference of 0.27%).
| Demographics | Rating | Rank | Disability |
| Afghans | 99.9 /100 | #38 | Exceptional 10.8% |
| Cambodians | 99.9 /100 | #39 | Exceptional 10.8% |
| Mongolians | 99.9 /100 | #40 | Exceptional 10.8% |
| Immigrants | Australia | 99.9 /100 | #41 | Exceptional 10.8% |
| Immigrants | Nepal | 99.9 /100 | #42 | Exceptional 10.8% |
| Israelis | 99.9 /100 | #43 | Exceptional 10.8% |
| Immigrants | Japan | 99.9 /100 | #44 | Exceptional 10.8% |
| Immigrants | Peru | 99.9 /100 | #45 | Exceptional 10.8% |
| Tongans | 99.9 /100 | #46 | Exceptional 10.8% |
| Taiwanese | 99.9 /100 | #47 | Exceptional 10.8% |
| Soviet Union | 99.9 /100 | #48 | Exceptional 10.9% |
| Vietnamese | 99.9 /100 | #49 | Exceptional 10.9% |
| Immigrants | Saudi Arabia | 99.9 /100 | #50 | Exceptional 10.9% |
| Peruvians | 99.8 /100 | #51 | Exceptional 10.9% |
| South Americans | 99.8 /100 | #52 | Exceptional 10.9% |
Demographics Similar to Immigrants from Hong Kong by Disability
In terms of disability, the demographic groups most similar to Immigrants from Hong Kong are Bolivian (10.0%, a difference of 0.30%), Immigrants from Singapore (10.0%, a difference of 0.52%), Immigrants from China (10.1%, a difference of 0.81%), Iranian (10.1%, a difference of 0.82%), and Immigrants from South Central Asia (9.9%, a difference of 0.84%).
| Demographics | Rating | Rank | Disability |
| Filipinos | 100.0 /100 | #2 | Exceptional 9.6% |
| Immigrants | Taiwan | 100.0 /100 | #3 | Exceptional 9.6% |
| Thais | 100.0 /100 | #4 | Exceptional 9.7% |
| Immigrants | Bolivia | 100.0 /100 | #5 | Exceptional 9.9% |
| Immigrants | South Central Asia | 100.0 /100 | #6 | Exceptional 9.9% |
| Immigrants | Singapore | 100.0 /100 | #7 | Exceptional 10.0% |
| Bolivians | 100.0 /100 | #8 | Exceptional 10.0% |
| Immigrants | Hong Kong | 100.0 /100 | #9 | Exceptional 10.0% |
| Immigrants | China | 100.0 /100 | #10 | Exceptional 10.1% |
| Iranians | 100.0 /100 | #11 | Exceptional 10.1% |
| Immigrants | Israel | 100.0 /100 | #12 | Exceptional 10.1% |
| Immigrants | Eastern Asia | 100.0 /100 | #13 | Exceptional 10.2% |
| Immigrants | Korea | 100.0 /100 | #14 | Exceptional 10.2% |
| Okinawans | 100.0 /100 | #15 | Exceptional 10.3% |
| Indians (Asian) | 100.0 /100 | #16 | Exceptional 10.3% |