European vs West Indian Disability
COMPARE
European
West Indian
Disability
Disability Comparison
Europeans
West Indians
12.3%
DISABILITY
1.4/ 100
METRIC RATING
251st/ 347
METRIC RANK
12.2%
DISABILITY
2.9/ 100
METRIC RATING
228th/ 347
METRIC RANK
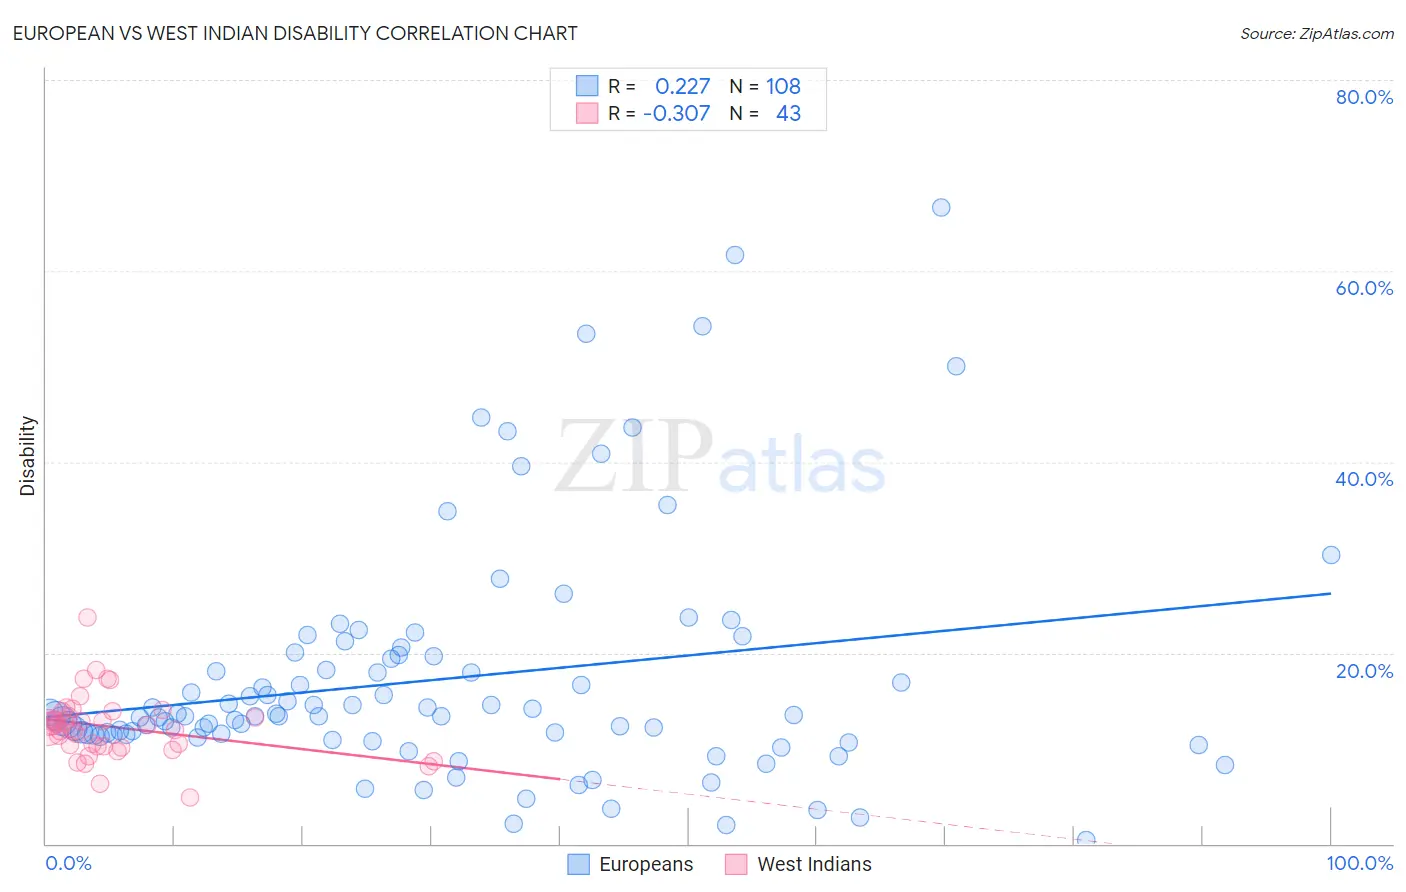
European vs West Indian Disability Correlation Chart
The statistical analysis conducted on geographies consisting of 561,707,574 people shows a weak positive correlation between the proportion of Europeans and percentage of population with a disability in the United States with a correlation coefficient (R) of 0.227 and weighted average of 12.3%. Similarly, the statistical analysis conducted on geographies consisting of 254,018,929 people shows a mild negative correlation between the proportion of West Indians and percentage of population with a disability in the United States with a correlation coefficient (R) of -0.307 and weighted average of 12.2%, a difference of 0.82%.
Disability Correlation Summary
| Measurement | European | West Indian |
| Minimum | 0.41% | 4.9% |
| Maximum | 66.7% | 23.8% |
| Range | 66.3% | 18.9% |
| Mean | 17.2% | 12.2% |
| Median | 13.4% | 12.4% |
| Interquartile 25% (IQ1) | 11.4% | 10.2% |
| Interquartile 75% (IQ3) | 19.6% | 13.9% |
| Interquartile Range (IQR) | 8.1% | 3.7% |
| Standard Deviation (Sample) | 12.4% | 3.3% |
| Standard Deviation (Population) | 12.3% | 3.3% |
Similar Demographics by Disability
Demographics Similar to Europeans by Disability
In terms of disability, the demographic groups most similar to Europeans are Subsaharan African (12.3%, a difference of 0.0%), Carpatho Rusyn (12.3%, a difference of 0.010%), Guamanian/Chamorro (12.3%, a difference of 0.020%), Indonesian (12.2%, a difference of 0.060%), and Swiss (12.2%, a difference of 0.090%).
| Demographics | Rating | Rank | Disability |
| Basques | 1.5 /100 | #244 | Tragic 12.2% |
| Liberians | 1.5 /100 | #245 | Tragic 12.2% |
| Swiss | 1.5 /100 | #246 | Tragic 12.2% |
| Indonesians | 1.4 /100 | #247 | Tragic 12.2% |
| Guamanians/Chamorros | 1.4 /100 | #248 | Tragic 12.3% |
| Carpatho Rusyns | 1.4 /100 | #249 | Tragic 12.3% |
| Sub-Saharan Africans | 1.4 /100 | #250 | Tragic 12.3% |
| Europeans | 1.4 /100 | #251 | Tragic 12.3% |
| Bermudans | 1.1 /100 | #252 | Tragic 12.3% |
| Belgians | 0.8 /100 | #253 | Tragic 12.3% |
| German Russians | 0.8 /100 | #254 | Tragic 12.3% |
| Slovenes | 0.6 /100 | #255 | Tragic 12.4% |
| Immigrants | Dominica | 0.6 /100 | #256 | Tragic 12.4% |
| Immigrants | Laos | 0.5 /100 | #257 | Tragic 12.4% |
| Slavs | 0.5 /100 | #258 | Tragic 12.4% |
Demographics Similar to West Indians by Disability
In terms of disability, the demographic groups most similar to West Indians are Inupiat (12.2%, a difference of 0.020%), Samoan (12.2%, a difference of 0.10%), Malaysian (12.2%, a difference of 0.13%), Alsatian (12.1%, a difference of 0.14%), and Italian (12.2%, a difference of 0.14%).
| Demographics | Rating | Rank | Disability |
| Northern Europeans | 4.2 /100 | #221 | Tragic 12.1% |
| Spanish American Indians | 4.1 /100 | #222 | Tragic 12.1% |
| Hispanics or Latinos | 3.9 /100 | #223 | Tragic 12.1% |
| Mexicans | 3.7 /100 | #224 | Tragic 12.1% |
| Senegalese | 3.5 /100 | #225 | Tragic 12.1% |
| Jamaicans | 3.3 /100 | #226 | Tragic 12.1% |
| Alsatians | 3.3 /100 | #227 | Tragic 12.1% |
| West Indians | 2.9 /100 | #228 | Tragic 12.2% |
| Inupiat | 2.8 /100 | #229 | Tragic 12.2% |
| Samoans | 2.6 /100 | #230 | Tragic 12.2% |
| Malaysians | 2.5 /100 | #231 | Tragic 12.2% |
| Italians | 2.5 /100 | #232 | Tragic 12.2% |
| Bahamians | 2.3 /100 | #233 | Tragic 12.2% |
| Japanese | 2.3 /100 | #234 | Tragic 12.2% |
| Yup'ik | 2.2 /100 | #235 | Tragic 12.2% |