Danish vs Trinidadian and Tobagonian Male Disability
COMPARE
Danish
Trinidadian and Tobagonian
Male Disability
Male Disability Comparison
Danes
Trinidadians and Tobagonians
11.9%
MALE DISABILITY
0.9/ 100
METRIC RATING
246th/ 347
METRIC RANK
11.0%
MALE DISABILITY
83.3/ 100
METRIC RATING
135th/ 347
METRIC RANK
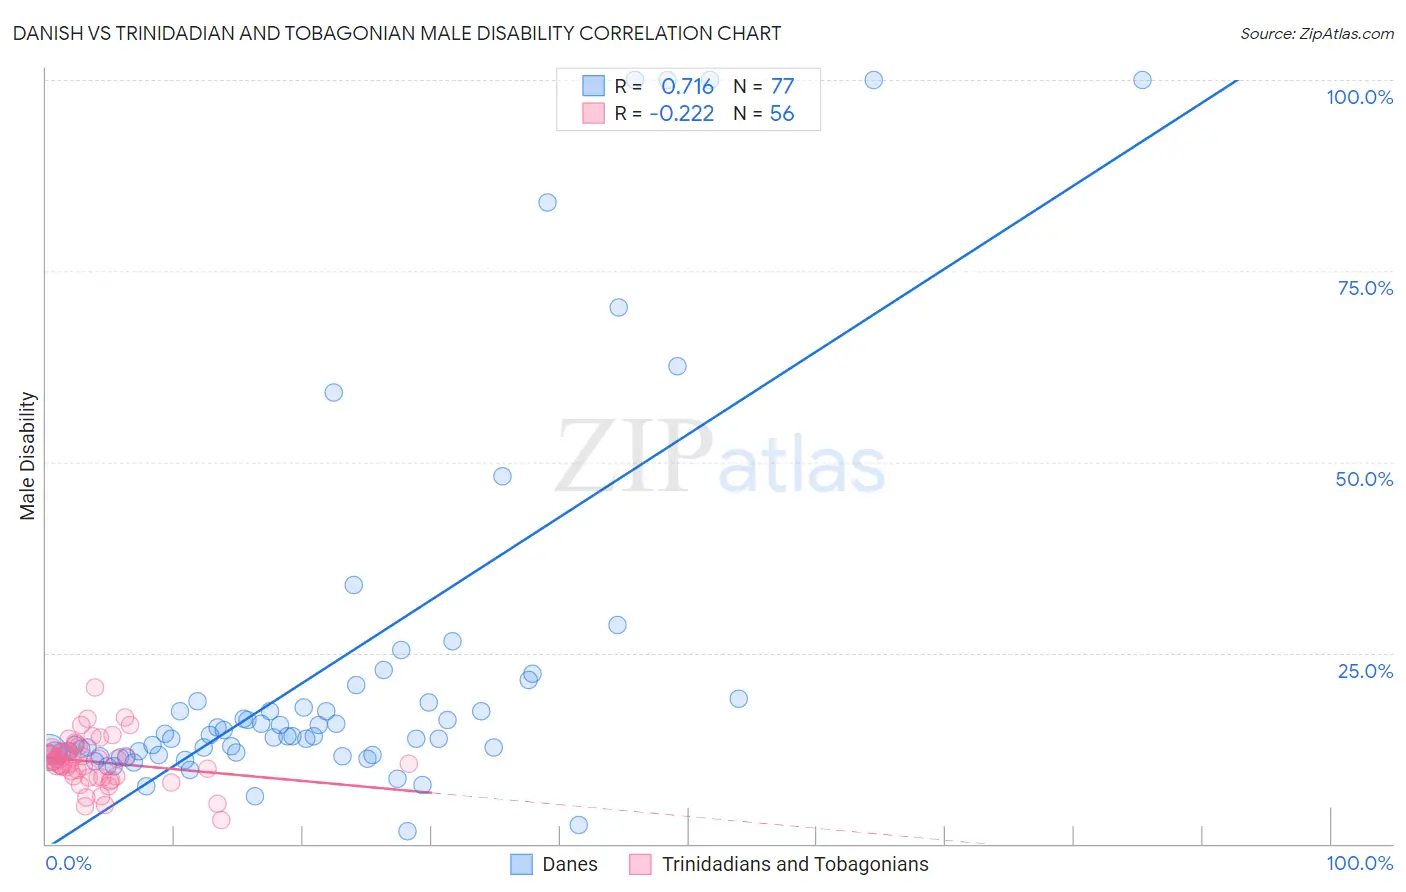
Danish vs Trinidadian and Tobagonian Male Disability Correlation Chart
The statistical analysis conducted on geographies consisting of 474,081,155 people shows a strong positive correlation between the proportion of Danes and percentage of males with a disability in the United States with a correlation coefficient (R) of 0.716 and weighted average of 11.9%. Similarly, the statistical analysis conducted on geographies consisting of 219,818,350 people shows a weak negative correlation between the proportion of Trinidadians and Tobagonians and percentage of males with a disability in the United States with a correlation coefficient (R) of -0.222 and weighted average of 11.0%, a difference of 8.8%.
Male Disability Correlation Summary
| Measurement | Danish | Trinidadian and Tobagonian |
| Minimum | 1.6% | 3.1% |
| Maximum | 100.0% | 20.5% |
| Range | 98.4% | 17.4% |
| Mean | 23.2% | 10.7% |
| Median | 14.1% | 10.8% |
| Interquartile 25% (IQ1) | 11.8% | 8.8% |
| Interquartile 75% (IQ3) | 18.8% | 12.1% |
| Interquartile Range (IQR) | 7.1% | 3.3% |
| Standard Deviation (Sample) | 24.6% | 3.1% |
| Standard Deviation (Population) | 24.4% | 3.1% |
Similar Demographics by Male Disability
Demographics Similar to Danes by Male Disability
In terms of male disability, the demographic groups most similar to Danes are Immigrants from Liberia (11.9%, a difference of 0.030%), Immigrants from Laos (11.9%, a difference of 0.040%), Samoan (11.9%, a difference of 0.15%), Northern European (11.9%, a difference of 0.18%), and Bahamian (11.9%, a difference of 0.19%).
| Demographics | Rating | Rank | Male Disability |
| Italians | 1.2 /100 | #239 | Tragic 11.9% |
| Czechs | 1.1 /100 | #240 | Tragic 11.9% |
| Bahamians | 1.1 /100 | #241 | Tragic 11.9% |
| Northern Europeans | 1.1 /100 | #242 | Tragic 11.9% |
| Samoans | 1.1 /100 | #243 | Tragic 11.9% |
| Immigrants | Laos | 1.0 /100 | #244 | Tragic 11.9% |
| Immigrants | Liberia | 1.0 /100 | #245 | Tragic 11.9% |
| Danes | 0.9 /100 | #246 | Tragic 11.9% |
| Hungarians | 0.8 /100 | #247 | Tragic 12.0% |
| Poles | 0.7 /100 | #248 | Tragic 12.0% |
| Immigrants | Yemen | 0.5 /100 | #249 | Tragic 12.0% |
| Bangladeshis | 0.5 /100 | #250 | Tragic 12.0% |
| German Russians | 0.5 /100 | #251 | Tragic 12.0% |
| Slovenes | 0.5 /100 | #252 | Tragic 12.0% |
| Guamanians/Chamorros | 0.5 /100 | #253 | Tragic 12.0% |
Demographics Similar to Trinidadians and Tobagonians by Male Disability
In terms of male disability, the demographic groups most similar to Trinidadians and Tobagonians are Bhutanese (11.0%, a difference of 0.010%), Immigrants from Costa Rica (11.0%, a difference of 0.040%), Ugandan (11.0%, a difference of 0.070%), Immigrants from Fiji (11.0%, a difference of 0.080%), and Macedonian (11.0%, a difference of 0.10%).
| Demographics | Rating | Rank | Male Disability |
| Immigrants | Latvia | 85.5 /100 | #128 | Excellent 10.9% |
| Immigrants | Philippines | 85.4 /100 | #129 | Excellent 10.9% |
| Brazilians | 85.4 /100 | #130 | Excellent 10.9% |
| Macedonians | 84.2 /100 | #131 | Excellent 11.0% |
| Immigrants | Fiji | 84.0 /100 | #132 | Excellent 11.0% |
| Ugandans | 83.9 /100 | #133 | Excellent 11.0% |
| Bhutanese | 83.4 /100 | #134 | Excellent 11.0% |
| Trinidadians and Tobagonians | 83.3 /100 | #135 | Excellent 11.0% |
| Immigrants | Costa Rica | 82.8 /100 | #136 | Excellent 11.0% |
| Immigrants | Europe | 82.0 /100 | #137 | Excellent 11.0% |
| Nigerians | 81.9 /100 | #138 | Excellent 11.0% |
| South Africans | 81.7 /100 | #139 | Excellent 11.0% |
| Immigrants | Italy | 81.5 /100 | #140 | Excellent 11.0% |
| Arabs | 81.5 /100 | #141 | Excellent 11.0% |
| Immigrants | Sudan | 81.5 /100 | #142 | Excellent 11.0% |