Danish vs Immigrants from Belarus Male Disability
COMPARE
Danish
Immigrants from Belarus
Male Disability
Male Disability Comparison
Danes
Immigrants from Belarus
11.9%
MALE DISABILITY
0.9/ 100
METRIC RATING
246th/ 347
METRIC RANK
10.4%
MALE DISABILITY
99.3/ 100
METRIC RATING
63rd/ 347
METRIC RANK
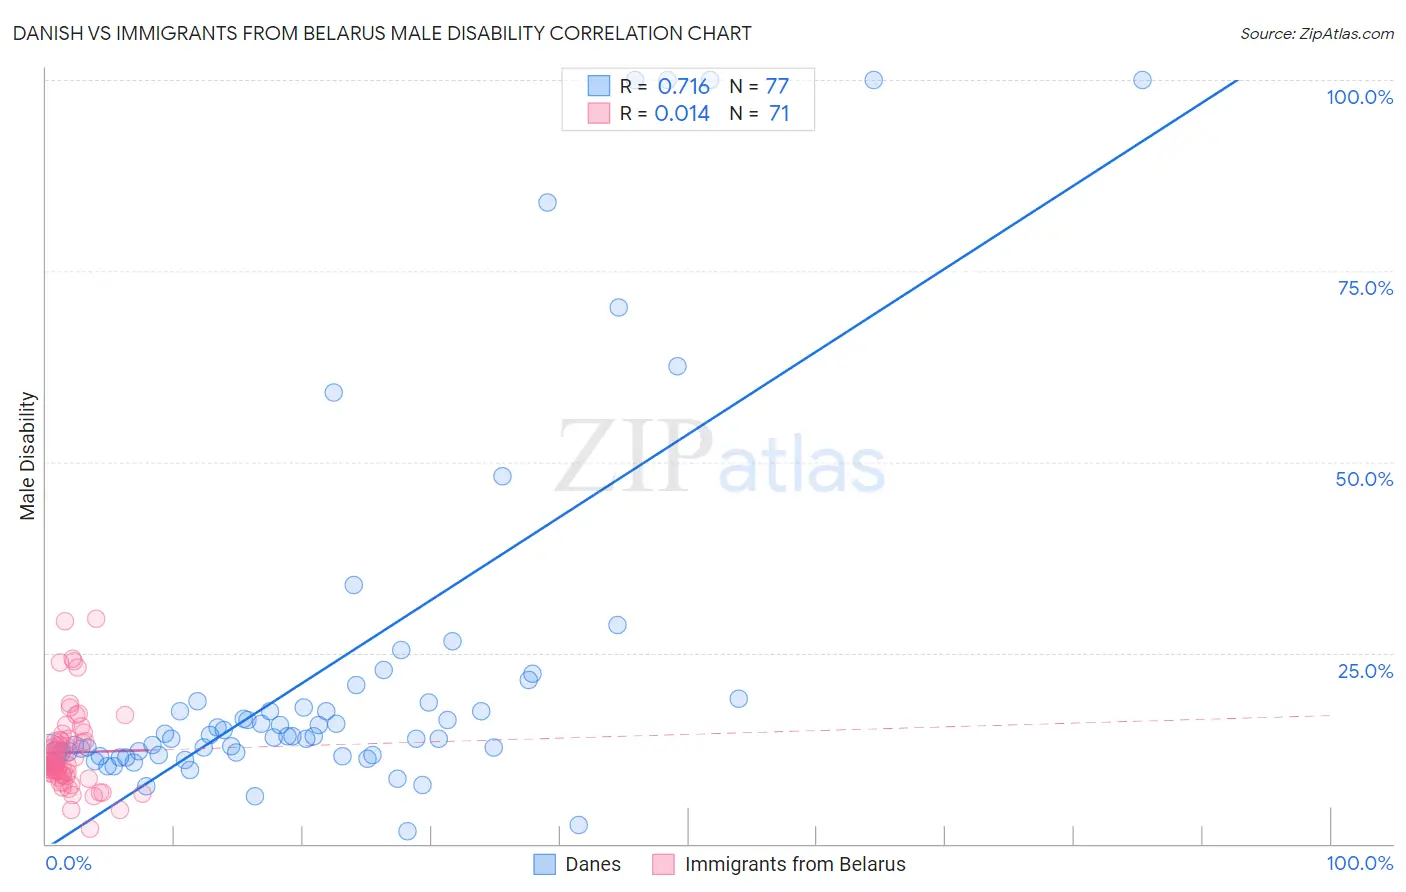
Danish vs Immigrants from Belarus Male Disability Correlation Chart
The statistical analysis conducted on geographies consisting of 474,081,155 people shows a strong positive correlation between the proportion of Danes and percentage of males with a disability in the United States with a correlation coefficient (R) of 0.716 and weighted average of 11.9%. Similarly, the statistical analysis conducted on geographies consisting of 150,193,333 people shows no correlation between the proportion of Immigrants from Belarus and percentage of males with a disability in the United States with a correlation coefficient (R) of 0.014 and weighted average of 10.4%, a difference of 14.3%.
Male Disability Correlation Summary
| Measurement | Danish | Immigrants from Belarus |
| Minimum | 1.6% | 2.0% |
| Maximum | 100.0% | 29.5% |
| Range | 98.4% | 27.4% |
| Mean | 23.2% | 11.9% |
| Median | 14.1% | 10.5% |
| Interquartile 25% (IQ1) | 11.8% | 9.0% |
| Interquartile 75% (IQ3) | 18.8% | 13.5% |
| Interquartile Range (IQR) | 7.1% | 4.4% |
| Standard Deviation (Sample) | 24.6% | 5.3% |
| Standard Deviation (Population) | 24.4% | 5.2% |
Similar Demographics by Male Disability
Demographics Similar to Danes by Male Disability
In terms of male disability, the demographic groups most similar to Danes are Immigrants from Liberia (11.9%, a difference of 0.030%), Immigrants from Laos (11.9%, a difference of 0.040%), Samoan (11.9%, a difference of 0.15%), Northern European (11.9%, a difference of 0.18%), and Bahamian (11.9%, a difference of 0.19%).
| Demographics | Rating | Rank | Male Disability |
| Italians | 1.2 /100 | #239 | Tragic 11.9% |
| Czechs | 1.1 /100 | #240 | Tragic 11.9% |
| Bahamians | 1.1 /100 | #241 | Tragic 11.9% |
| Northern Europeans | 1.1 /100 | #242 | Tragic 11.9% |
| Samoans | 1.1 /100 | #243 | Tragic 11.9% |
| Immigrants | Laos | 1.0 /100 | #244 | Tragic 11.9% |
| Immigrants | Liberia | 1.0 /100 | #245 | Tragic 11.9% |
| Danes | 0.9 /100 | #246 | Tragic 11.9% |
| Hungarians | 0.8 /100 | #247 | Tragic 12.0% |
| Poles | 0.7 /100 | #248 | Tragic 12.0% |
| Immigrants | Yemen | 0.5 /100 | #249 | Tragic 12.0% |
| Bangladeshis | 0.5 /100 | #250 | Tragic 12.0% |
| German Russians | 0.5 /100 | #251 | Tragic 12.0% |
| Slovenes | 0.5 /100 | #252 | Tragic 12.0% |
| Guamanians/Chamorros | 0.5 /100 | #253 | Tragic 12.0% |
Demographics Similar to Immigrants from Belarus by Male Disability
In terms of male disability, the demographic groups most similar to Immigrants from Belarus are Immigrants from Ecuador (10.4%, a difference of 0.020%), Jordanian (10.5%, a difference of 0.12%), Immigrants from Grenada (10.5%, a difference of 0.15%), Guyanese (10.5%, a difference of 0.15%), and Immigrants from Afghanistan (10.5%, a difference of 0.16%).
| Demographics | Rating | Rank | Male Disability |
| Tongans | 99.6 /100 | #56 | Exceptional 10.4% |
| Immigrants | South America | 99.6 /100 | #57 | Exceptional 10.4% |
| Immigrants | Japan | 99.5 /100 | #58 | Exceptional 10.4% |
| Immigrants | Australia | 99.5 /100 | #59 | Exceptional 10.4% |
| Immigrants | Colombia | 99.5 /100 | #60 | Exceptional 10.4% |
| Immigrants | Northern Africa | 99.4 /100 | #61 | Exceptional 10.4% |
| Immigrants | Ecuador | 99.3 /100 | #62 | Exceptional 10.4% |
| Immigrants | Belarus | 99.3 /100 | #63 | Exceptional 10.4% |
| Jordanians | 99.3 /100 | #64 | Exceptional 10.5% |
| Immigrants | Grenada | 99.2 /100 | #65 | Exceptional 10.5% |
| Guyanese | 99.2 /100 | #66 | Exceptional 10.5% |
| Immigrants | Afghanistan | 99.2 /100 | #67 | Exceptional 10.5% |
| Colombians | 99.2 /100 | #68 | Exceptional 10.5% |
| Ecuadorians | 99.2 /100 | #69 | Exceptional 10.5% |
| Immigrants | Bulgaria | 99.1 /100 | #70 | Exceptional 10.5% |