Danish vs Immigrants from Congo Male Disability
COMPARE
Danish
Immigrants from Congo
Male Disability
Male Disability Comparison
Danes
Immigrants from Congo
11.9%
MALE DISABILITY
0.9/ 100
METRIC RATING
246th/ 347
METRIC RANK
11.7%
MALE DISABILITY
3.7/ 100
METRIC RATING
221st/ 347
METRIC RANK
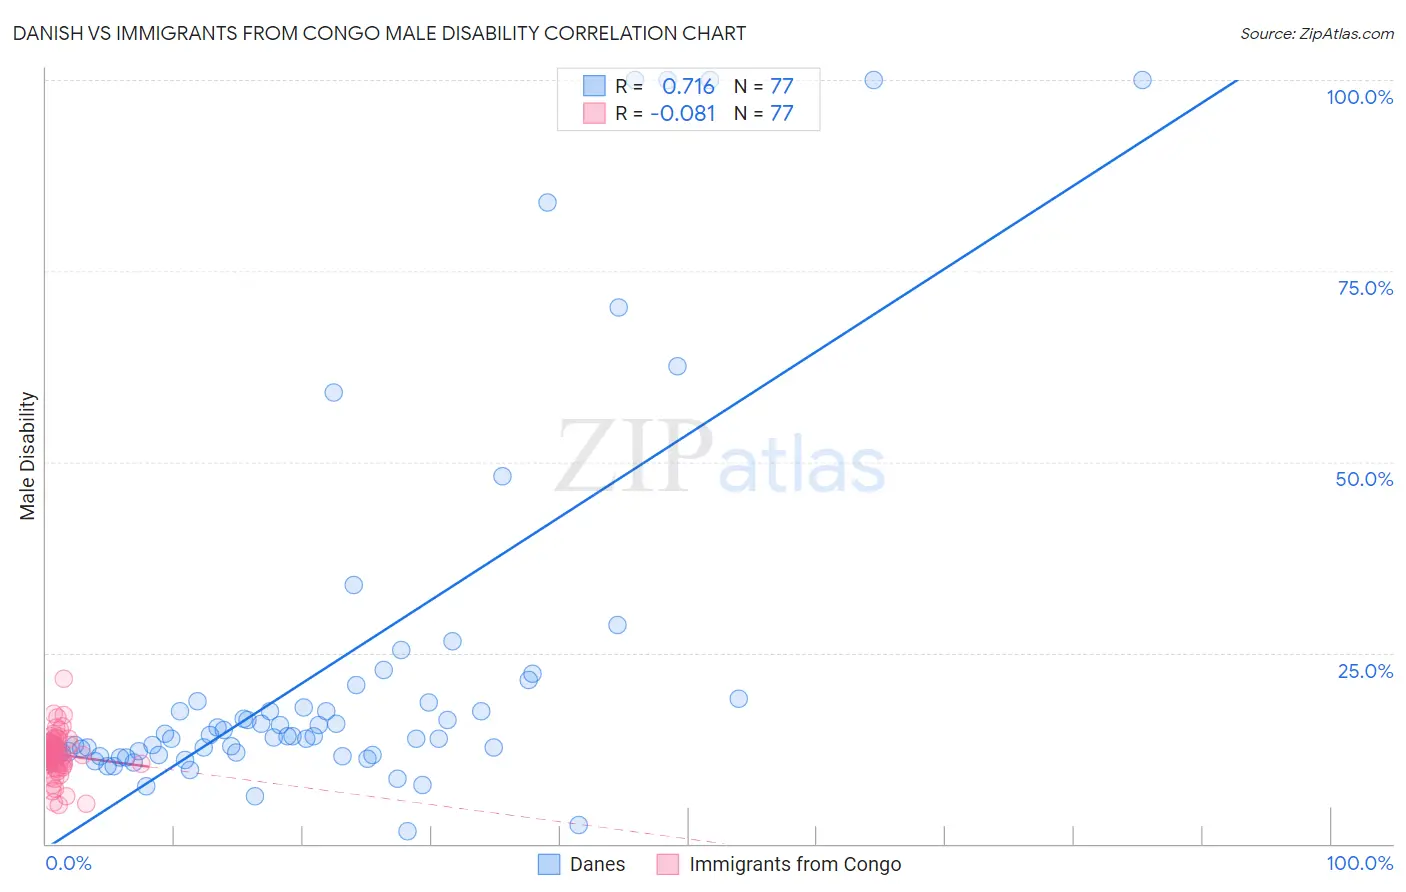
Danish vs Immigrants from Congo Male Disability Correlation Chart
The statistical analysis conducted on geographies consisting of 474,081,155 people shows a strong positive correlation between the proportion of Danes and percentage of males with a disability in the United States with a correlation coefficient (R) of 0.716 and weighted average of 11.9%. Similarly, the statistical analysis conducted on geographies consisting of 92,121,223 people shows a slight negative correlation between the proportion of Immigrants from Congo and percentage of males with a disability in the United States with a correlation coefficient (R) of -0.081 and weighted average of 11.7%, a difference of 1.9%.
Male Disability Correlation Summary
| Measurement | Danish | Immigrants from Congo |
| Minimum | 1.6% | 5.1% |
| Maximum | 100.0% | 21.7% |
| Range | 98.4% | 16.5% |
| Mean | 23.2% | 11.7% |
| Median | 14.1% | 11.8% |
| Interquartile 25% (IQ1) | 11.8% | 10.6% |
| Interquartile 75% (IQ3) | 18.8% | 12.9% |
| Interquartile Range (IQR) | 7.1% | 2.4% |
| Standard Deviation (Sample) | 24.6% | 2.7% |
| Standard Deviation (Population) | 24.4% | 2.6% |
Similar Demographics by Male Disability
Demographics Similar to Danes by Male Disability
In terms of male disability, the demographic groups most similar to Danes are Immigrants from Liberia (11.9%, a difference of 0.030%), Immigrants from Laos (11.9%, a difference of 0.040%), Samoan (11.9%, a difference of 0.15%), Northern European (11.9%, a difference of 0.18%), and Bahamian (11.9%, a difference of 0.19%).
| Demographics | Rating | Rank | Male Disability |
| Italians | 1.2 /100 | #239 | Tragic 11.9% |
| Czechs | 1.1 /100 | #240 | Tragic 11.9% |
| Bahamians | 1.1 /100 | #241 | Tragic 11.9% |
| Northern Europeans | 1.1 /100 | #242 | Tragic 11.9% |
| Samoans | 1.1 /100 | #243 | Tragic 11.9% |
| Immigrants | Laos | 1.0 /100 | #244 | Tragic 11.9% |
| Immigrants | Liberia | 1.0 /100 | #245 | Tragic 11.9% |
| Danes | 0.9 /100 | #246 | Tragic 11.9% |
| Hungarians | 0.8 /100 | #247 | Tragic 12.0% |
| Poles | 0.7 /100 | #248 | Tragic 12.0% |
| Immigrants | Yemen | 0.5 /100 | #249 | Tragic 12.0% |
| Bangladeshis | 0.5 /100 | #250 | Tragic 12.0% |
| German Russians | 0.5 /100 | #251 | Tragic 12.0% |
| Slovenes | 0.5 /100 | #252 | Tragic 12.0% |
| Guamanians/Chamorros | 0.5 /100 | #253 | Tragic 12.0% |
Demographics Similar to Immigrants from Congo by Male Disability
In terms of male disability, the demographic groups most similar to Immigrants from Congo are Immigrants from Western Europe (11.7%, a difference of 0.010%), Panamanian (11.7%, a difference of 0.020%), Immigrants from England (11.7%, a difference of 0.080%), Alsatian (11.7%, a difference of 0.15%), and Immigrants from Bahamas (11.7%, a difference of 0.24%).
| Demographics | Rating | Rank | Male Disability |
| Lithuanians | 6.6 /100 | #214 | Tragic 11.6% |
| Indonesians | 5.9 /100 | #215 | Tragic 11.6% |
| Immigrants | Dominican Republic | 4.9 /100 | #216 | Tragic 11.7% |
| Immigrants | Dominica | 4.6 /100 | #217 | Tragic 11.7% |
| Immigrants | England | 4.0 /100 | #218 | Tragic 11.7% |
| Panamanians | 3.8 /100 | #219 | Tragic 11.7% |
| Immigrants | Western Europe | 3.8 /100 | #220 | Tragic 11.7% |
| Immigrants | Congo | 3.7 /100 | #221 | Tragic 11.7% |
| Alsatians | 3.3 /100 | #222 | Tragic 11.7% |
| Immigrants | Bahamas | 3.2 /100 | #223 | Tragic 11.7% |
| Japanese | 3.1 /100 | #224 | Tragic 11.7% |
| Liberians | 3.1 /100 | #225 | Tragic 11.8% |
| Sub-Saharan Africans | 2.8 /100 | #226 | Tragic 11.8% |
| Austrians | 2.5 /100 | #227 | Tragic 11.8% |
| Hispanics or Latinos | 2.3 /100 | #228 | Tragic 11.8% |