Danish vs Senegalese Male Disability
COMPARE
Danish
Senegalese
Male Disability
Male Disability Comparison
Danes
Senegalese
11.9%
MALE DISABILITY
0.9/ 100
METRIC RATING
246th/ 347
METRIC RANK
11.4%
MALE DISABILITY
23.2/ 100
METRIC RATING
191st/ 347
METRIC RANK
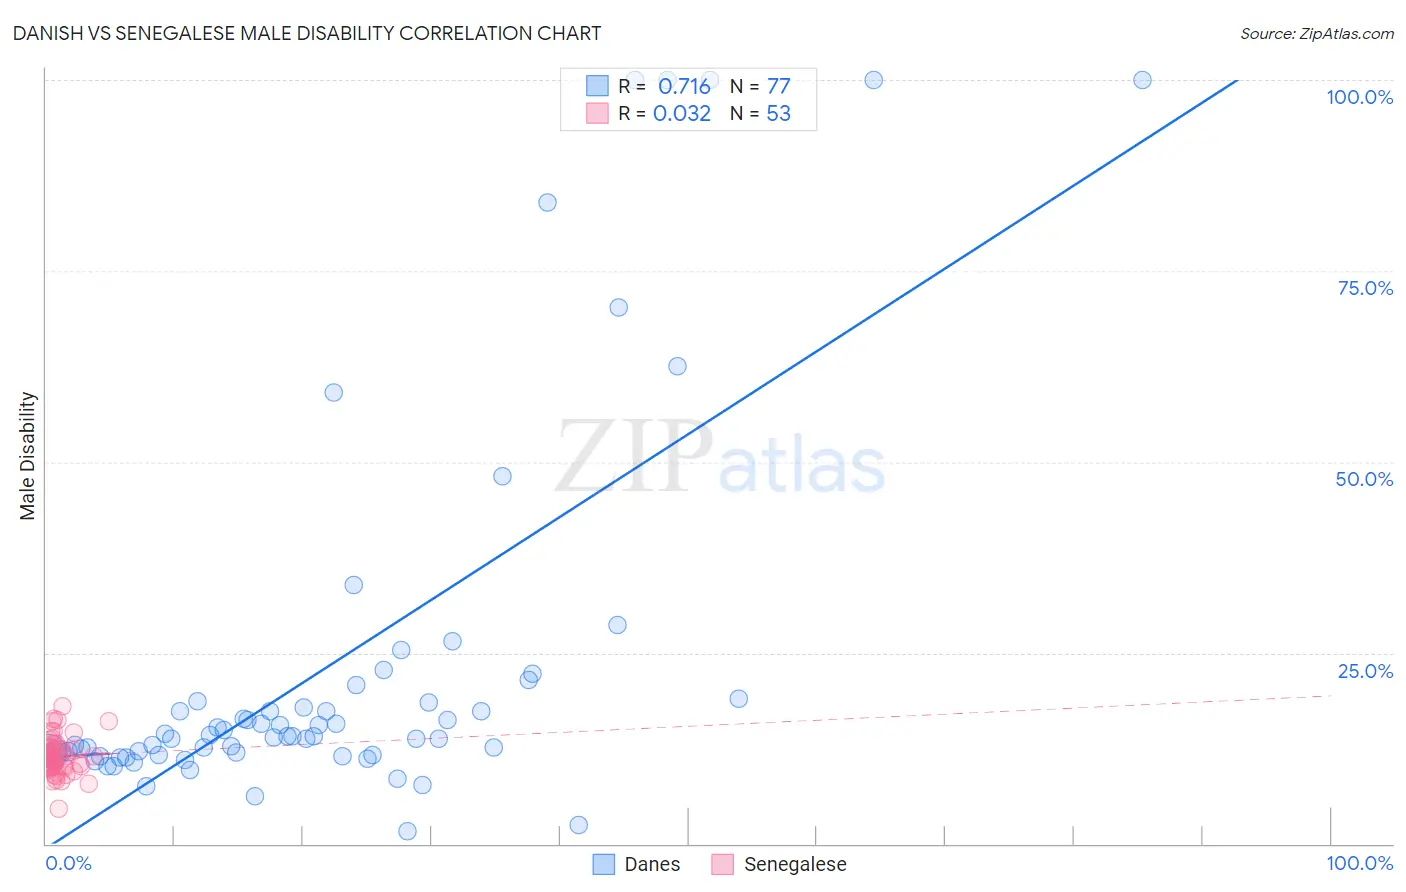
Danish vs Senegalese Male Disability Correlation Chart
The statistical analysis conducted on geographies consisting of 474,081,155 people shows a strong positive correlation between the proportion of Danes and percentage of males with a disability in the United States with a correlation coefficient (R) of 0.716 and weighted average of 11.9%. Similarly, the statistical analysis conducted on geographies consisting of 78,137,196 people shows no correlation between the proportion of Senegalese and percentage of males with a disability in the United States with a correlation coefficient (R) of 0.032 and weighted average of 11.4%, a difference of 4.7%.
Male Disability Correlation Summary
| Measurement | Danish | Senegalese |
| Minimum | 1.6% | 4.6% |
| Maximum | 100.0% | 18.0% |
| Range | 98.4% | 13.4% |
| Mean | 23.2% | 11.5% |
| Median | 14.1% | 11.2% |
| Interquartile 25% (IQ1) | 11.8% | 10.0% |
| Interquartile 75% (IQ3) | 18.8% | 12.5% |
| Interquartile Range (IQR) | 7.1% | 2.5% |
| Standard Deviation (Sample) | 24.6% | 2.5% |
| Standard Deviation (Population) | 24.4% | 2.5% |
Similar Demographics by Male Disability
Demographics Similar to Danes by Male Disability
In terms of male disability, the demographic groups most similar to Danes are Immigrants from Liberia (11.9%, a difference of 0.030%), Immigrants from Laos (11.9%, a difference of 0.040%), Samoan (11.9%, a difference of 0.15%), Northern European (11.9%, a difference of 0.18%), and Bahamian (11.9%, a difference of 0.19%).
| Demographics | Rating | Rank | Male Disability |
| Italians | 1.2 /100 | #239 | Tragic 11.9% |
| Czechs | 1.1 /100 | #240 | Tragic 11.9% |
| Bahamians | 1.1 /100 | #241 | Tragic 11.9% |
| Northern Europeans | 1.1 /100 | #242 | Tragic 11.9% |
| Samoans | 1.1 /100 | #243 | Tragic 11.9% |
| Immigrants | Laos | 1.0 /100 | #244 | Tragic 11.9% |
| Immigrants | Liberia | 1.0 /100 | #245 | Tragic 11.9% |
| Danes | 0.9 /100 | #246 | Tragic 11.9% |
| Hungarians | 0.8 /100 | #247 | Tragic 12.0% |
| Poles | 0.7 /100 | #248 | Tragic 12.0% |
| Immigrants | Yemen | 0.5 /100 | #249 | Tragic 12.0% |
| Bangladeshis | 0.5 /100 | #250 | Tragic 12.0% |
| German Russians | 0.5 /100 | #251 | Tragic 12.0% |
| Slovenes | 0.5 /100 | #252 | Tragic 12.0% |
| Guamanians/Chamorros | 0.5 /100 | #253 | Tragic 12.0% |
Demographics Similar to Senegalese by Male Disability
In terms of male disability, the demographic groups most similar to Senegalese are Assyrian/Chaldean/Syriac (11.4%, a difference of 0.0%), Greek (11.4%, a difference of 0.080%), Immigrants from Bosnia and Herzegovina (11.4%, a difference of 0.16%), Belizean (11.4%, a difference of 0.16%), and Immigrants from Oceania (11.4%, a difference of 0.19%).
| Demographics | Rating | Rank | Male Disability |
| Iraqis | 30.5 /100 | #184 | Fair 11.3% |
| Pakistanis | 30.3 /100 | #185 | Fair 11.3% |
| Immigrants | Zaire | 27.6 /100 | #186 | Fair 11.4% |
| Immigrants | Austria | 27.3 /100 | #187 | Fair 11.4% |
| Estonians | 26.8 /100 | #188 | Fair 11.4% |
| Immigrants | Netherlands | 25.9 /100 | #189 | Fair 11.4% |
| Immigrants | Bosnia and Herzegovina | 25.4 /100 | #190 | Fair 11.4% |
| Senegalese | 23.2 /100 | #191 | Fair 11.4% |
| Assyrians/Chaldeans/Syriacs | 23.2 /100 | #192 | Fair 11.4% |
| Greeks | 22.2 /100 | #193 | Fair 11.4% |
| Belizeans | 21.2 /100 | #194 | Fair 11.4% |
| Immigrants | Oceania | 20.9 /100 | #195 | Fair 11.4% |
| West Indians | 18.4 /100 | #196 | Poor 11.4% |
| Somalis | 18.2 /100 | #197 | Poor 11.4% |
| Immigrants | Jamaica | 16.3 /100 | #198 | Poor 11.5% |