Danish vs Alaskan Athabascan Male Disability
COMPARE
Danish
Alaskan Athabascan
Male Disability
Male Disability Comparison
Danes
Alaskan Athabascans
11.9%
MALE DISABILITY
0.9/ 100
METRIC RATING
246th/ 347
METRIC RANK
14.9%
MALE DISABILITY
0.0/ 100
METRIC RATING
336th/ 347
METRIC RANK
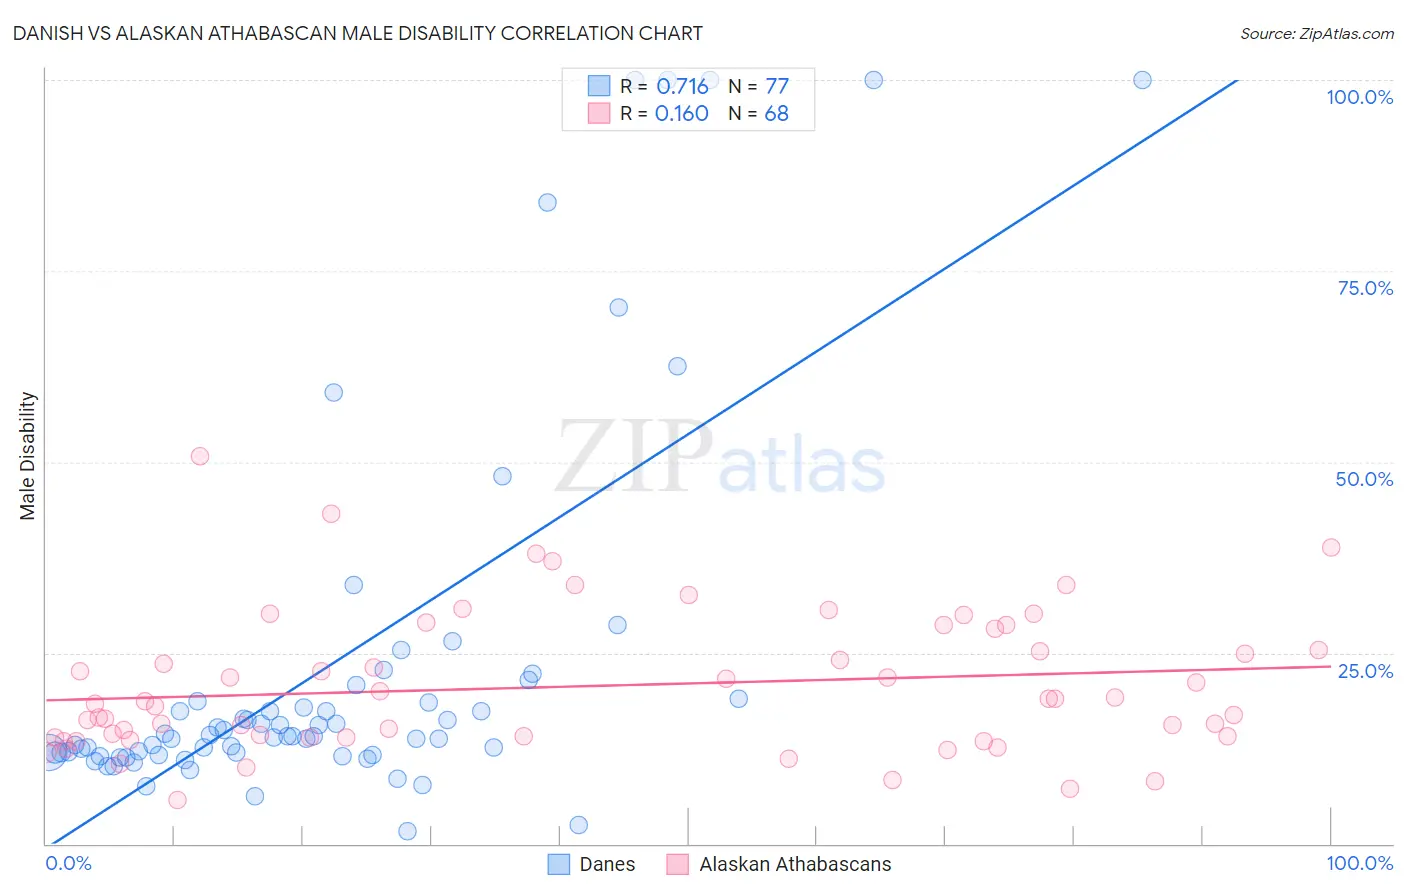
Danish vs Alaskan Athabascan Male Disability Correlation Chart
The statistical analysis conducted on geographies consisting of 474,081,155 people shows a strong positive correlation between the proportion of Danes and percentage of males with a disability in the United States with a correlation coefficient (R) of 0.716 and weighted average of 11.9%. Similarly, the statistical analysis conducted on geographies consisting of 45,820,726 people shows a poor positive correlation between the proportion of Alaskan Athabascans and percentage of males with a disability in the United States with a correlation coefficient (R) of 0.160 and weighted average of 14.9%, a difference of 24.9%.
Male Disability Correlation Summary
| Measurement | Danish | Alaskan Athabascan |
| Minimum | 1.6% | 5.8% |
| Maximum | 100.0% | 50.7% |
| Range | 98.4% | 44.9% |
| Mean | 23.2% | 20.7% |
| Median | 14.1% | 18.5% |
| Interquartile 25% (IQ1) | 11.8% | 13.9% |
| Interquartile 75% (IQ3) | 18.8% | 26.7% |
| Interquartile Range (IQR) | 7.1% | 12.8% |
| Standard Deviation (Sample) | 24.6% | 9.2% |
| Standard Deviation (Population) | 24.4% | 9.1% |
Similar Demographics by Male Disability
Demographics Similar to Danes by Male Disability
In terms of male disability, the demographic groups most similar to Danes are Immigrants from Liberia (11.9%, a difference of 0.030%), Immigrants from Laos (11.9%, a difference of 0.040%), Samoan (11.9%, a difference of 0.15%), Northern European (11.9%, a difference of 0.18%), and Bahamian (11.9%, a difference of 0.19%).
| Demographics | Rating | Rank | Male Disability |
| Italians | 1.2 /100 | #239 | Tragic 11.9% |
| Czechs | 1.1 /100 | #240 | Tragic 11.9% |
| Bahamians | 1.1 /100 | #241 | Tragic 11.9% |
| Northern Europeans | 1.1 /100 | #242 | Tragic 11.9% |
| Samoans | 1.1 /100 | #243 | Tragic 11.9% |
| Immigrants | Laos | 1.0 /100 | #244 | Tragic 11.9% |
| Immigrants | Liberia | 1.0 /100 | #245 | Tragic 11.9% |
| Danes | 0.9 /100 | #246 | Tragic 11.9% |
| Hungarians | 0.8 /100 | #247 | Tragic 12.0% |
| Poles | 0.7 /100 | #248 | Tragic 12.0% |
| Immigrants | Yemen | 0.5 /100 | #249 | Tragic 12.0% |
| Bangladeshis | 0.5 /100 | #250 | Tragic 12.0% |
| German Russians | 0.5 /100 | #251 | Tragic 12.0% |
| Slovenes | 0.5 /100 | #252 | Tragic 12.0% |
| Guamanians/Chamorros | 0.5 /100 | #253 | Tragic 12.0% |
Demographics Similar to Alaskan Athabascans by Male Disability
In terms of male disability, the demographic groups most similar to Alaskan Athabascans are Dutch West Indian (14.8%, a difference of 0.46%), Cherokee (14.8%, a difference of 0.49%), Menominee (15.0%, a difference of 0.51%), Pueblo (15.0%, a difference of 0.62%), and Yuman (14.7%, a difference of 1.2%).
| Demographics | Rating | Rank | Male Disability |
| Cajuns | 0.0 /100 | #329 | Tragic 14.4% |
| Navajo | 0.0 /100 | #330 | Tragic 14.4% |
| Tohono O'odham | 0.0 /100 | #331 | Tragic 14.6% |
| Seminole | 0.0 /100 | #332 | Tragic 14.7% |
| Yuman | 0.0 /100 | #333 | Tragic 14.7% |
| Cherokee | 0.0 /100 | #334 | Tragic 14.8% |
| Dutch West Indians | 0.0 /100 | #335 | Tragic 14.8% |
| Alaskan Athabascans | 0.0 /100 | #336 | Tragic 14.9% |
| Menominee | 0.0 /100 | #337 | Tragic 15.0% |
| Pueblo | 0.0 /100 | #338 | Tragic 15.0% |
| Chickasaw | 0.0 /100 | #339 | Tragic 15.1% |
| Lumbee | 0.0 /100 | #340 | Tragic 15.2% |
| Choctaw | 0.0 /100 | #341 | Tragic 15.4% |
| Kiowa | 0.0 /100 | #342 | Tragic 15.4% |
| Creek | 0.0 /100 | #343 | Tragic 15.5% |