Zip Codes with the Highest Percentage of Population Employed in Accommodation & Food Services in Lake Havasu City, AZ
RELATED REPORTS & OPTIONS
Accommodation & Food Services
Lake Havasu City
Compare Zip Codes
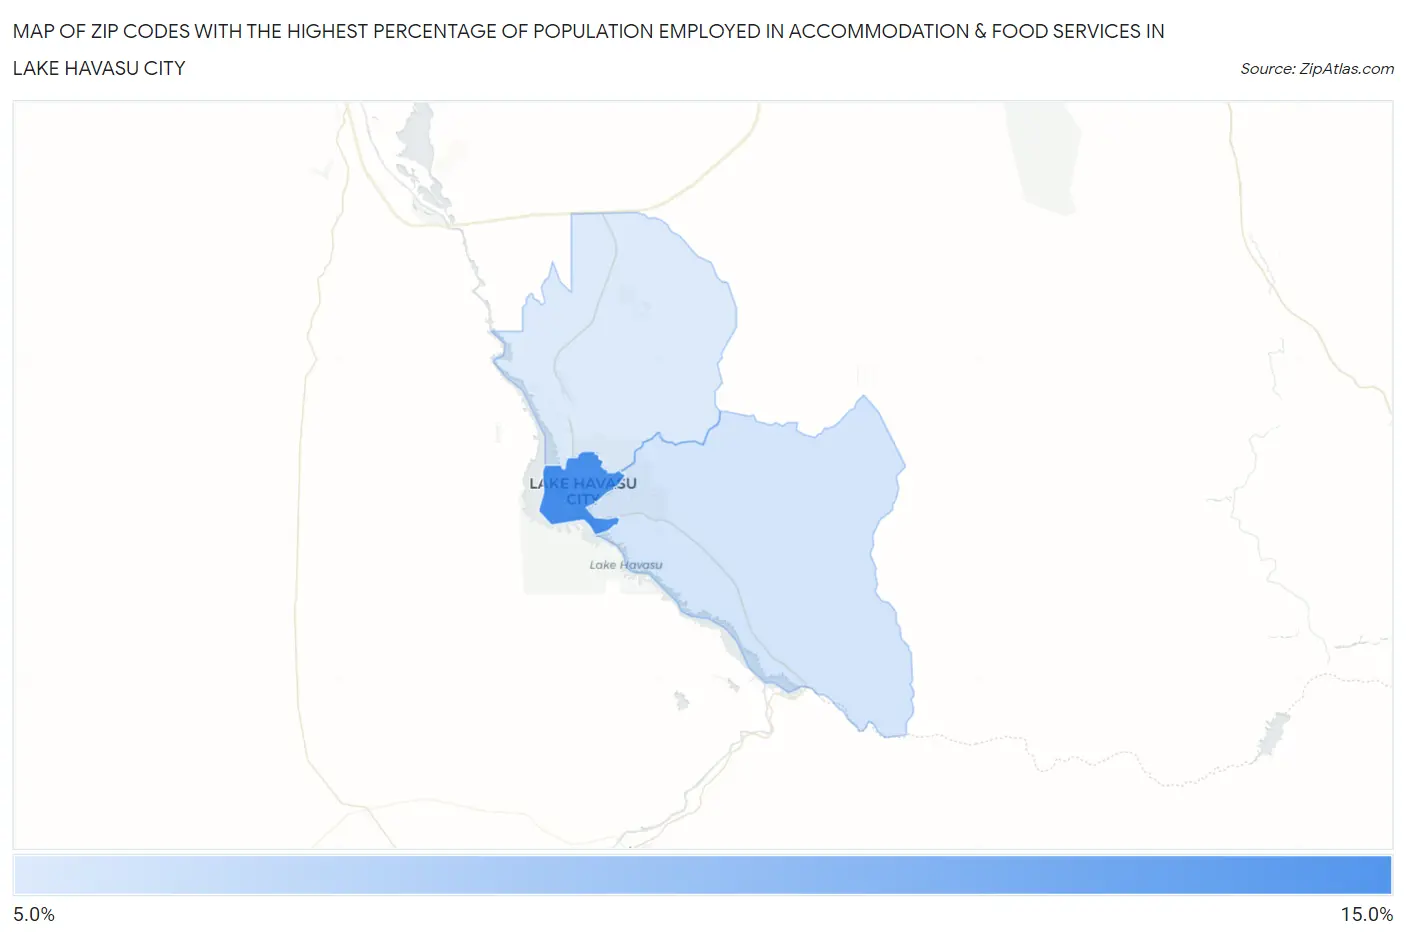
Map of Zip Codes with the Highest Percentage of Population Employed in Accommodation & Food Services in Lake Havasu City
7.6%
13.9%
Zip Codes with the Highest Percentage of Population Employed in Accommodation & Food Services in Lake Havasu City, AZ
| Zip Code | % Employed | vs State | vs National | |
| 1. | 86403 | 13.9% | 7.6%(+6.33)#54 | 6.9%(+7.00)#2,007 |
| 2. | 86406 | 8.0% | 7.6%(+0.402)#160 | 6.9%(+1.08)#7,909 |
| 3. | 86404 | 7.6% | 7.6%(+0.062)#170 | 6.9%(+0.735)#8,707 |
1
Common Questions
What are the Top Zip Codes with the Highest Percentage of Population Employed in Accommodation & Food Services in Lake Havasu City, AZ?
Top Zip Codes with the Highest Percentage of Population Employed in Accommodation & Food Services in Lake Havasu City, AZ are:
What zip code has the Highest Percentage of Population Employed in Accommodation & Food Services in Lake Havasu City, AZ?
86403 has the Highest Percentage of Population Employed in Accommodation & Food Services in Lake Havasu City, AZ with 13.9%.
What is the Percentage of Population Employed in Accommodation & Food Services in Lake Havasu City, AZ?
Percentage of Population Employed in Accommodation & Food Services in Lake Havasu City is 9.7%.
What is the Percentage of Population Employed in Accommodation & Food Services in Arizona?
Percentage of Population Employed in Accommodation & Food Services in Arizona is 7.6%.
What is the Percentage of Population Employed in Accommodation & Food Services in the United States?
Percentage of Population Employed in Accommodation & Food Services in the United States is 6.9%.