Whale Pass, AK Map & Demographics
Whale Pass Map
Whale Pass Overview
$32,737
PER CAPITA INCOME
$117,727
AVG FAMILY INCOME
$49,063
AVG HOUSEHOLD INCOME
15.0%
WAGE / INCOME GAP [ % ]
85.0¢/ $1
WAGE / INCOME GAP [ $ ]
0.30
INEQUALITY / GINI INDEX
98
TOTAL POPULATION
63
MALE POPULATION
35
FEMALE POPULATION
180.00
MALES / 100 FEMALES
55.56
FEMALES / 100 MALES
63.1
MEDIAN AGE
3.6
AVG FAMILY SIZE
2.1
AVG HOUSEHOLD SIZE
51
LABOR FORCE [ PEOPLE ]
59.3%
PERCENT IN LABOR FORCE
5.9%
UNEMPLOYMENT RATE
Income in Whale Pass
Income Overview in Whale Pass
Per Capita Income in Whale Pass is $32,737, while median incomes of families and households are $117,727 and $49,063 respectively.
| Characteristic | Number | Measure |
| Per Capita Income | 98 | $32,737 |
| Median Family Income | 20 | $117,727 |
| Mean Family Income | 20 | $93,225 |
| Median Household Income | 46 | $49,063 |
| Mean Household Income | 46 | $63,576 |
| Income Deficit | 20 | $0 |
| Wage / Income Gap (%) | 98 | 15.03% |
| Wage / Income Gap ($) | 98 | 84.97¢ per $1 |
| Gini / Inequality Index | 98 | 0.30 |
Earnings by Sex in Whale Pass
Average Earnings in Whale Pass are $57,552, $49,531 for men and $58,295 for women, a difference of 15.0%.
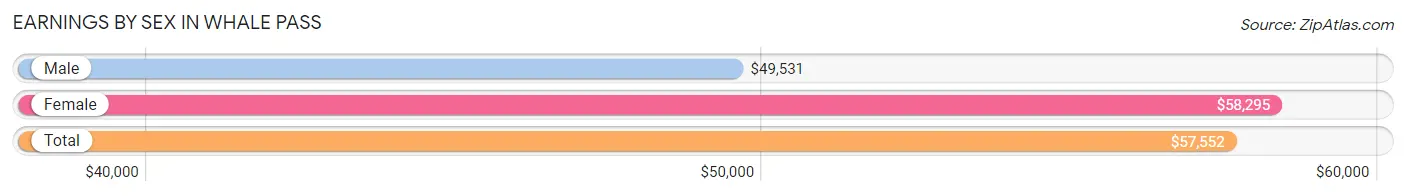
| Sex | Number | Average Earnings |
| Male | 32 (62.7%) | $49,531 |
| Female | 19 (37.2%) | $58,295 |
| Total | 51 (100.0%) | $57,552 |
Earnings by Sex by Income Bracket in Whale Pass
The most common earnings brackets in Whale Pass are $45,000 to $49,999 for men (16 | 50.0%) and $55,000 to $64,999 for women (13 | 68.4%).
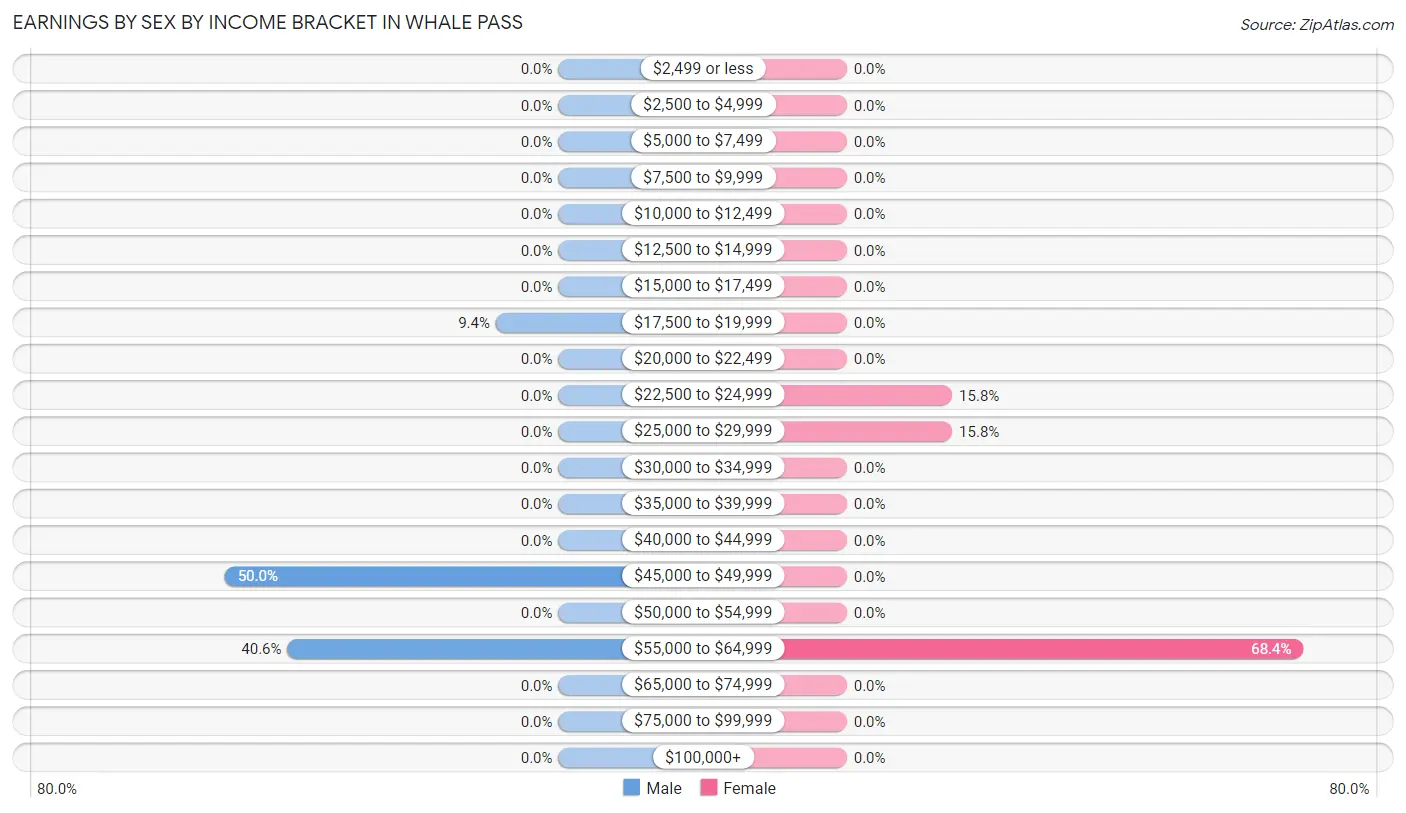
| Income | Male | Female |
| $2,499 or less | 0 (0.0%) | 0 (0.0%) |
| $2,500 to $4,999 | 0 (0.0%) | 0 (0.0%) |
| $5,000 to $7,499 | 0 (0.0%) | 0 (0.0%) |
| $7,500 to $9,999 | 0 (0.0%) | 0 (0.0%) |
| $10,000 to $12,499 | 0 (0.0%) | 0 (0.0%) |
| $12,500 to $14,999 | 0 (0.0%) | 0 (0.0%) |
| $15,000 to $17,499 | 0 (0.0%) | 0 (0.0%) |
| $17,500 to $19,999 | 3 (9.4%) | 0 (0.0%) |
| $20,000 to $22,499 | 0 (0.0%) | 0 (0.0%) |
| $22,500 to $24,999 | 0 (0.0%) | 3 (15.8%) |
| $25,000 to $29,999 | 0 (0.0%) | 3 (15.8%) |
| $30,000 to $34,999 | 0 (0.0%) | 0 (0.0%) |
| $35,000 to $39,999 | 0 (0.0%) | 0 (0.0%) |
| $40,000 to $44,999 | 0 (0.0%) | 0 (0.0%) |
| $45,000 to $49,999 | 16 (50.0%) | 0 (0.0%) |
| $50,000 to $54,999 | 0 (0.0%) | 0 (0.0%) |
| $55,000 to $64,999 | 13 (40.6%) | 13 (68.4%) |
| $65,000 to $74,999 | 0 (0.0%) | 0 (0.0%) |
| $75,000 to $99,999 | 0 (0.0%) | 0 (0.0%) |
| $100,000+ | 0 (0.0%) | 0 (0.0%) |
| Total | 32 (100.0%) | 19 (100.0%) |
Earnings by Sex by Educational Attainment in Whale Pass
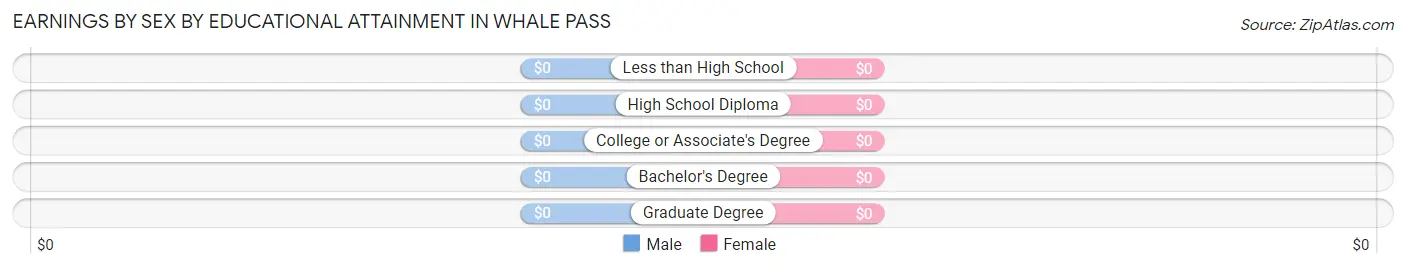
| Educational Attainment | Male Income | Female Income |
| Less than High School | - | - |
| High School Diploma | - | - |
| College or Associate's Degree | - | - |
| Bachelor's Degree | - | - |
| Graduate Degree | - | - |
| Total | $49,531 | $58,295 |
Family Income in Whale Pass
Family Income Brackets in Whale Pass
According to the Whale Pass family income data, there are 11 families falling into the $100,000 to $149,999 income range, which is the most common income bracket and makes up 55.0% of all families.
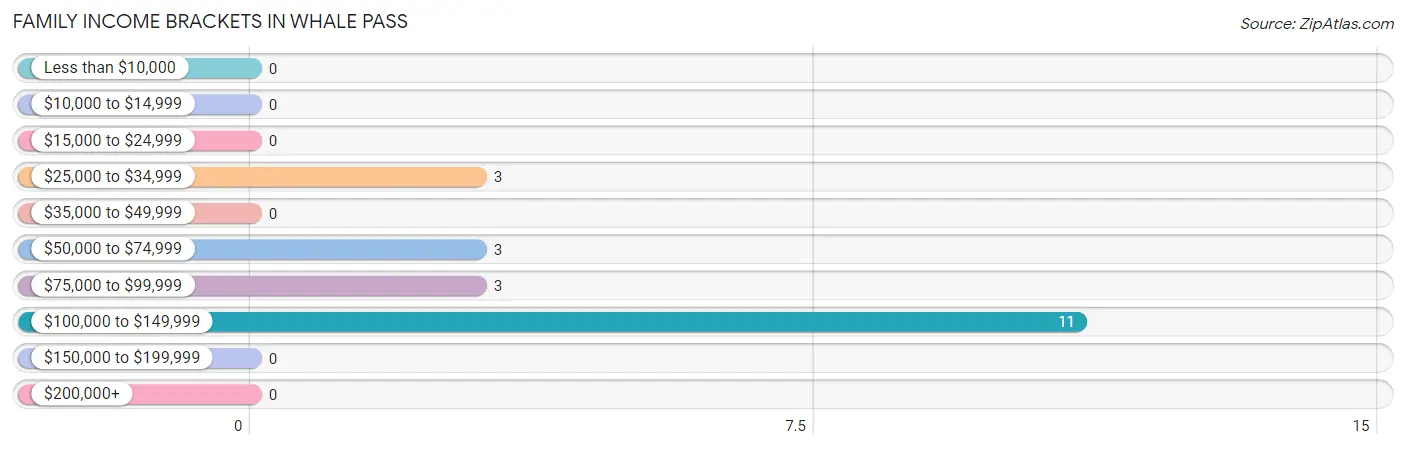
| Income Bracket | # Families | % Families |
| Less than $10,000 | 0 | 0.0% |
| $10,000 to $14,999 | 0 | 0.0% |
| $15,000 to $24,999 | 0 | 0.0% |
| $25,000 to $34,999 | 3 | 15.0% |
| $35,000 to $49,999 | 0 | 0.0% |
| $50,000 to $74,999 | 3 | 15.0% |
| $75,000 to $99,999 | 3 | 15.0% |
| $100,000 to $149,999 | 11 | 55.0% |
| $150,000 to $199,999 | 0 | 0.0% |
| $200,000+ | 0 | 0.0% |
Family Income by Famaliy Size in Whale Pass
| Income Bracket | # Families | Median Income |
| 2-Person Families | 14 (70.0%) | $0 |
| 3-Person Families | 3 (15.0%) | $0 |
| 4-Person Families | 0 (0.0%) | $0 |
| 5-Person Families | 0 (0.0%) | $0 |
| 6-Person Families | 3 (15.0%) | $0 |
| 7+ Person Families | 0 (0.0%) | $0 |
| Total | 20 (100.0%) | $117,727 |
Family Income by Number of Earners in Whale Pass
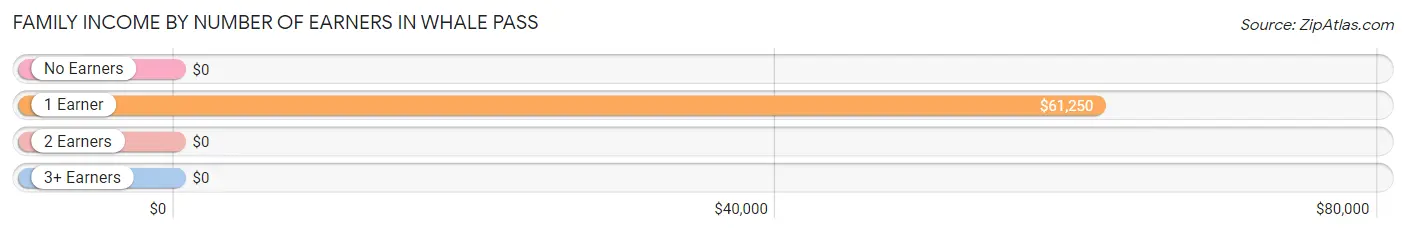
| Number of Earners | # Families | Median Income |
| No Earners | 0 (0.0%) | $0 |
| 1 Earner | 9 (45.0%) | $61,250 |
| 2 Earners | 11 (55.0%) | $0 |
| 3+ Earners | 0 (0.0%) | $0 |
| Total | 20 (100.0%) | $117,727 |
Household Income in Whale Pass
Household Income Brackets in Whale Pass
With 16 households falling in the category, the $35,000 to $49,999 income range is the most frequent in Whale Pass, accounting for 34.8% of all households.
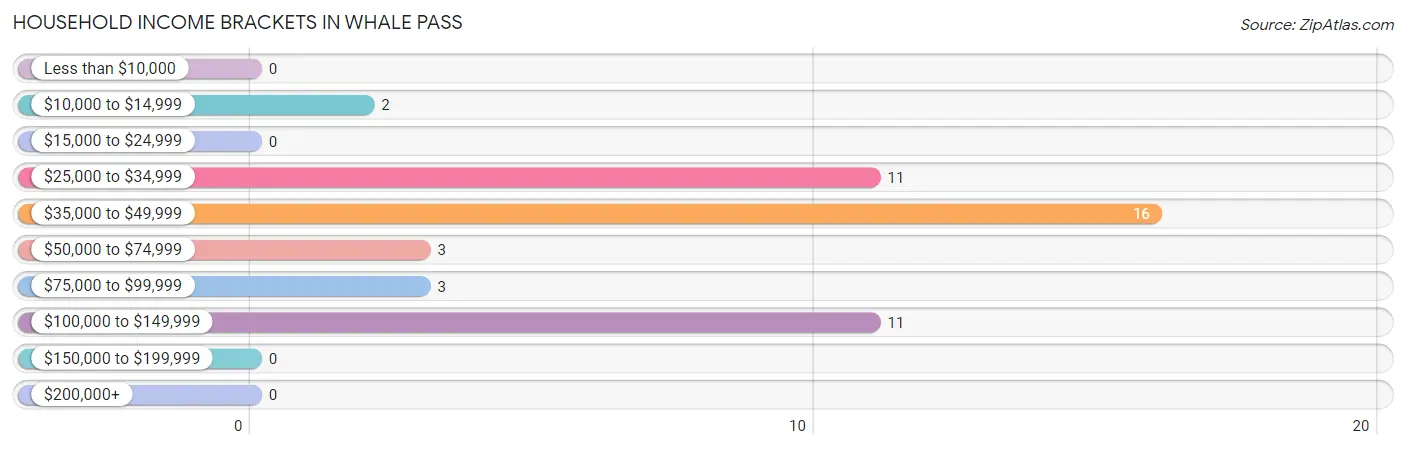
| Income Bracket | # Households | % Households |
| Less than $10,000 | 0 | 0.0% |
| $10,000 to $14,999 | 2 | 4.3% |
| $15,000 to $24,999 | 0 | 0.0% |
| $25,000 to $34,999 | 11 | 23.9% |
| $35,000 to $49,999 | 16 | 34.8% |
| $50,000 to $74,999 | 3 | 6.5% |
| $75,000 to $99,999 | 3 | 6.5% |
| $100,000 to $149,999 | 11 | 23.9% |
| $150,000 to $199,999 | 0 | 0.0% |
| $200,000+ | 0 | 0.0% |
Household Income by Householder Age in Whale Pass
| Income Bracket | # Households | Median Income |
| 15 to 24 Years | 0 (0.0%) | $0 |
| 25 to 44 Years | 3 (6.5%) | $0 |
| 45 to 64 Years | 35 (76.1%) | $0 |
| 65+ Years | 8 (17.4%) | $0 |
| Total | 46 (100.0%) | $49,063 |
Poverty in Whale Pass
Income Below Poverty by Sex and Age in Whale Pass
With 15.9% poverty level for males and 25.7% for females among the residents of Whale Pass, 5 year old males and 6 to 11 year old females are the most vulnerable to poverty, with 2 males (100.0%) and 5 females (100.0%) in their respective age groups living below the poverty level.
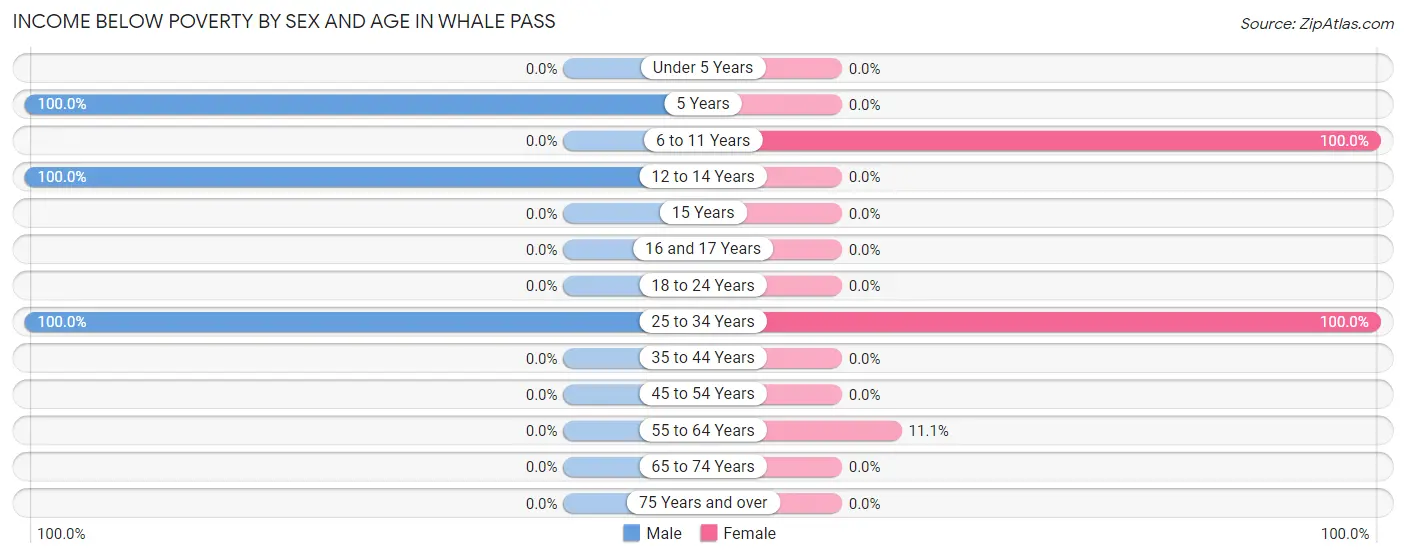
| Age Bracket | Male | Female |
| Under 5 Years | 0 (0.0%) | 0 (0.0%) |
| 5 Years | 2 (100.0%) | 0 (0.0%) |
| 6 to 11 Years | 0 (0.0%) | 5 (100.0%) |
| 12 to 14 Years | 5 (100.0%) | 0 (0.0%) |
| 15 Years | 0 (0.0%) | 0 (0.0%) |
| 16 and 17 Years | 0 (0.0%) | 0 (0.0%) |
| 18 to 24 Years | 0 (0.0%) | 0 (0.0%) |
| 25 to 34 Years | 3 (100.0%) | 2 (100.0%) |
| 35 to 44 Years | 0 (0.0%) | 0 (0.0%) |
| 45 to 54 Years | 0 (0.0%) | 0 (0.0%) |
| 55 to 64 Years | 0 (0.0%) | 2 (11.1%) |
| 65 to 74 Years | 0 (0.0%) | 0 (0.0%) |
| 75 Years and over | 0 (0.0%) | 0 (0.0%) |
| Total | 10 (15.9%) | 9 (25.7%) |
Income Above Poverty by Sex and Age in Whale Pass
According to the poverty statistics in Whale Pass, males aged 45 to 54 years and females aged 65 to 74 years are the age groups that are most secure financially, with 100.0% of males and 100.0% of females in these age groups living above the poverty line.
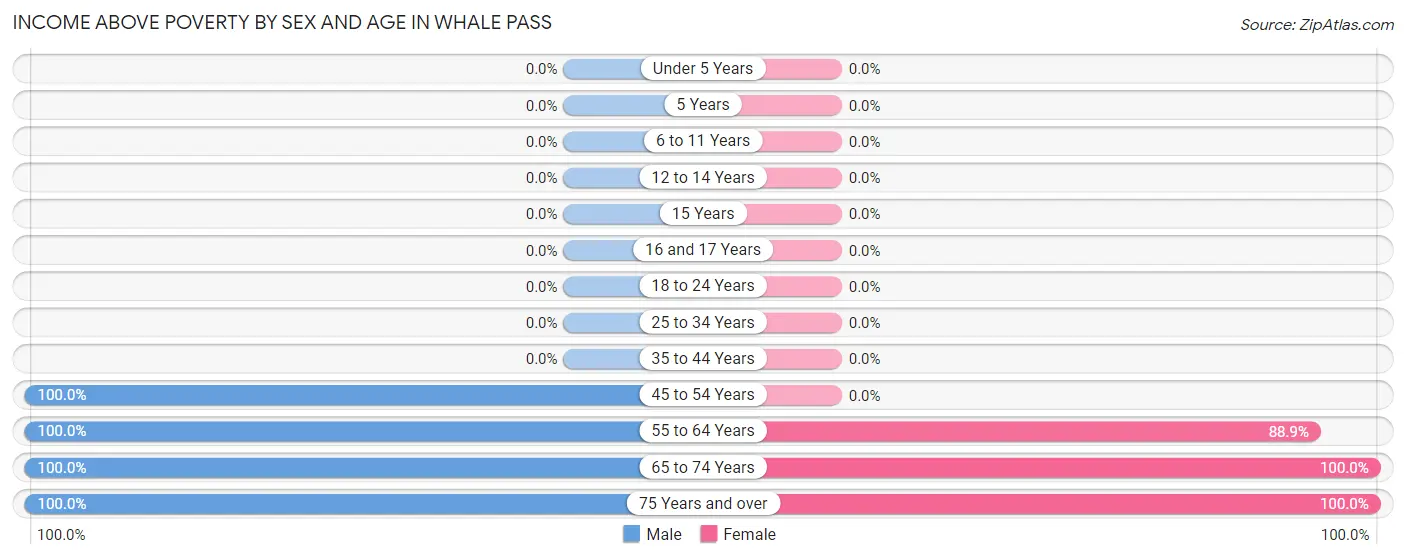
| Age Bracket | Male | Female |
| Under 5 Years | 0 (0.0%) | 0 (0.0%) |
| 5 Years | 0 (0.0%) | 0 (0.0%) |
| 6 to 11 Years | 0 (0.0%) | 0 (0.0%) |
| 12 to 14 Years | 0 (0.0%) | 0 (0.0%) |
| 15 Years | 0 (0.0%) | 0 (0.0%) |
| 16 and 17 Years | 0 (0.0%) | 0 (0.0%) |
| 18 to 24 Years | 0 (0.0%) | 0 (0.0%) |
| 25 to 34 Years | 0 (0.0%) | 0 (0.0%) |
| 35 to 44 Years | 0 (0.0%) | 0 (0.0%) |
| 45 to 54 Years | 16 (100.0%) | 0 (0.0%) |
| 55 to 64 Years | 16 (100.0%) | 16 (88.9%) |
| 65 to 74 Years | 2 (100.0%) | 3 (100.0%) |
| 75 Years and over | 19 (100.0%) | 7 (100.0%) |
| Total | 53 (84.1%) | 26 (74.3%) |
Income Below Poverty Among Married-Couple Families in Whale Pass
The poverty statistics for married-couple families in Whale Pass show that 17.6% or 3 of the total 17 families live below the poverty line. Families with 3 or 4 children have the highest poverty rate of 100.0%, comprising of 3 families. On the other hand, families with no children have the lowest poverty rate of 0.0%, which includes 0 families.
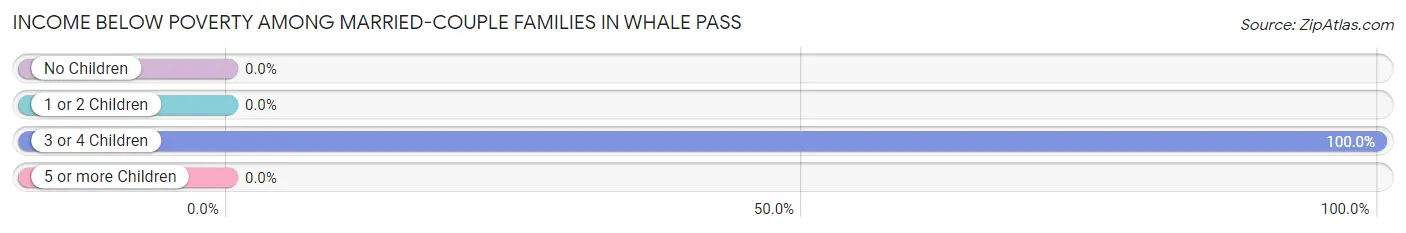
| Children | Above Poverty | Below Poverty |
| No Children | 14 (100.0%) | 0 (0.0%) |
| 1 or 2 Children | 0 (0.0%) | 0 (0.0%) |
| 3 or 4 Children | 0 (0.0%) | 3 (100.0%) |
| 5 or more Children | 0 (0.0%) | 0 (0.0%) |
| Total | 14 (82.4%) | 3 (17.6%) |
Income Below Poverty Among Single-Parent Households in Whale Pass
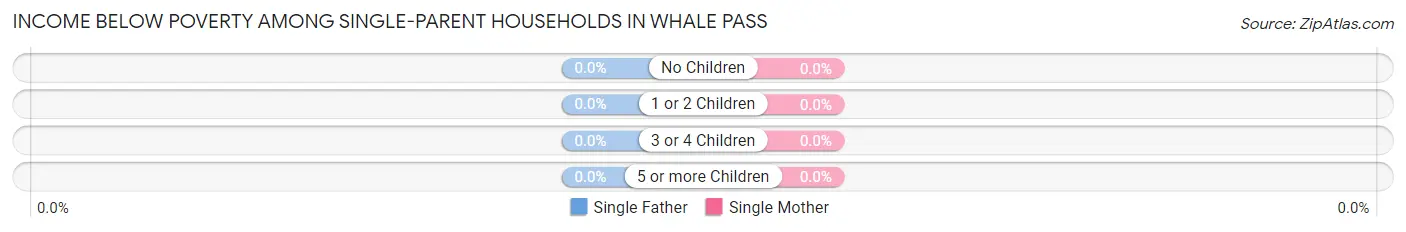
| Children | Single Father | Single Mother |
| No Children | 0 (0.0%) | 0 (0.0%) |
| 1 or 2 Children | 0 (0.0%) | 0 (0.0%) |
| 3 or 4 Children | 0 (0.0%) | 0 (0.0%) |
| 5 or more Children | 0 (0.0%) | 0 (0.0%) |
| Total | 0 (0.0%) | 0 (0.0%) |
Income Below Poverty Among Married-Couple vs Single-Parent Households in Whale Pass
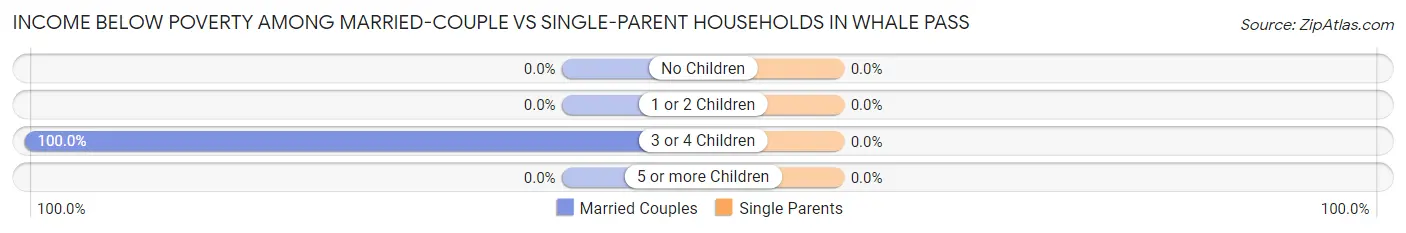
| Children | Married-Couple Families | Single-Parent Households |
| No Children | 0 (0.0%) | 0 (0.0%) |
| 1 or 2 Children | 0 (0.0%) | 0 (0.0%) |
| 3 or 4 Children | 3 (100.0%) | 0 (0.0%) |
| 5 or more Children | 0 (0.0%) | 0 (0.0%) |
| Total | 3 (17.6%) | 0 (0.0%) |
Race in Whale Pass
The most populous races in Whale Pass are White / Caucasian (98 | 100.0%), and Hispanic or Latino (5 | 5.1%).
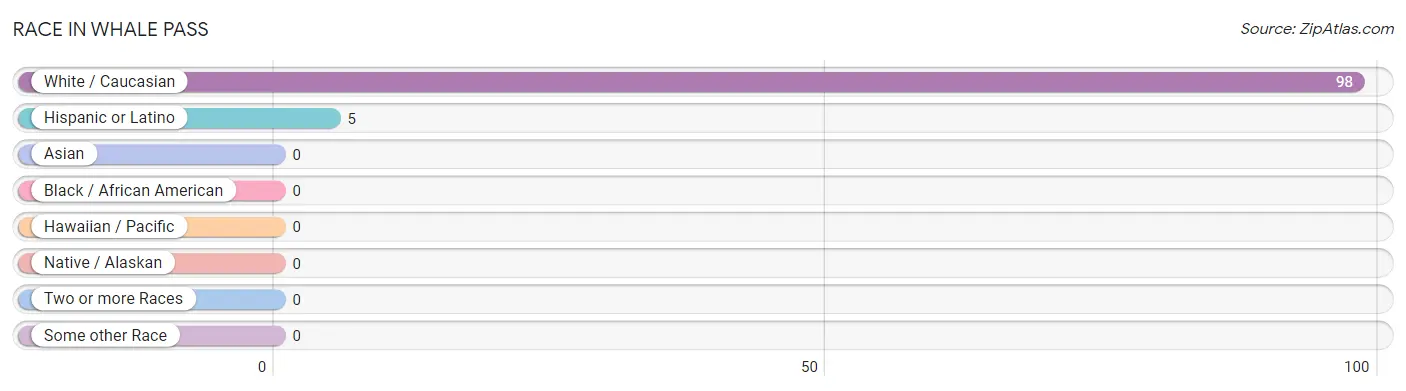
| Race | # Population | % Population |
| Asian | 0 | 0.0% |
| Black / African American | 0 | 0.0% |
| Hawaiian / Pacific | 0 | 0.0% |
| Hispanic or Latino | 5 | 5.1% |
| Native / Alaskan | 0 | 0.0% |
| White / Caucasian | 98 | 100.0% |
| Two or more Races | 0 | 0.0% |
| Some other Race | 0 | 0.0% |
| Total | 98 | 100.0% |
Ancestry in Whale Pass
The most populous ancestries reported in Whale Pass are English (53 | 54.1%), Dutch (26 | 26.5%), European (11 | 11.2%), Scottish (11 | 11.2%), and Mexican (5 | 5.1%), together accounting for 108.1% of all Whale Pass residents.
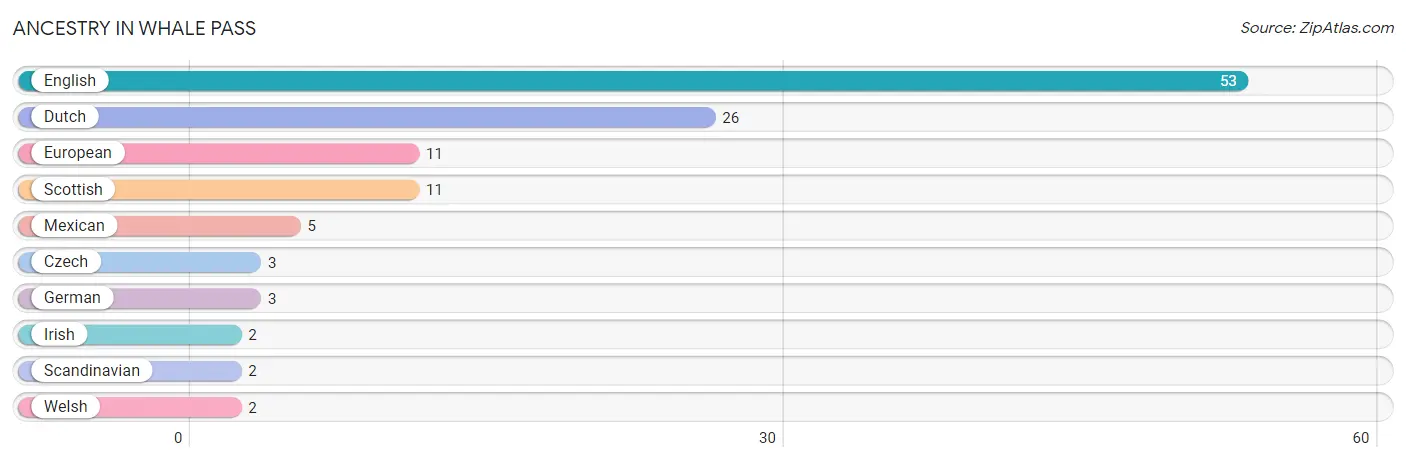
| Ancestry | # Population | % Population |
| Czech | 3 | 3.1% |
| Dutch | 26 | 26.5% |
| English | 53 | 54.1% |
| European | 11 | 11.2% |
| German | 3 | 3.1% |
| Irish | 2 | 2.0% |
| Mexican | 5 | 5.1% |
| Scandinavian | 2 | 2.0% |
| Scottish | 11 | 11.2% |
| Welsh | 2 | 2.0% | View All 10 Rows |
Immigrants in Whale Pass

| Immigration Origin | # Population | % Population | View All 0 Rows |
Sex and Age in Whale Pass
Sex and Age in Whale Pass
The most populous age groups in Whale Pass are 85 Years and over (19 | 30.2%) for men and 60 to 64 Years (14 | 40.0%) for women.
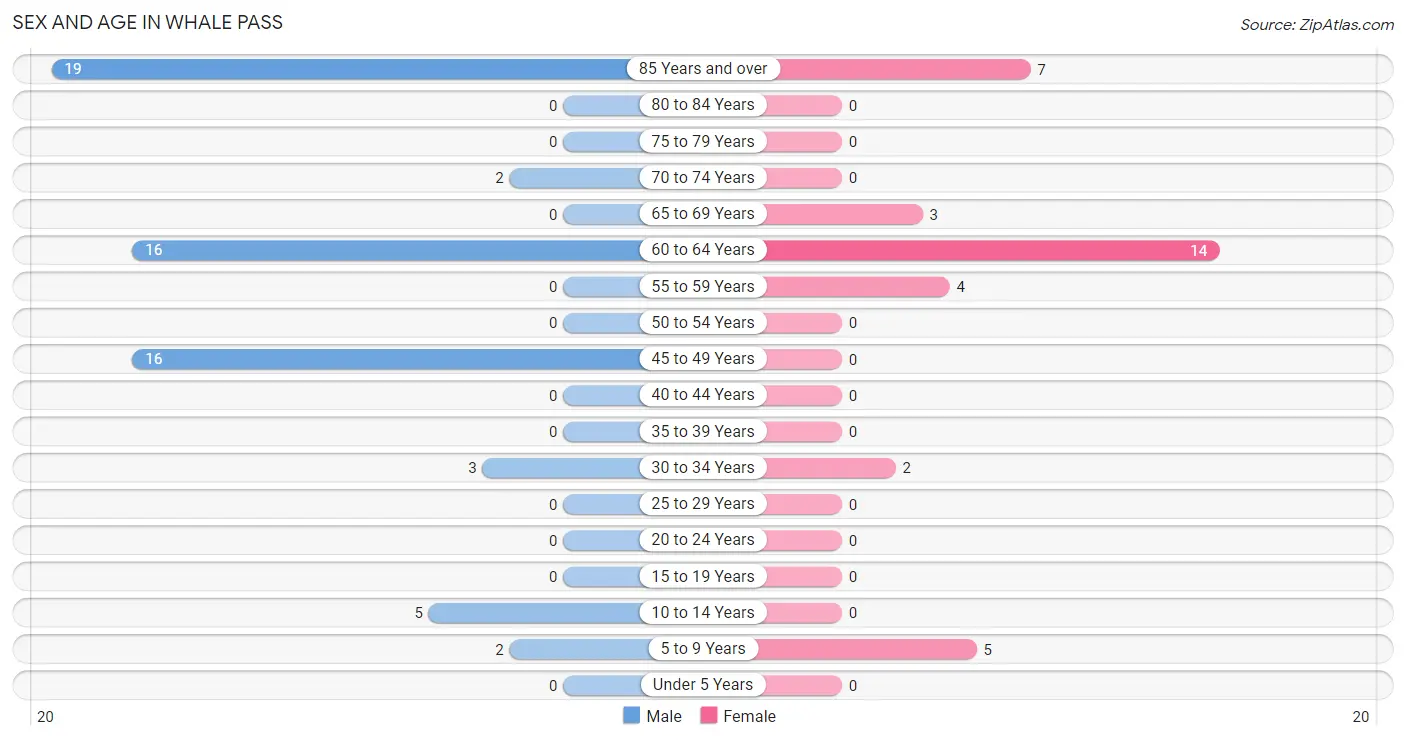
| Age Bracket | Male | Female |
| Under 5 Years | 0 (0.0%) | 0 (0.0%) |
| 5 to 9 Years | 2 (3.2%) | 5 (14.3%) |
| 10 to 14 Years | 5 (7.9%) | 0 (0.0%) |
| 15 to 19 Years | 0 (0.0%) | 0 (0.0%) |
| 20 to 24 Years | 0 (0.0%) | 0 (0.0%) |
| 25 to 29 Years | 0 (0.0%) | 0 (0.0%) |
| 30 to 34 Years | 3 (4.8%) | 2 (5.7%) |
| 35 to 39 Years | 0 (0.0%) | 0 (0.0%) |
| 40 to 44 Years | 0 (0.0%) | 0 (0.0%) |
| 45 to 49 Years | 16 (25.4%) | 0 (0.0%) |
| 50 to 54 Years | 0 (0.0%) | 0 (0.0%) |
| 55 to 59 Years | 0 (0.0%) | 4 (11.4%) |
| 60 to 64 Years | 16 (25.4%) | 14 (40.0%) |
| 65 to 69 Years | 0 (0.0%) | 3 (8.6%) |
| 70 to 74 Years | 2 (3.2%) | 0 (0.0%) |
| 75 to 79 Years | 0 (0.0%) | 0 (0.0%) |
| 80 to 84 Years | 0 (0.0%) | 0 (0.0%) |
| 85 Years and over | 19 (30.2%) | 7 (20.0%) |
| Total | 63 (100.0%) | 35 (100.0%) |
Families and Households in Whale Pass
Median Family Size in Whale Pass
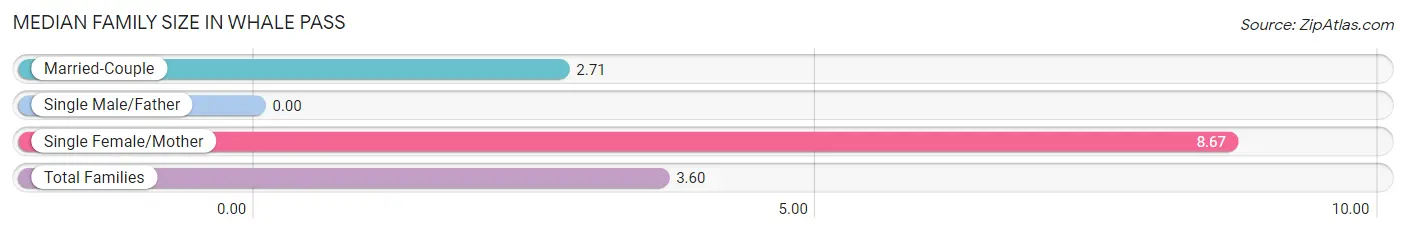
| Family Type | # Families | Family Size |
| Married-Couple | 17 (85.0%) | 2.71 |
| Single Male/Father | 0 (0.0%) | - |
| Single Female/Mother | 3 (15.0%) | 8.67 |
| Total Families | 20 (100.0%) | 3.60 |
Median Household Size in Whale Pass
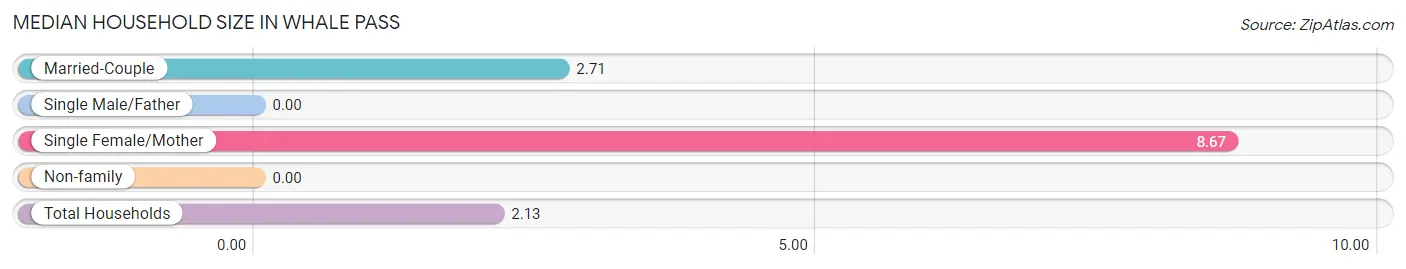
| Household Type | # Households | Household Size |
| Married-Couple | 17 (37.0%) | 2.71 |
| Single Male/Father | 0 (0.0%) | - |
| Single Female/Mother | 3 (6.5%) | 8.67 |
| Non-family | 26 (56.5%) | - |
| Total Households | 46 (100.0%) | 2.13 |
Household Size by Marriage Status in Whale Pass
Out of a total of 46 households in Whale Pass, 20 (43.5%) are family households, while 26 (56.5%) are nonfamily households. The most numerous type of family households are 2-person households, comprising 14, and the most common type of nonfamily households are 1-person households, comprising 26.
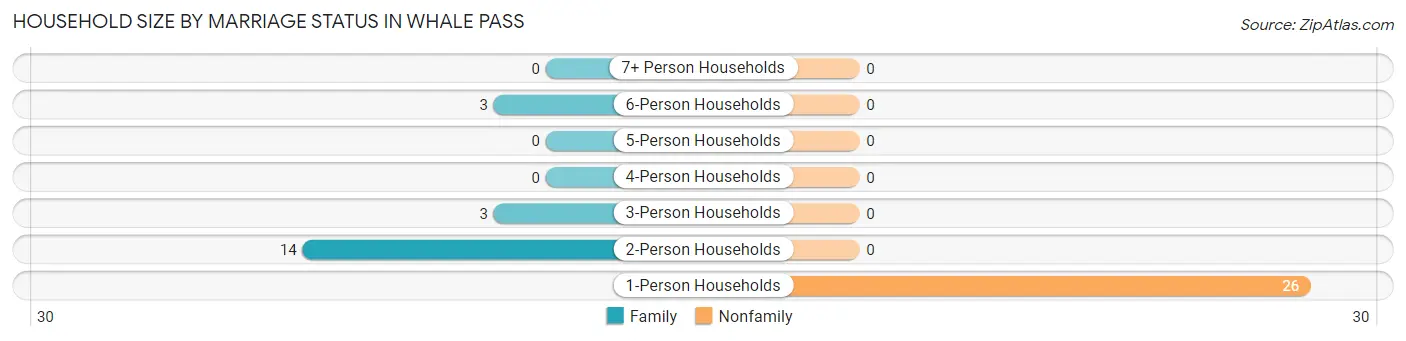
| Household Size | Family Households | Nonfamily Households |
| 1-Person Households | - | 26 (56.5%) |
| 2-Person Households | 14 (30.4%) | 0 (0.0%) |
| 3-Person Households | 3 (6.5%) | 0 (0.0%) |
| 4-Person Households | 0 (0.0%) | 0 (0.0%) |
| 5-Person Households | 0 (0.0%) | 0 (0.0%) |
| 6-Person Households | 3 (6.5%) | 0 (0.0%) |
| 7+ Person Households | 0 (0.0%) | 0 (0.0%) |
| Total | 20 (43.5%) | 26 (56.5%) |
Female Fertility in Whale Pass
Fertility by Age in Whale Pass
| Age Bracket | Women with Births | Births / 1,000 Women |
| 15 to 19 years | 0 (0.0%) | 0.0 |
| 20 to 34 years | 0 (0.0%) | 0.0 |
| 35 to 50 years | 0 (0.0%) | 0.0 |
| Total | 0 (0.0%) | 0.0 |
Fertility by Age by Marriage Status in Whale Pass
| Age Bracket | Married | Unmarried |
| 15 to 19 years | 0 (0.0%) | 0 (0.0%) |
| 20 to 34 years | 0 (0.0%) | 0 (0.0%) |
| 35 to 50 years | 0 (0.0%) | 0 (0.0%) |
| Total | 0 (0.0%) | 0 (0.0%) |
Fertility by Education in Whale Pass
| Educational Attainment | Women with Births | Births / 1,000 Women |
| Less than High School | 0 (0.0%) | 0.0 |
| High School Diploma | 0 (0.0%) | 0.0 |
| College or Associate's Degree | 0 (0.0%) | 0.0 |
| Bachelor's Degree | 0 (0.0%) | 0.0 |
| Graduate Degree | 0 (0.0%) | 0.0 |
| Total | 0 (0.0%) | 0.0 |
Fertility by Education by Marriage Status in Whale Pass
| Educational Attainment | Married | Unmarried |
| Less than High School | 0 (0.0%) | 0 (0.0%) |
| High School Diploma | 0 (0.0%) | 0 (0.0%) |
| College or Associate's Degree | 0 (0.0%) | 0 (0.0%) |
| Bachelor's Degree | 0 (0.0%) | 0 (0.0%) |
| Graduate Degree | 0 (0.0%) | 0 (0.0%) |
| Total | 0 (0.0%) | 0 (0.0%) |
Employment Characteristics in Whale Pass
Employment by Class of Employer in Whale Pass
Among the 48 employed individuals in Whale Pass, private company employees (18 | 37.5%), self-employed (incorporated) (13 | 27.1%), and unpaid family workers (11 | 22.9%) make up the most common classes of employment.
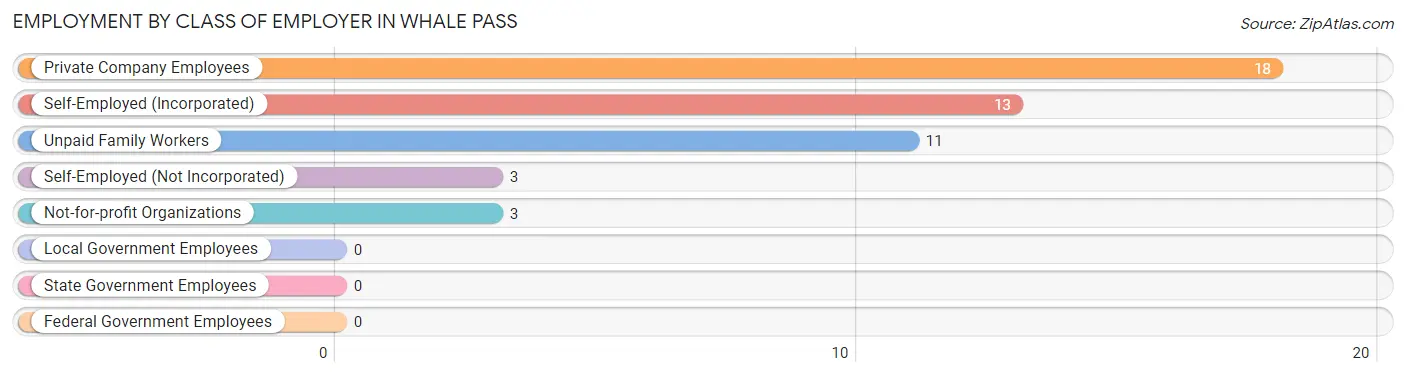
| Employer Class | # Employees | % Employees |
| Private Company Employees | 18 | 37.5% |
| Self-Employed (Incorporated) | 13 | 27.1% |
| Self-Employed (Not Incorporated) | 3 | 6.2% |
| Not-for-profit Organizations | 3 | 6.2% |
| Local Government Employees | 0 | 0.0% |
| State Government Employees | 0 | 0.0% |
| Federal Government Employees | 0 | 0.0% |
| Unpaid Family Workers | 11 | 22.9% |
| Total | 48 | 100.0% |
Employment Status by Age in Whale Pass
According to the labor force statistics for Whale Pass, out of the total population over 16 years of age (86), 59.3% or 51 individuals are in the labor force, with 5.9% or 3 of them unemployed. The age group with the highest labor force participation rate is 45 to 54 years, with 100.0% or 16 individuals in the labor force. Within the labor force, the 60 to 64 years age range has the highest percentage of unemployed individuals, with 11.1% or 3 of them being unemployed.
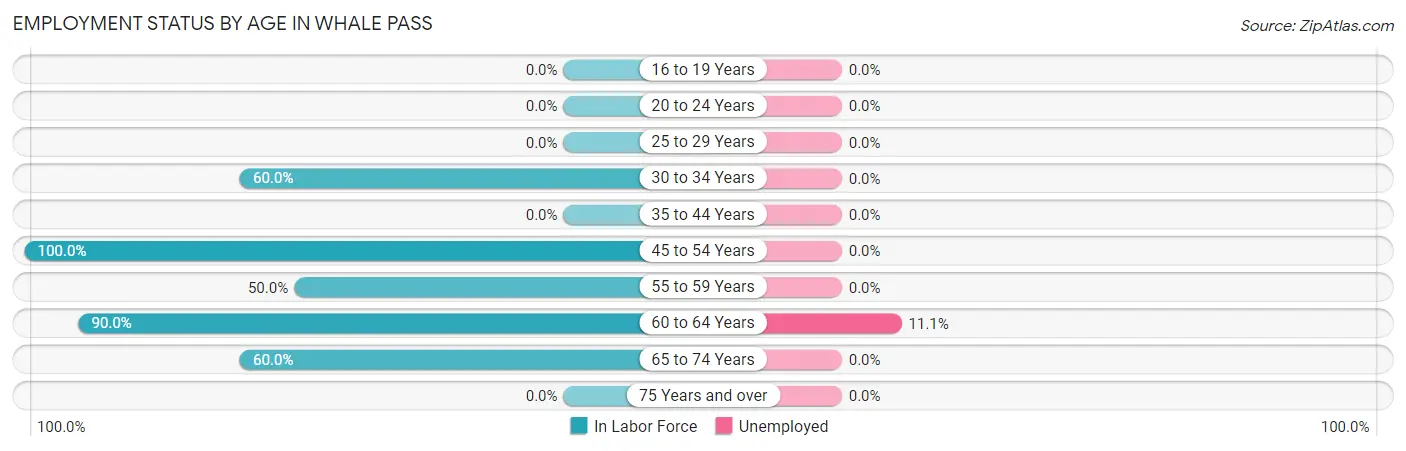
| Age Bracket | In Labor Force | Unemployed |
| 16 to 19 Years | 0 (0.0%) | 0 (0.0%) |
| 20 to 24 Years | 0 (0.0%) | 0 (0.0%) |
| 25 to 29 Years | 0 (0.0%) | 0 (0.0%) |
| 30 to 34 Years | 3 (60.0%) | 0 (0.0%) |
| 35 to 44 Years | 0 (0.0%) | 0 (0.0%) |
| 45 to 54 Years | 16 (100.0%) | 0 (0.0%) |
| 55 to 59 Years | 2 (50.0%) | 0 (0.0%) |
| 60 to 64 Years | 27 (90.0%) | 3 (11.1%) |
| 65 to 74 Years | 3 (60.0%) | 0 (0.0%) |
| 75 Years and over | 0 (0.0%) | 0 (0.0%) |
| Total | 51 (59.3%) | 3 (5.9%) |
Employment Status by Educational Attainment in Whale Pass
According to labor force statistics for Whale Pass, 87.3% of individuals (48) out of the total population between 25 and 64 years of age (55) are in the labor force, with 6.3% or 3 of them being unemployed. The group with the highest labor force participation rate are those with the educational attainment of college / associate degree, with 100.0% or 3 individuals in the labor force. Within the labor force, individuals with college / associate degree education have the highest percentage of unemployment, with 100.0% or 3 of them being unemployed.
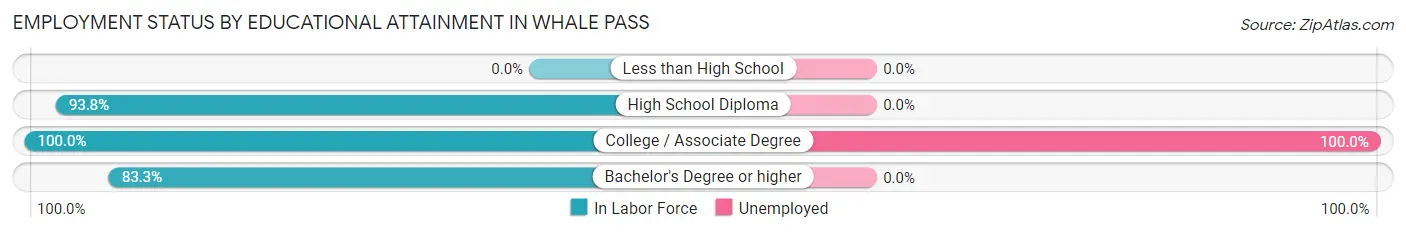
| Educational Attainment | In Labor Force | Unemployed |
| Less than High School | 0 (0.0%) | 0 (0.0%) |
| High School Diploma | 30 (93.8%) | 0 (0.0%) |
| College / Associate Degree | 3 (100.0%) | 3 (100.0%) |
| Bachelor's Degree or higher | 15 (83.3%) | 0 (0.0%) |
| Total | 48 (87.3%) | 3 (6.3%) |
Employment Occupations by Sex in Whale Pass
Management, Business, Science and Arts Occupations
The most common Management, Business, Science and Arts occupations in Whale Pass are Management (24 | 50.0%), and Business & Financial (2 | 4.2%).
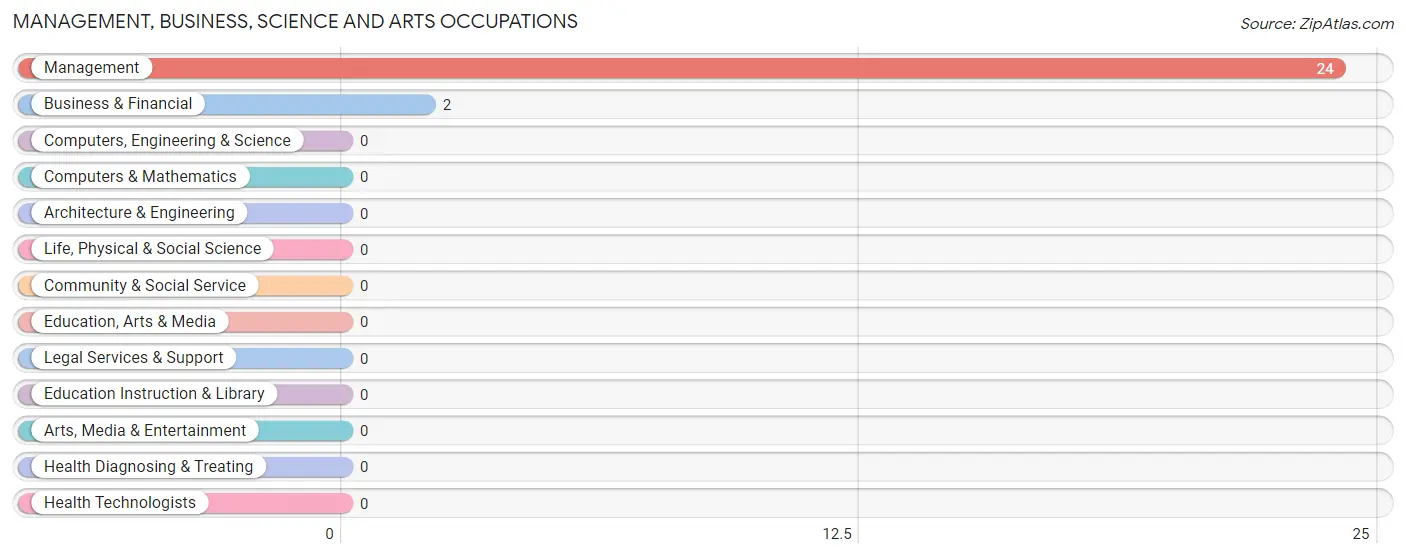
Management, Business, Science and Arts Occupations by Sex
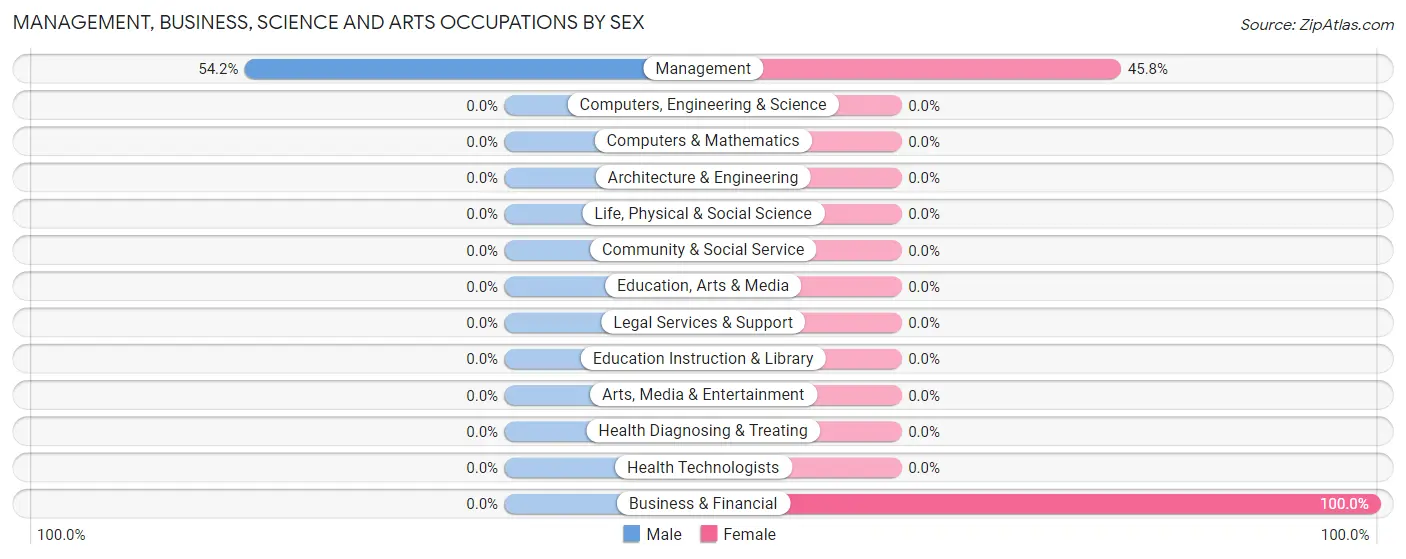
| Occupation | Male | Female |
| Management | 13 (54.2%) | 11 (45.8%) |
| Business & Financial | 0 (0.0%) | 2 (100.0%) |
| Computers, Engineering & Science | 0 (0.0%) | 0 (0.0%) |
| Computers & Mathematics | 0 (0.0%) | 0 (0.0%) |
| Architecture & Engineering | 0 (0.0%) | 0 (0.0%) |
| Life, Physical & Social Science | 0 (0.0%) | 0 (0.0%) |
| Community & Social Service | 0 (0.0%) | 0 (0.0%) |
| Education, Arts & Media | 0 (0.0%) | 0 (0.0%) |
| Legal Services & Support | 0 (0.0%) | 0 (0.0%) |
| Education Instruction & Library | 0 (0.0%) | 0 (0.0%) |
| Arts, Media & Entertainment | 0 (0.0%) | 0 (0.0%) |
| Health Diagnosing & Treating | 0 (0.0%) | 0 (0.0%) |
| Health Technologists | 0 (0.0%) | 0 (0.0%) |
| Total (Category) | 13 (50.0%) | 13 (50.0%) |
| Total (Overall) | 32 (66.7%) | 16 (33.3%) |
Services Occupations
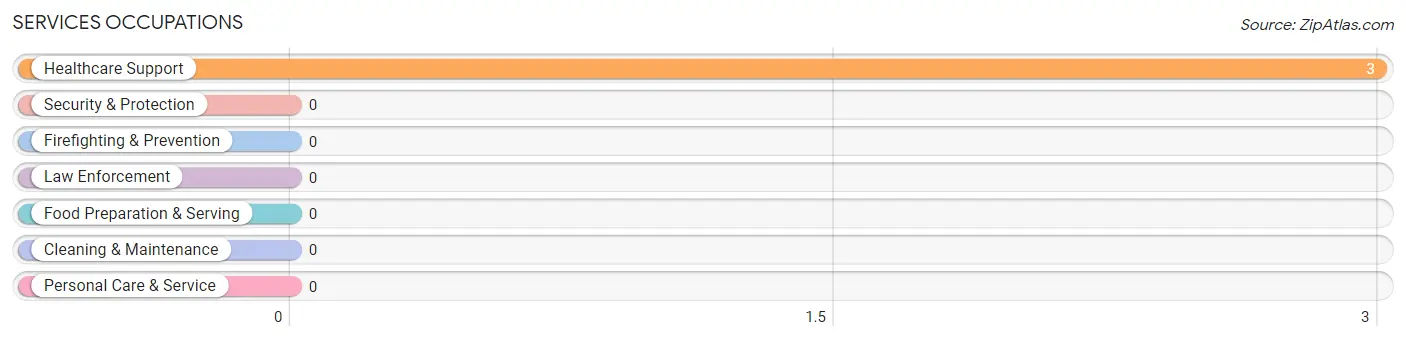
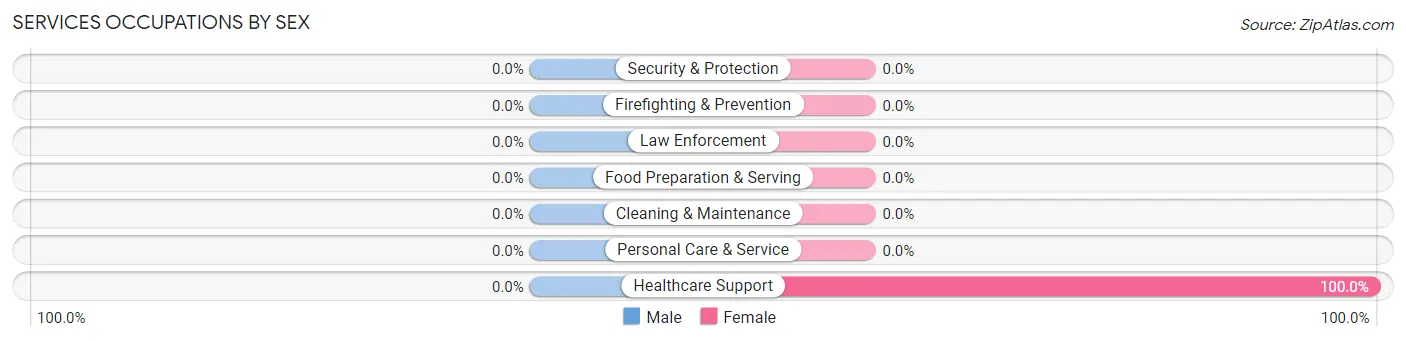
The most common Services occupations in Whale Pass are , and Healthcare Support (3 | 6.2%).
Services Occupations by Sex
| Occupation | Male | Female |
| Healthcare Support | 0 (0.0%) | 3 (100.0%) |
| Security & Protection | 0 (0.0%) | 0 (0.0%) |
| Firefighting & Prevention | 0 (0.0%) | 0 (0.0%) |
| Law Enforcement | 0 (0.0%) | 0 (0.0%) |
| Food Preparation & Serving | 0 (0.0%) | 0 (0.0%) |
| Cleaning & Maintenance | 0 (0.0%) | 0 (0.0%) |
| Personal Care & Service | 0 (0.0%) | 0 (0.0%) |
| Total (Category) | 0 (0.0%) | 3 (100.0%) |
| Total (Overall) | 32 (66.7%) | 16 (33.3%) |
Sales and Office Occupations
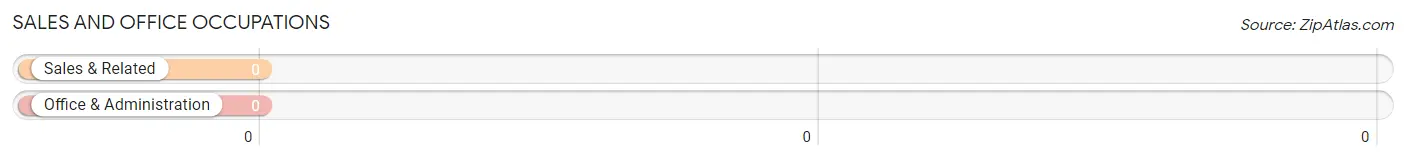
Sales and Office Occupations by Sex
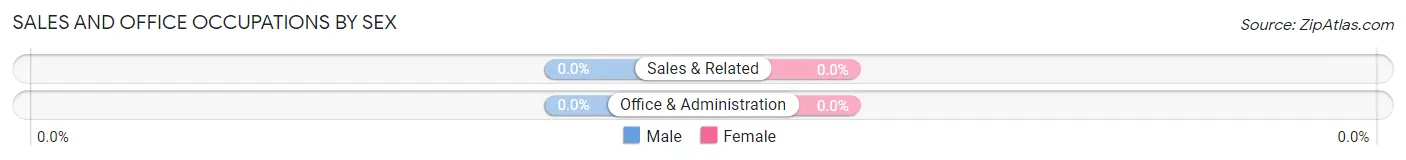
| Occupation | Male | Female |
| Sales & Related | 0 (0.0%) | 0 (0.0%) |
| Office & Administration | 0 (0.0%) | 0 (0.0%) |
| Total (Category) | 0 (0.0%) | 0 (0.0%) |
| Total (Overall) | 32 (66.7%) | 16 (33.3%) |
Natural Resources, Construction and Maintenance Occupations
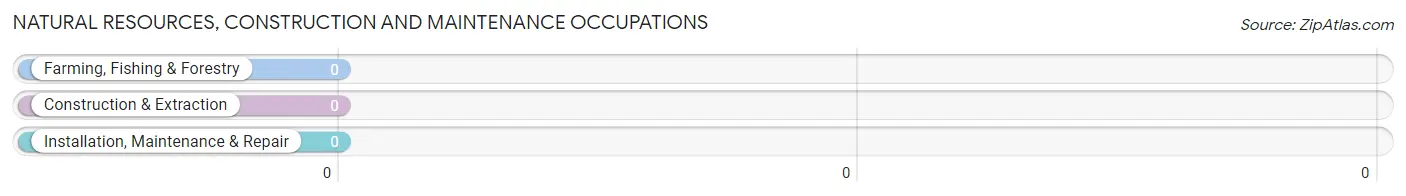
Natural Resources, Construction and Maintenance Occupations by Sex
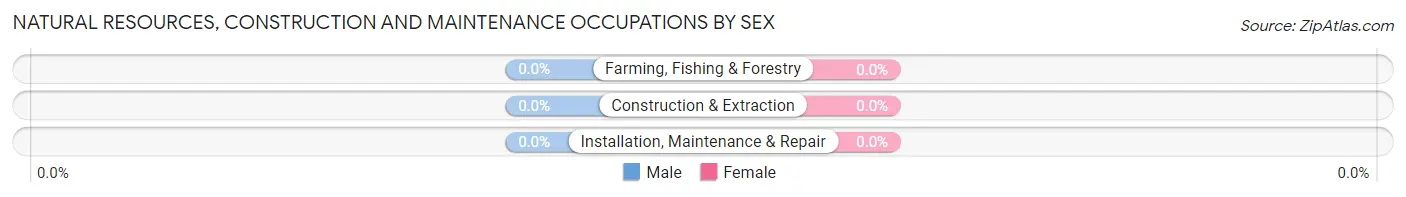
| Occupation | Male | Female |
| Farming, Fishing & Forestry | 0 (0.0%) | 0 (0.0%) |
| Construction & Extraction | 0 (0.0%) | 0 (0.0%) |
| Installation, Maintenance & Repair | 0 (0.0%) | 0 (0.0%) |
| Total (Category) | 0 (0.0%) | 0 (0.0%) |
| Total (Overall) | 32 (66.7%) | 16 (33.3%) |
Production, Transportation and Moving Occupations
The most common Production, Transportation and Moving occupations in Whale Pass are , and Material Moving (19 | 39.6%).
Production, Transportation and Moving Occupations by Sex
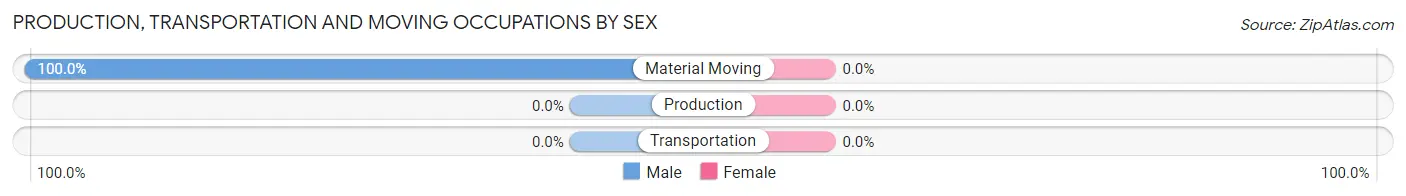
| Occupation | Male | Female |
| Production | 0 (0.0%) | 0 (0.0%) |
| Transportation | 0 (0.0%) | 0 (0.0%) |
| Material Moving | 19 (100.0%) | 0 (0.0%) |
| Total (Category) | 19 (100.0%) | 0 (0.0%) |
| Total (Overall) | 32 (66.7%) | 16 (33.3%) |
Employment Industries by Sex in Whale Pass
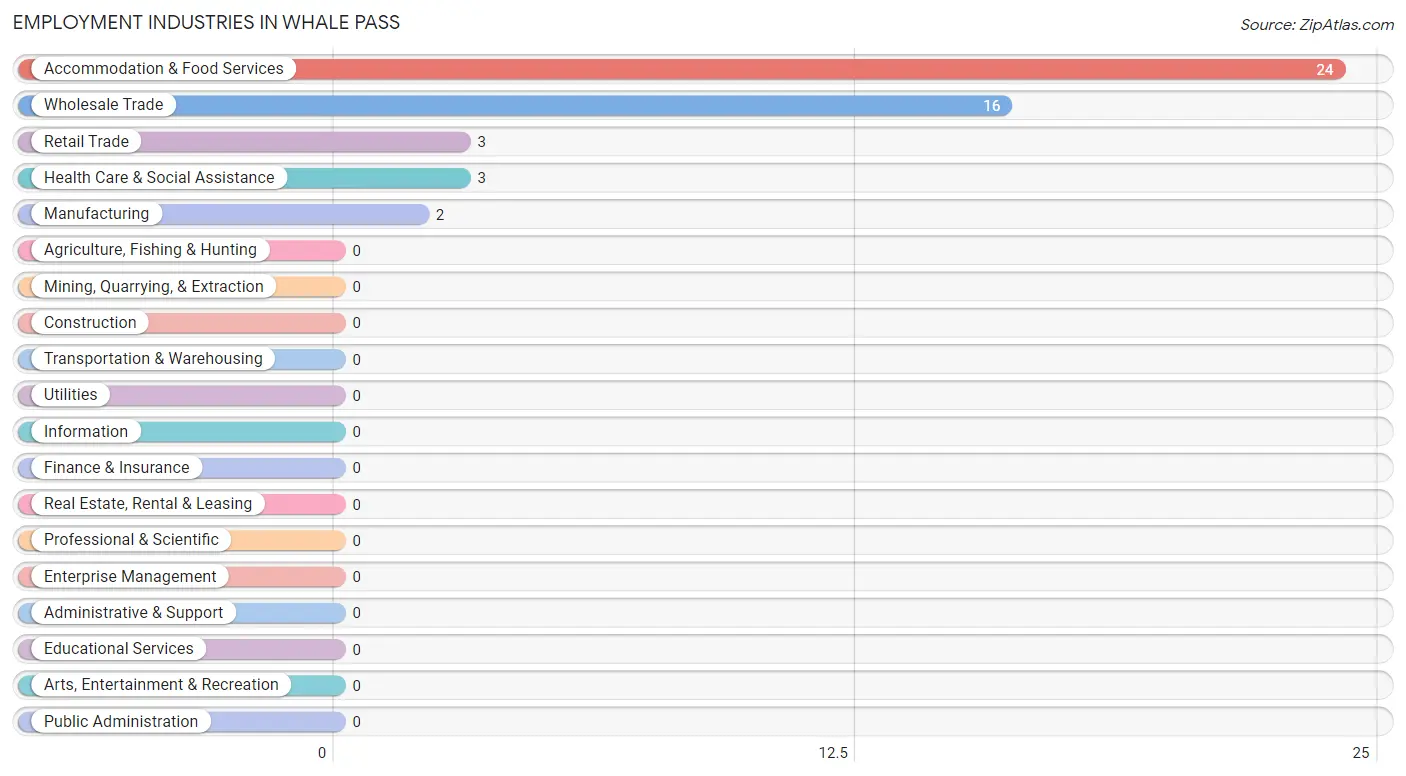
Employment Industries in Whale Pass
The major employment industries in Whale Pass include Accommodation & Food Services (24 | 50.0%), Wholesale Trade (16 | 33.3%), Retail Trade (3 | 6.2%), Health Care & Social Assistance (3 | 6.2%), and Manufacturing (2 | 4.2%).
Employment Industries by Sex in Whale Pass
The Whale Pass industries that see more men than women are Wholesale Trade (100.0%), Retail Trade (100.0%), and Accommodation & Food Services (54.2%), whereas the industries that tend to have a higher number of women are Manufacturing (100.0%), Health Care & Social Assistance (100.0%), and Accommodation & Food Services (45.8%).
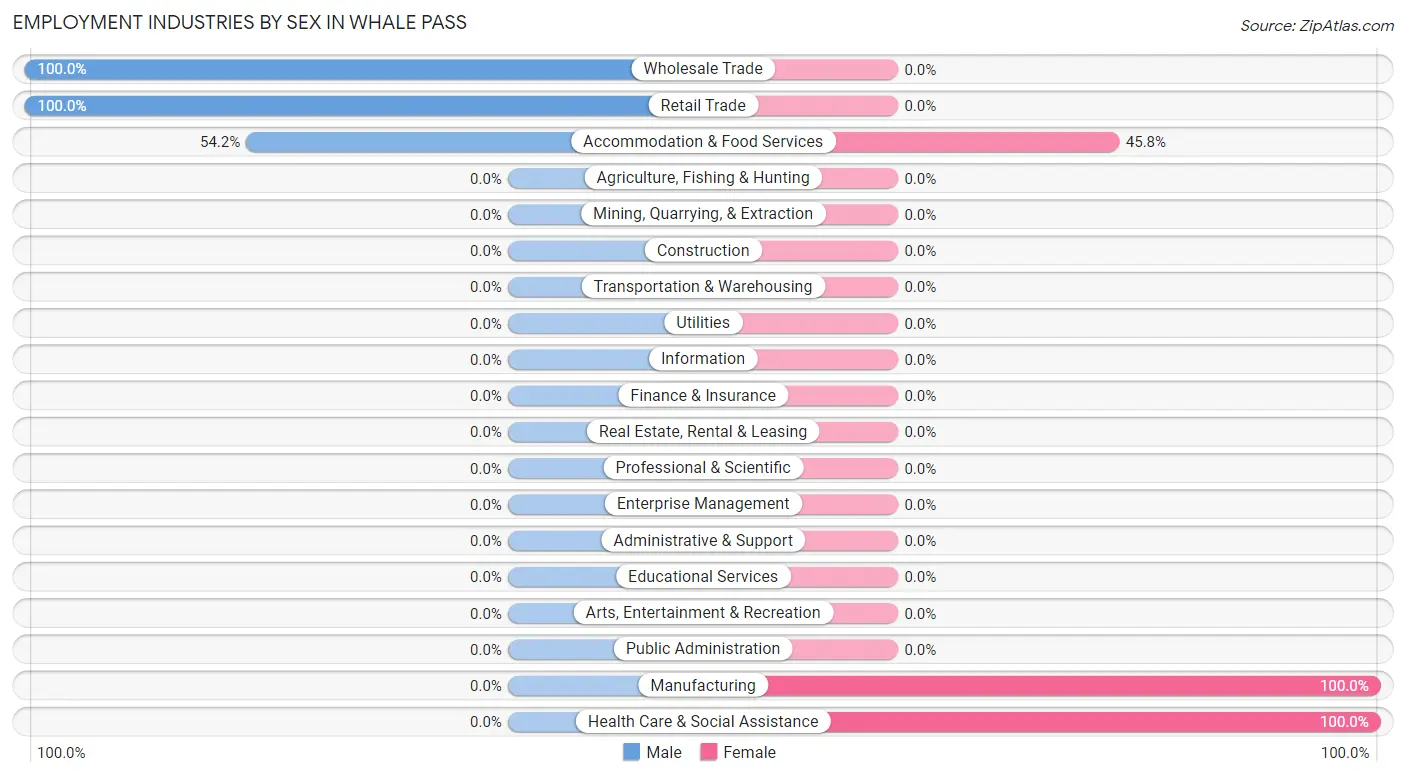
| Industry | Male | Female |
| Agriculture, Fishing & Hunting | 0 (0.0%) | 0 (0.0%) |
| Mining, Quarrying, & Extraction | 0 (0.0%) | 0 (0.0%) |
| Construction | 0 (0.0%) | 0 (0.0%) |
| Manufacturing | 0 (0.0%) | 2 (100.0%) |
| Wholesale Trade | 16 (100.0%) | 0 (0.0%) |
| Retail Trade | 3 (100.0%) | 0 (0.0%) |
| Transportation & Warehousing | 0 (0.0%) | 0 (0.0%) |
| Utilities | 0 (0.0%) | 0 (0.0%) |
| Information | 0 (0.0%) | 0 (0.0%) |
| Finance & Insurance | 0 (0.0%) | 0 (0.0%) |
| Real Estate, Rental & Leasing | 0 (0.0%) | 0 (0.0%) |
| Professional & Scientific | 0 (0.0%) | 0 (0.0%) |
| Enterprise Management | 0 (0.0%) | 0 (0.0%) |
| Administrative & Support | 0 (0.0%) | 0 (0.0%) |
| Educational Services | 0 (0.0%) | 0 (0.0%) |
| Health Care & Social Assistance | 0 (0.0%) | 3 (100.0%) |
| Arts, Entertainment & Recreation | 0 (0.0%) | 0 (0.0%) |
| Accommodation & Food Services | 13 (54.2%) | 11 (45.8%) |
| Public Administration | 0 (0.0%) | 0 (0.0%) |
| Total | 32 (66.7%) | 16 (33.3%) |
Education in Whale Pass
School Enrollment in Whale Pass
The most common levels of schooling among the 12 students in Whale Pass are elementary school (5 | 41.7%), high school (5 | 41.7%), and kindergarten (2 | 16.7%).
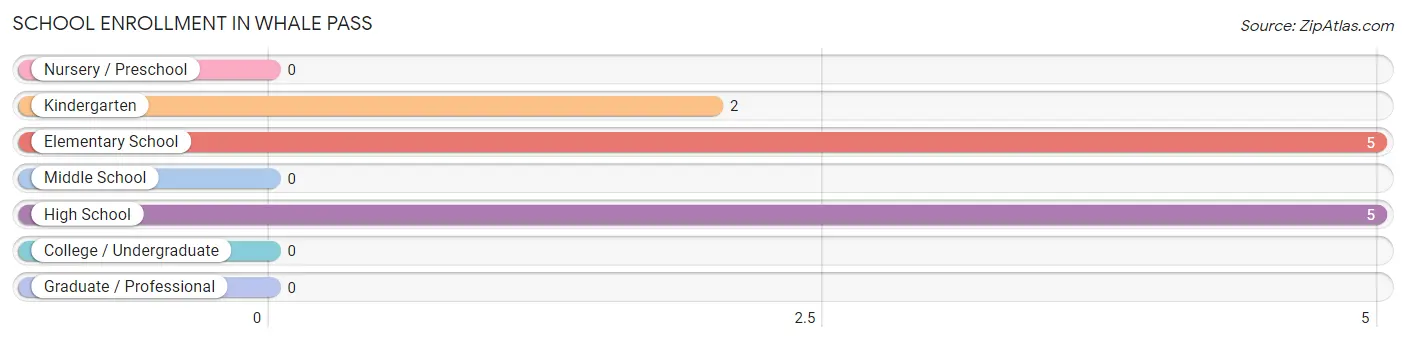
| School Level | # Students | % Students |
| Nursery / Preschool | 0 | 0.0% |
| Kindergarten | 2 | 16.7% |
| Elementary School | 5 | 41.7% |
| Middle School | 0 | 0.0% |
| High School | 5 | 41.7% |
| College / Undergraduate | 0 | 0.0% |
| Graduate / Professional | 0 | 0.0% |
| Total | 12 | 100.0% |
School Enrollment by Age by Funding Source in Whale Pass
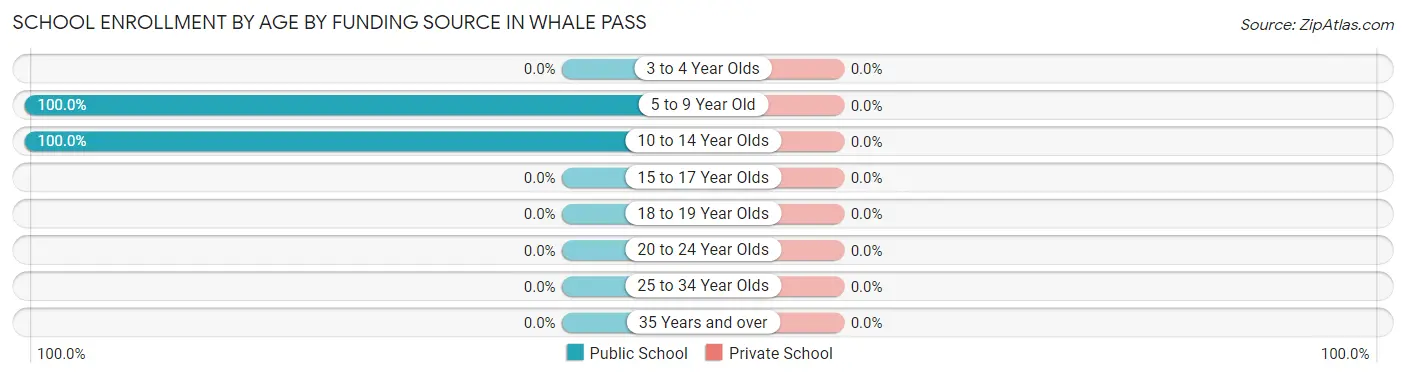
| Age Bracket | Public School | Private School |
| 3 to 4 Year Olds | 0 (0.0%) | 0 (0.0%) |
| 5 to 9 Year Old | 7 (100.0%) | 0 (0.0%) |
| 10 to 14 Year Olds | 5 (100.0%) | 0 (0.0%) |
| 15 to 17 Year Olds | 0 (0.0%) | 0 (0.0%) |
| 18 to 19 Year Olds | 0 (0.0%) | 0 (0.0%) |
| 20 to 24 Year Olds | 0 (0.0%) | 0 (0.0%) |
| 25 to 34 Year Olds | 0 (0.0%) | 0 (0.0%) |
| 35 Years and over | 0 (0.0%) | 0 (0.0%) |
| Total | 12 (100.0%) | 0 (0.0%) |
Educational Attainment by Field of Study in Whale Pass
Business (18 | 50.0%), bio, nature & agricultural (16 | 44.4%), and multidisciplinary studies (2 | 5.6%) are the most common fields of study among 36 individuals in Whale Pass who have obtained a bachelor's degree or higher.
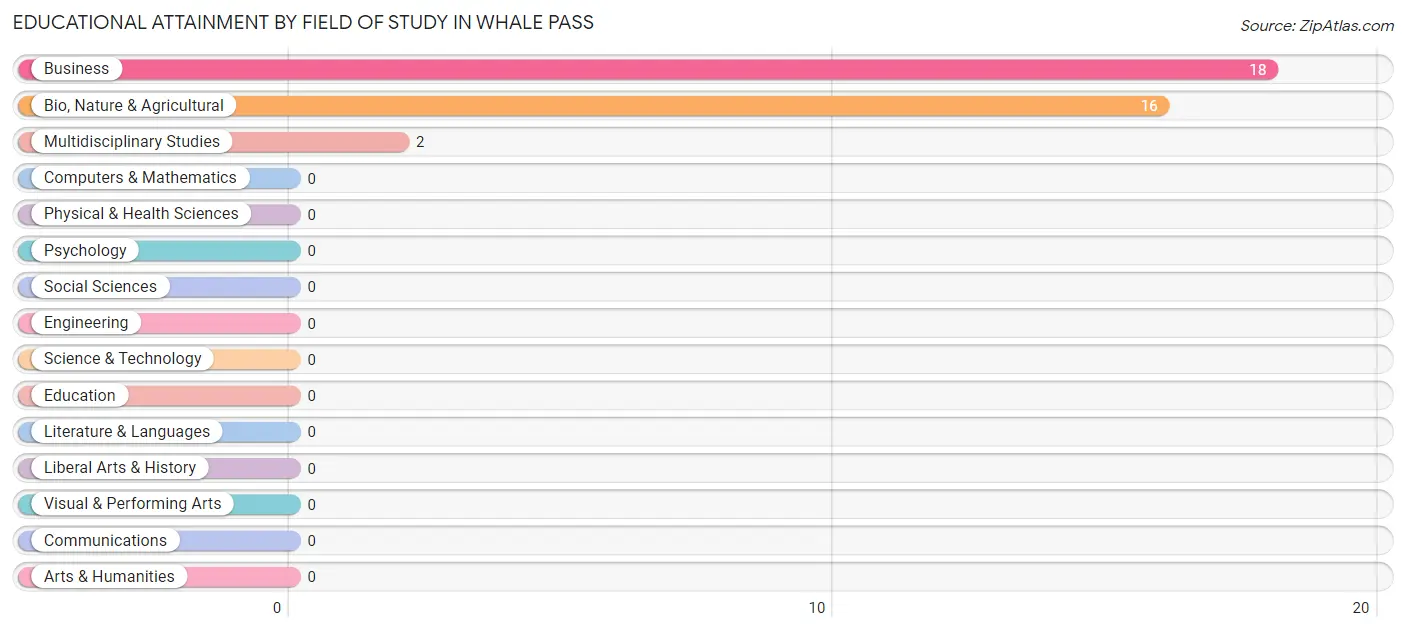
| Field of Study | # Graduates | % Graduates |
| Computers & Mathematics | 0 | 0.0% |
| Bio, Nature & Agricultural | 16 | 44.4% |
| Physical & Health Sciences | 0 | 0.0% |
| Psychology | 0 | 0.0% |
| Social Sciences | 0 | 0.0% |
| Engineering | 0 | 0.0% |
| Multidisciplinary Studies | 2 | 5.6% |
| Science & Technology | 0 | 0.0% |
| Business | 18 | 50.0% |
| Education | 0 | 0.0% |
| Literature & Languages | 0 | 0.0% |
| Liberal Arts & History | 0 | 0.0% |
| Visual & Performing Arts | 0 | 0.0% |
| Communications | 0 | 0.0% |
| Arts & Humanities | 0 | 0.0% |
| Total | 36 | 100.0% |
Transportation & Commute in Whale Pass
Vehicle Availability by Sex in Whale Pass
The most prevalent vehicle ownership categories in Whale Pass are males with 1 vehicle (16, accounting for 50.0%) and females with 1 vehicle (0, making up 100.0%).
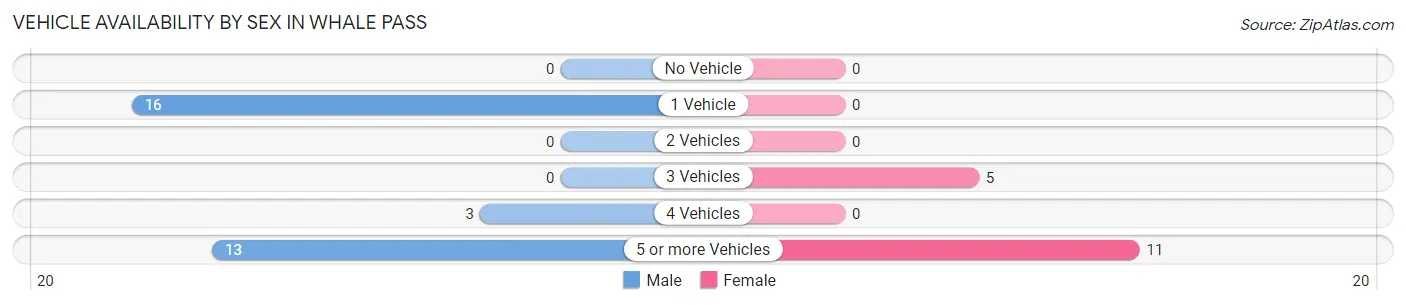
| Vehicles Available | Male | Female |
| No Vehicle | 0 (0.0%) | 0 (0.0%) |
| 1 Vehicle | 16 (50.0%) | 0 (0.0%) |
| 2 Vehicles | 0 (0.0%) | 0 (0.0%) |
| 3 Vehicles | 0 (0.0%) | 5 (31.2%) |
| 4 Vehicles | 3 (9.4%) | 0 (0.0%) |
| 5 or more Vehicles | 13 (40.6%) | 11 (68.8%) |
| Total | 32 (100.0%) | 16 (100.0%) |
Commute Time in Whale Pass
The most frequently occuring commute durations in Whale Pass are less than 5 minutes (26 commuters, 61.9%), 45 to 59 minutes (16 commuters, 38.1%), and 5 to 9 minutes (0 commuters, 0.0%).
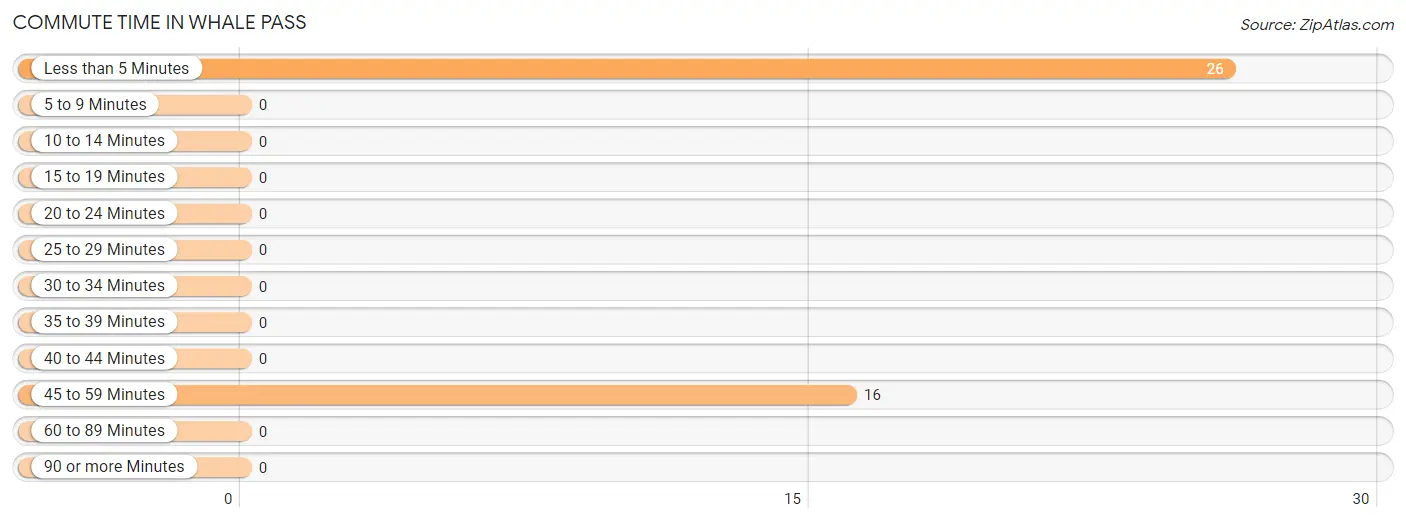
| Commute Time | # Commuters | % Commuters |
| Less than 5 Minutes | 26 | 61.9% |
| 5 to 9 Minutes | 0 | 0.0% |
| 10 to 14 Minutes | 0 | 0.0% |
| 15 to 19 Minutes | 0 | 0.0% |
| 20 to 24 Minutes | 0 | 0.0% |
| 25 to 29 Minutes | 0 | 0.0% |
| 30 to 34 Minutes | 0 | 0.0% |
| 35 to 39 Minutes | 0 | 0.0% |
| 40 to 44 Minutes | 0 | 0.0% |
| 45 to 59 Minutes | 16 | 38.1% |
| 60 to 89 Minutes | 0 | 0.0% |
| 90 or more Minutes | 0 | 0.0% |
Commute Time by Sex in Whale Pass
The most common commute times in Whale Pass are 45 to 59 minutes (16 commuters, 55.2%) for males and less than 5 minutes (13 commuters, 100.0%) for females.
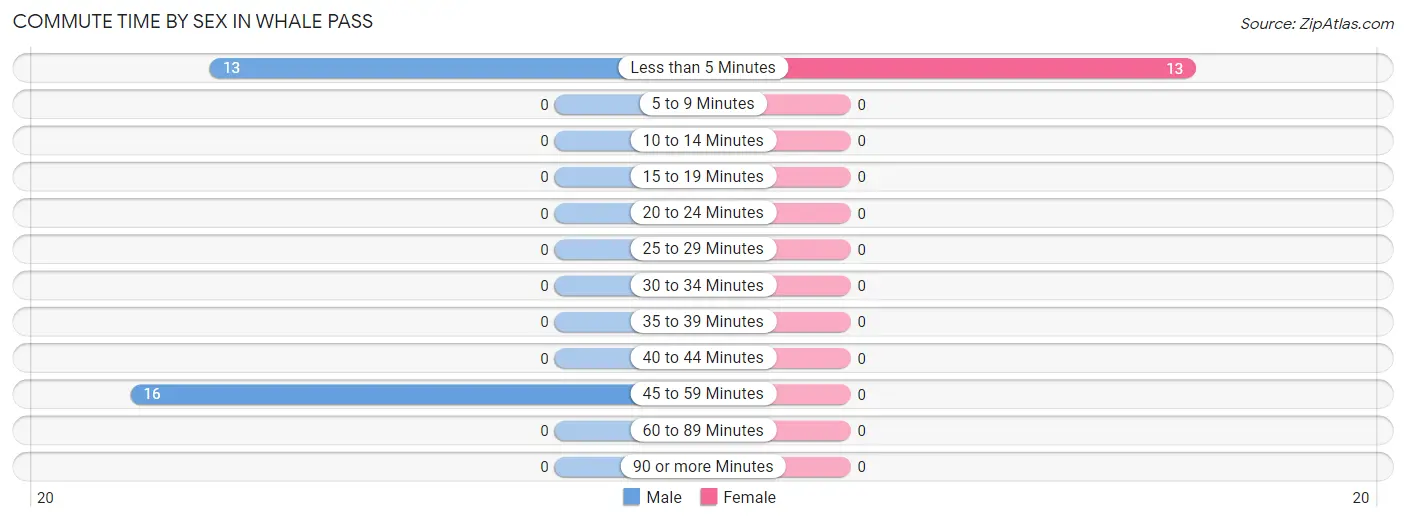
| Commute Time | Male | Female |
| Less than 5 Minutes | 13 (44.8%) | 13 (100.0%) |
| 5 to 9 Minutes | 0 (0.0%) | 0 (0.0%) |
| 10 to 14 Minutes | 0 (0.0%) | 0 (0.0%) |
| 15 to 19 Minutes | 0 (0.0%) | 0 (0.0%) |
| 20 to 24 Minutes | 0 (0.0%) | 0 (0.0%) |
| 25 to 29 Minutes | 0 (0.0%) | 0 (0.0%) |
| 30 to 34 Minutes | 0 (0.0%) | 0 (0.0%) |
| 35 to 39 Minutes | 0 (0.0%) | 0 (0.0%) |
| 40 to 44 Minutes | 0 (0.0%) | 0 (0.0%) |
| 45 to 59 Minutes | 16 (55.2%) | 0 (0.0%) |
| 60 to 89 Minutes | 0 (0.0%) | 0 (0.0%) |
| 90 or more Minutes | 0 (0.0%) | 0 (0.0%) |
Time of Departure to Work by Sex in Whale Pass
The most frequent times of departure to work in Whale Pass are 7:00 AM to 7:29 AM (16, 55.2%) for males and 12:00 AM to 4:59 AM (11, 84.6%) for females.
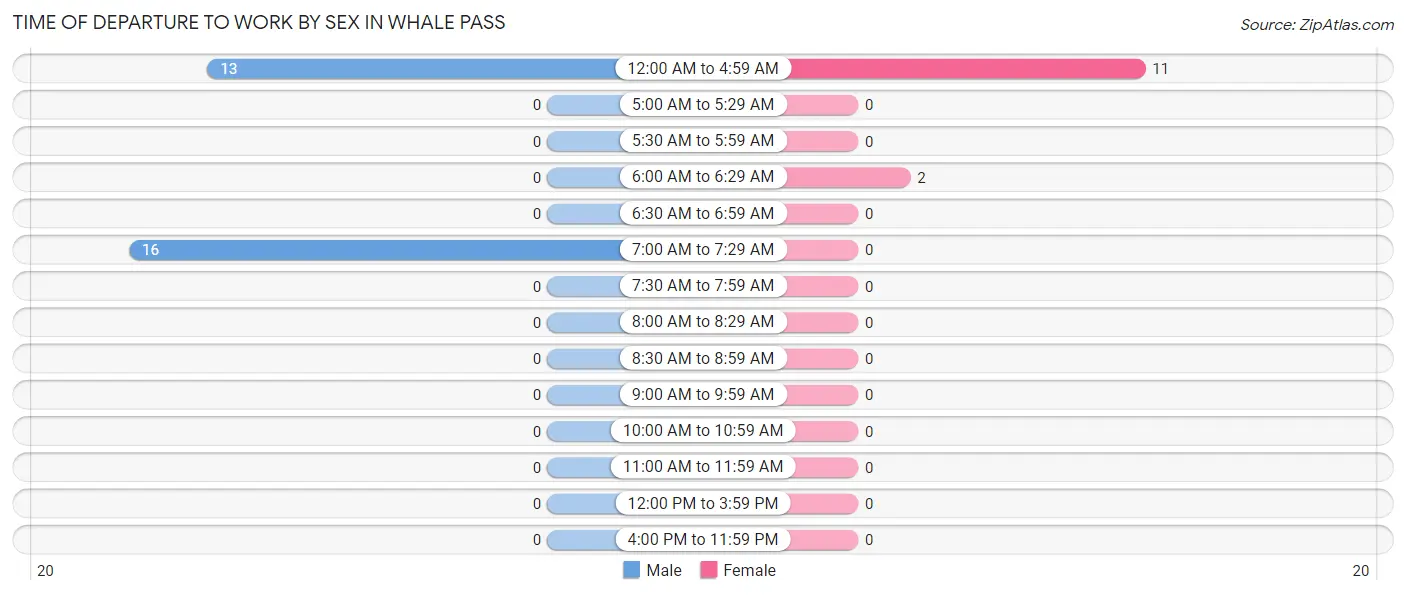
| Time of Departure | Male | Female |
| 12:00 AM to 4:59 AM | 13 (44.8%) | 11 (84.6%) |
| 5:00 AM to 5:29 AM | 0 (0.0%) | 0 (0.0%) |
| 5:30 AM to 5:59 AM | 0 (0.0%) | 0 (0.0%) |
| 6:00 AM to 6:29 AM | 0 (0.0%) | 2 (15.4%) |
| 6:30 AM to 6:59 AM | 0 (0.0%) | 0 (0.0%) |
| 7:00 AM to 7:29 AM | 16 (55.2%) | 0 (0.0%) |
| 7:30 AM to 7:59 AM | 0 (0.0%) | 0 (0.0%) |
| 8:00 AM to 8:29 AM | 0 (0.0%) | 0 (0.0%) |
| 8:30 AM to 8:59 AM | 0 (0.0%) | 0 (0.0%) |
| 9:00 AM to 9:59 AM | 0 (0.0%) | 0 (0.0%) |
| 10:00 AM to 10:59 AM | 0 (0.0%) | 0 (0.0%) |
| 11:00 AM to 11:59 AM | 0 (0.0%) | 0 (0.0%) |
| 12:00 PM to 3:59 PM | 0 (0.0%) | 0 (0.0%) |
| 4:00 PM to 11:59 PM | 0 (0.0%) | 0 (0.0%) |
| Total | 29 (100.0%) | 13 (100.0%) |
Housing Occupancy in Whale Pass
Occupancy by Ownership in Whale Pass
Of the total 46 dwellings in Whale Pass, owner-occupied units account for 38 (82.6%), while renter-occupied units make up 8 (17.4%).
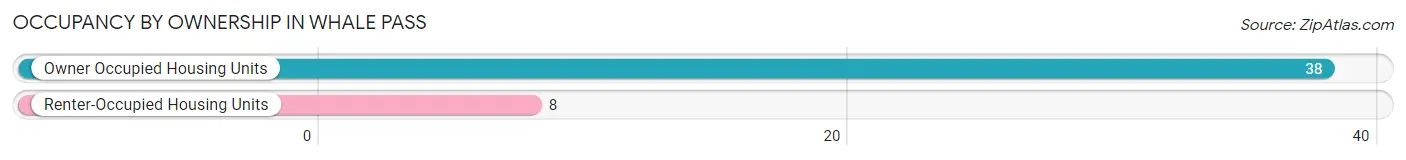
| Occupancy | # Housing Units | % Housing Units |
| Owner Occupied Housing Units | 38 | 82.6% |
| Renter-Occupied Housing Units | 8 | 17.4% |
| Total Occupied Housing Units | 46 | 100.0% |
Occupancy by Household Size in Whale Pass
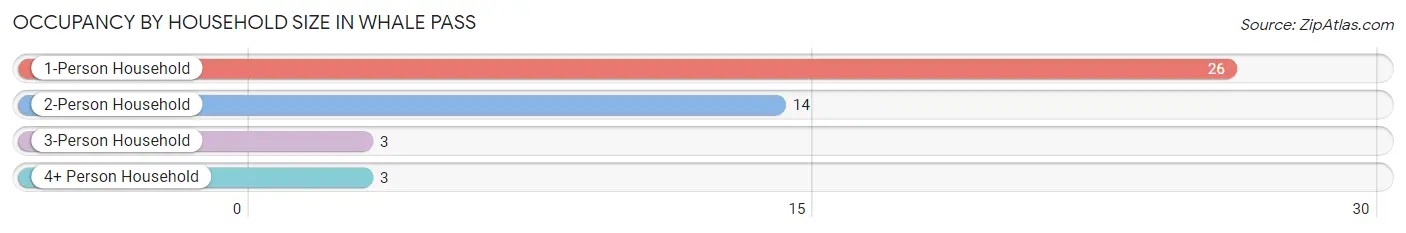
| Household Size | # Housing Units | % Housing Units |
| 1-Person Household | 26 | 56.5% |
| 2-Person Household | 14 | 30.4% |
| 3-Person Household | 3 | 6.5% |
| 4+ Person Household | 3 | 6.5% |
| Total Housing Units | 46 | 100.0% |
Occupancy by Ownership by Household Size in Whale Pass
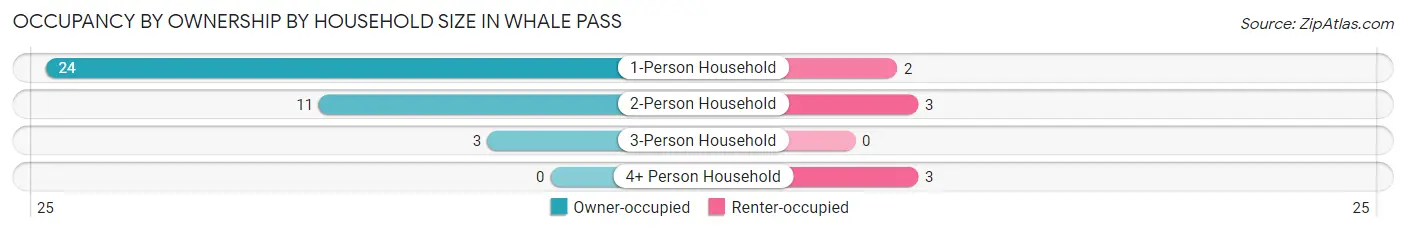
| Household Size | Owner-occupied | Renter-occupied |
| 1-Person Household | 24 (92.3%) | 2 (7.7%) |
| 2-Person Household | 11 (78.6%) | 3 (21.4%) |
| 3-Person Household | 3 (100.0%) | 0 (0.0%) |
| 4+ Person Household | 0 (0.0%) | 3 (100.0%) |
| Total Housing Units | 38 (82.6%) | 8 (17.4%) |
Occupancy by Educational Attainment in Whale Pass
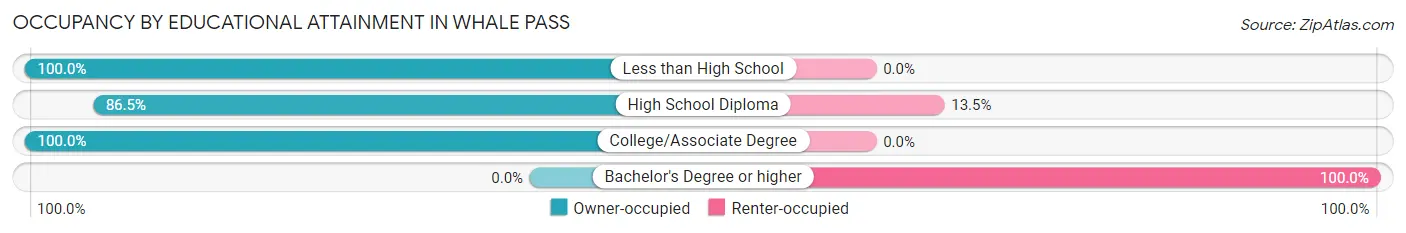
| Household Size | Owner-occupied | Renter-occupied |
| Less than High School | 3 (100.0%) | 0 (0.0%) |
| High School Diploma | 32 (86.5%) | 5 (13.5%) |
| College/Associate Degree | 3 (100.0%) | 0 (0.0%) |
| Bachelor's Degree or higher | 0 (0.0%) | 3 (100.0%) |
Occupancy by Age of Householder in Whale Pass
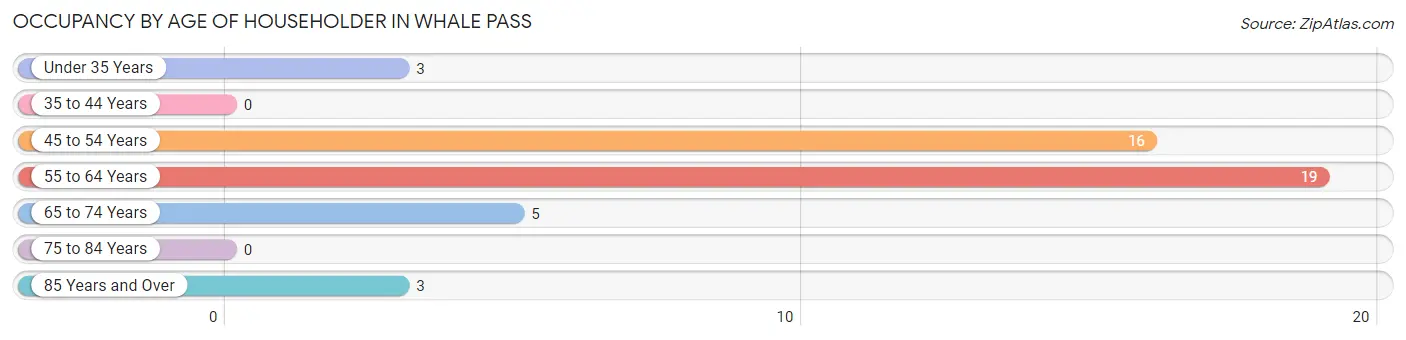
| Age Bracket | # Households | % Households |
| Under 35 Years | 3 | 6.5% |
| 35 to 44 Years | 0 | 0.0% |
| 45 to 54 Years | 16 | 34.8% |
| 55 to 64 Years | 19 | 41.3% |
| 65 to 74 Years | 5 | 10.9% |
| 75 to 84 Years | 0 | 0.0% |
| 85 Years and Over | 3 | 6.5% |
| Total | 46 | 100.0% |
Housing Finances in Whale Pass
Median Income by Occupancy in Whale Pass
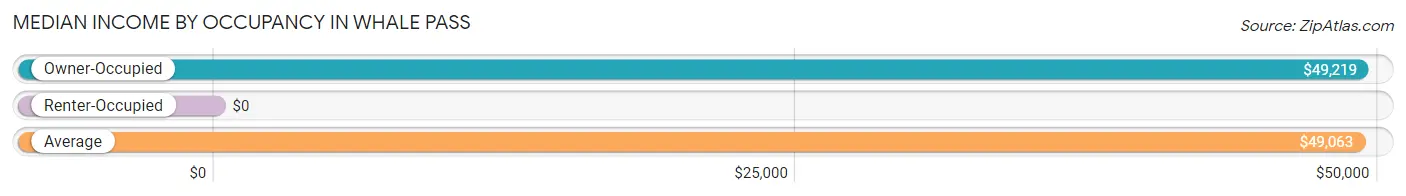
| Occupancy Type | # Households | Median Income |
| Owner-Occupied | 38 (82.6%) | $49,219 |
| Renter-Occupied | 8 (17.4%) | $0 |
| Average | 46 (100.0%) | $49,063 |
Occupancy by Householder Income Bracket in Whale Pass
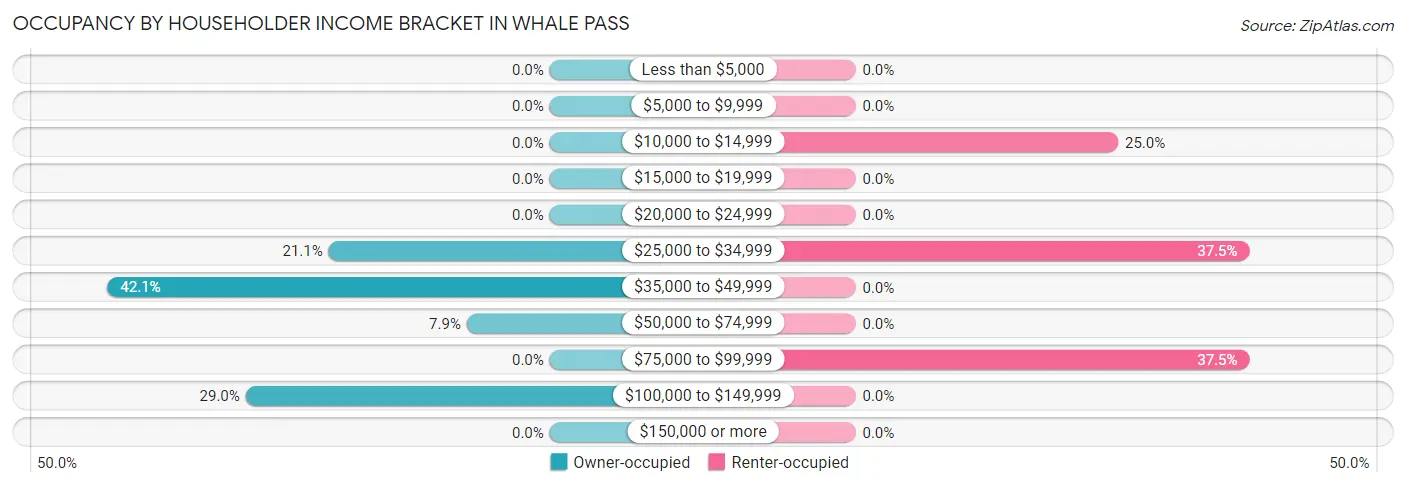
| Income Bracket | Owner-occupied | Renter-occupied |
| Less than $5,000 | 0 (0.0%) | 0 (0.0%) |
| $5,000 to $9,999 | 0 (0.0%) | 0 (0.0%) |
| $10,000 to $14,999 | 0 (0.0%) | 2 (25.0%) |
| $15,000 to $19,999 | 0 (0.0%) | 0 (0.0%) |
| $20,000 to $24,999 | 0 (0.0%) | 0 (0.0%) |
| $25,000 to $34,999 | 8 (21.0%) | 3 (37.5%) |
| $35,000 to $49,999 | 16 (42.1%) | 0 (0.0%) |
| $50,000 to $74,999 | 3 (7.9%) | 0 (0.0%) |
| $75,000 to $99,999 | 0 (0.0%) | 3 (37.5%) |
| $100,000 to $149,999 | 11 (28.9%) | 0 (0.0%) |
| $150,000 or more | 0 (0.0%) | 0 (0.0%) |
| Total | 38 (100.0%) | 8 (100.0%) |
Monthly Housing Cost Tiers in Whale Pass
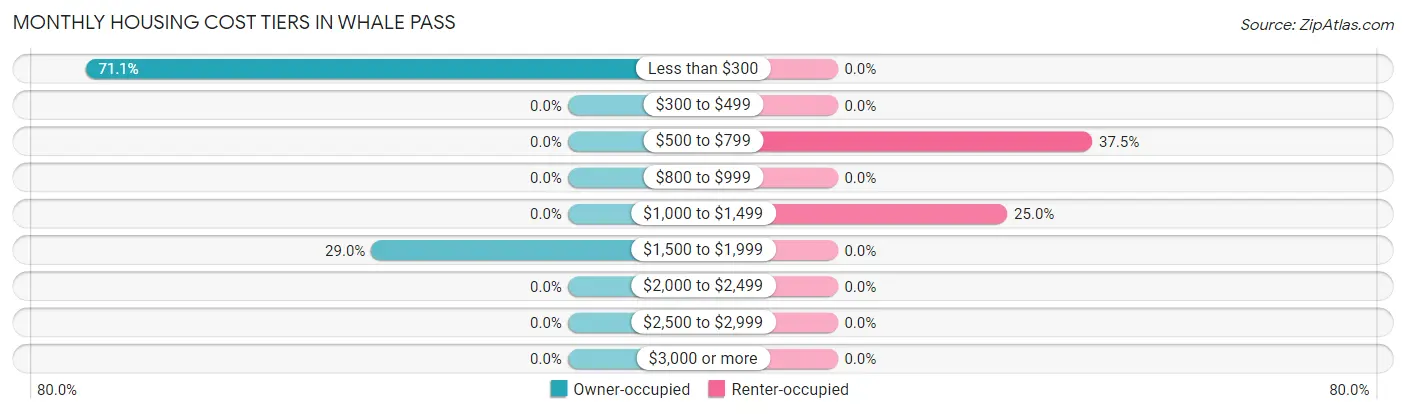
| Monthly Cost | Owner-occupied | Renter-occupied |
| Less than $300 | 27 (71.1%) | 0 (0.0%) |
| $300 to $499 | 0 (0.0%) | 0 (0.0%) |
| $500 to $799 | 0 (0.0%) | 3 (37.5%) |
| $800 to $999 | 0 (0.0%) | 0 (0.0%) |
| $1,000 to $1,499 | 0 (0.0%) | 2 (25.0%) |
| $1,500 to $1,999 | 11 (28.9%) | 0 (0.0%) |
| $2,000 to $2,499 | 0 (0.0%) | 0 (0.0%) |
| $2,500 to $2,999 | 0 (0.0%) | 0 (0.0%) |
| $3,000 or more | 0 (0.0%) | 0 (0.0%) |
| Total | 38 (100.0%) | 8 (100.0%) |
Physical Housing Characteristics in Whale Pass
Housing Structures in Whale Pass
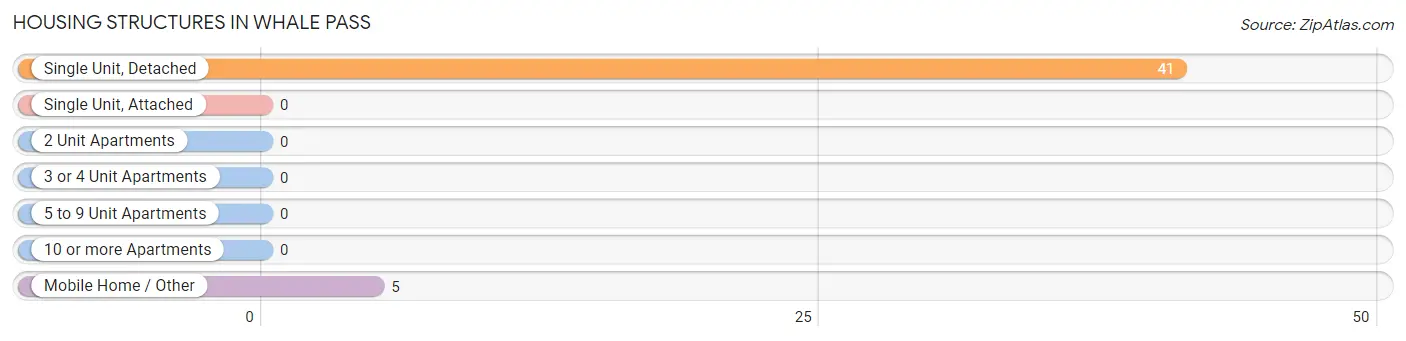
| Structure Type | # Housing Units | % Housing Units |
| Single Unit, Detached | 41 | 89.1% |
| Single Unit, Attached | 0 | 0.0% |
| 2 Unit Apartments | 0 | 0.0% |
| 3 or 4 Unit Apartments | 0 | 0.0% |
| 5 to 9 Unit Apartments | 0 | 0.0% |
| 10 or more Apartments | 0 | 0.0% |
| Mobile Home / Other | 5 | 10.9% |
| Total | 46 | 100.0% |
Housing Structures by Occupancy in Whale Pass
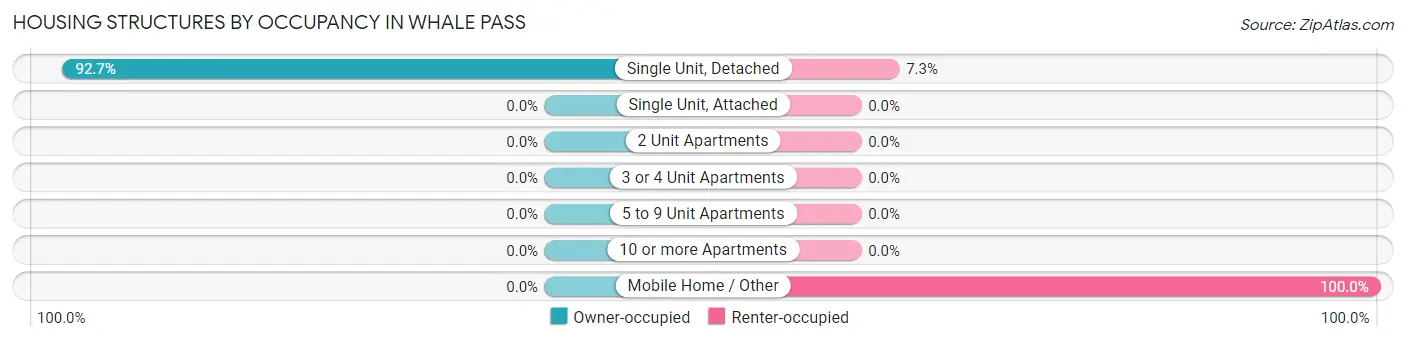
| Structure Type | Owner-occupied | Renter-occupied |
| Single Unit, Detached | 38 (92.7%) | 3 (7.3%) |
| Single Unit, Attached | 0 (0.0%) | 0 (0.0%) |
| 2 Unit Apartments | 0 (0.0%) | 0 (0.0%) |
| 3 or 4 Unit Apartments | 0 (0.0%) | 0 (0.0%) |
| 5 to 9 Unit Apartments | 0 (0.0%) | 0 (0.0%) |
| 10 or more Apartments | 0 (0.0%) | 0 (0.0%) |
| Mobile Home / Other | 0 (0.0%) | 5 (100.0%) |
| Total | 38 (82.6%) | 8 (17.4%) |
Housing Structures by Number of Rooms in Whale Pass
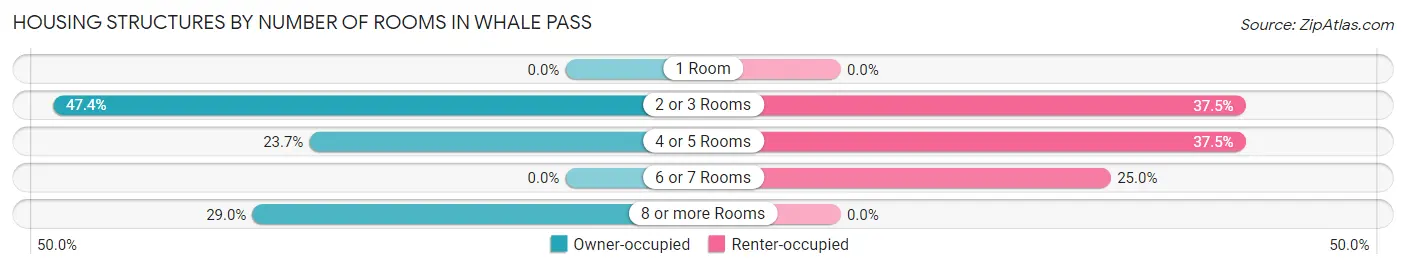
| Number of Rooms | Owner-occupied | Renter-occupied |
| 1 Room | 0 (0.0%) | 0 (0.0%) |
| 2 or 3 Rooms | 18 (47.4%) | 3 (37.5%) |
| 4 or 5 Rooms | 9 (23.7%) | 3 (37.5%) |
| 6 or 7 Rooms | 0 (0.0%) | 2 (25.0%) |
| 8 or more Rooms | 11 (28.9%) | 0 (0.0%) |
| Total | 38 (100.0%) | 8 (100.0%) |
Housing Structure by Heating Type in Whale Pass
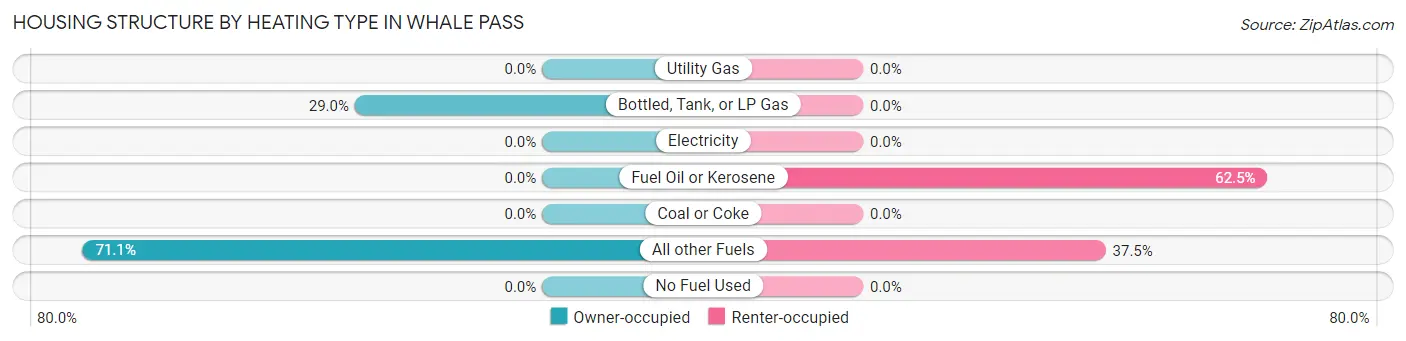
| Heating Type | Owner-occupied | Renter-occupied |
| Utility Gas | 0 (0.0%) | 0 (0.0%) |
| Bottled, Tank, or LP Gas | 11 (28.9%) | 0 (0.0%) |
| Electricity | 0 (0.0%) | 0 (0.0%) |
| Fuel Oil or Kerosene | 0 (0.0%) | 5 (62.5%) |
| Coal or Coke | 0 (0.0%) | 0 (0.0%) |
| All other Fuels | 27 (71.1%) | 3 (37.5%) |
| No Fuel Used | 0 (0.0%) | 0 (0.0%) |
| Total | 38 (100.0%) | 8 (100.0%) |
Household Vehicle Usage in Whale Pass
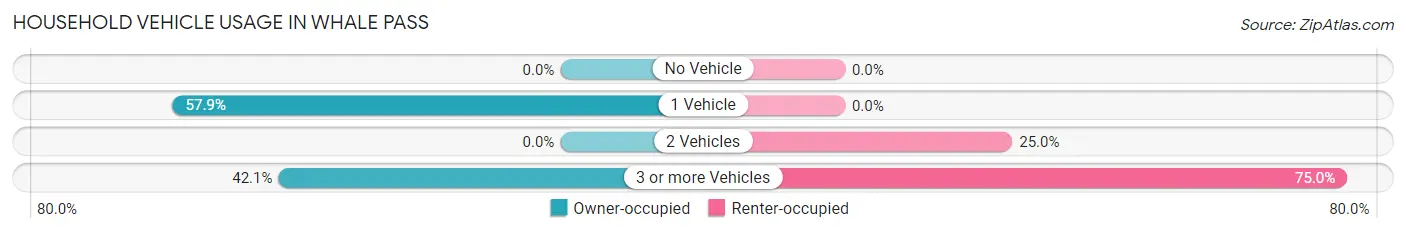
| Vehicles per Household | Owner-occupied | Renter-occupied |
| No Vehicle | 0 (0.0%) | 0 (0.0%) |
| 1 Vehicle | 22 (57.9%) | 0 (0.0%) |
| 2 Vehicles | 0 (0.0%) | 2 (25.0%) |
| 3 or more Vehicles | 16 (42.1%) | 6 (75.0%) |
| Total | 38 (100.0%) | 8 (100.0%) |
Real Estate & Mortgages in Whale Pass
Real Estate and Mortgage Overview in Whale Pass
| Characteristic | Without Mortgage | With Mortgage |
| Housing Units | 38 | 0 |
| Median Property Value | - | - |
| Median Household Income | $49,219 | $0 |
| Monthly Housing Costs | - | - |
| Real Estate Taxes | - | - |
Property Value by Mortgage Status in Whale Pass
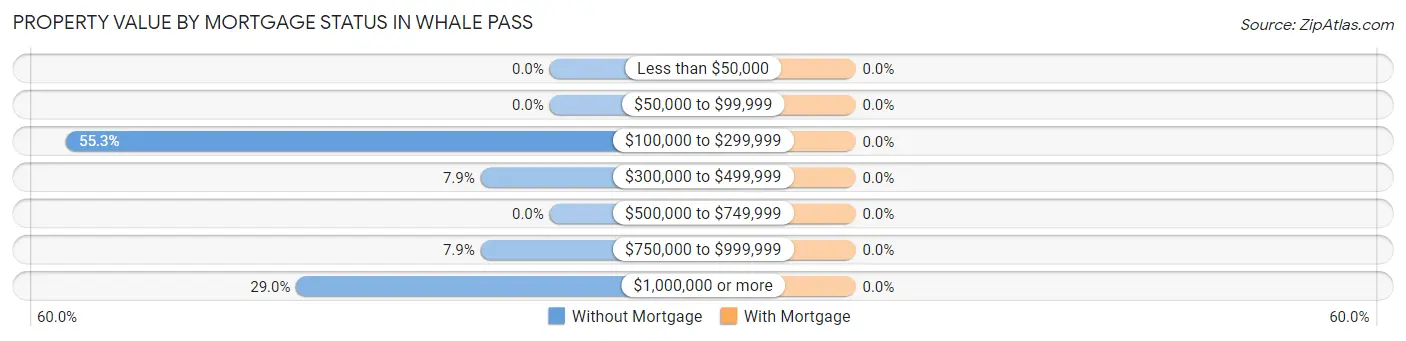
| Property Value | Without Mortgage | With Mortgage |
| Less than $50,000 | 0 (0.0%) | 0 (0.0%) |
| $50,000 to $99,999 | 0 (0.0%) | 0 (0.0%) |
| $100,000 to $299,999 | 21 (55.3%) | 0 (0.0%) |
| $300,000 to $499,999 | 3 (7.9%) | 0 (0.0%) |
| $500,000 to $749,999 | 0 (0.0%) | 0 (0.0%) |
| $750,000 to $999,999 | 3 (7.9%) | 0 (0.0%) |
| $1,000,000 or more | 11 (28.9%) | 0 (0.0%) |
| Total | 38 (100.0%) | 0 (0.0%) |
Household Income by Mortgage Status in Whale Pass
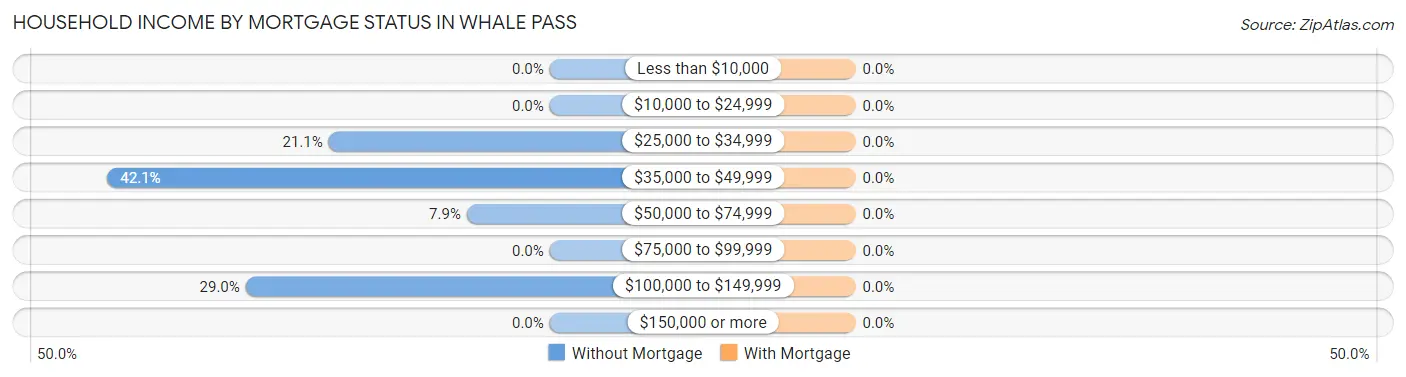
| Household Income | Without Mortgage | With Mortgage |
| Less than $10,000 | 0 (0.0%) | 0 (0.0%) |
| $10,000 to $24,999 | 0 (0.0%) | 0 (0.0%) |
| $25,000 to $34,999 | 8 (21.0%) | 0 (0.0%) |
| $35,000 to $49,999 | 16 (42.1%) | 0 (0.0%) |
| $50,000 to $74,999 | 3 (7.9%) | 0 (0.0%) |
| $75,000 to $99,999 | 0 (0.0%) | 0 (0.0%) |
| $100,000 to $149,999 | 11 (28.9%) | 0 (0.0%) |
| $150,000 or more | 0 (0.0%) | 0 (0.0%) |
| Total | 38 (100.0%) | 0 (0.0%) |
Property Value to Household Income Ratio in Whale Pass
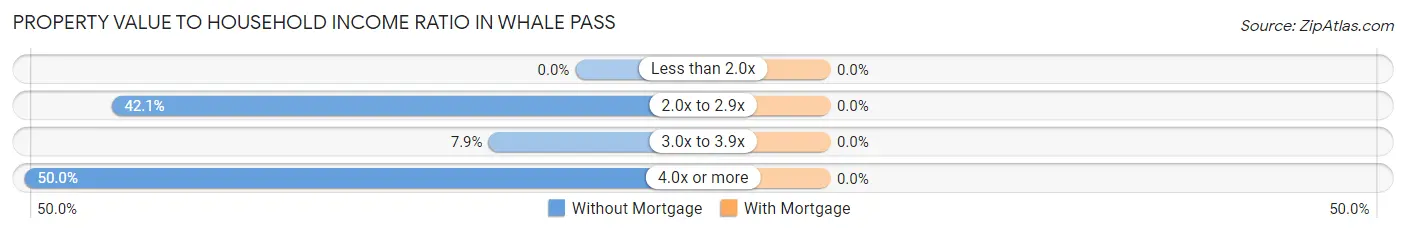
| Value-to-Income Ratio | Without Mortgage | With Mortgage |
| Less than 2.0x | 0 (0.0%) | 0 (0.0%) |
| 2.0x to 2.9x | 16 (42.1%) | 0 (0.0%) |
| 3.0x to 3.9x | 3 (7.9%) | 0 (0.0%) |
| 4.0x or more | 19 (50.0%) | 0 (0.0%) |
| Total | 38 (100.0%) | 0 (0.0%) |
Real Estate Taxes by Mortgage Status in Whale Pass
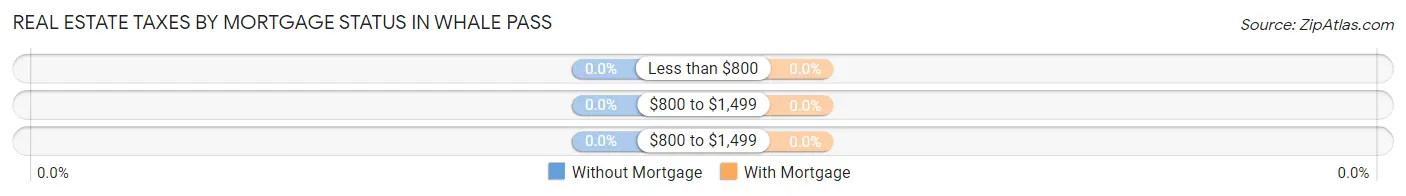
| Property Taxes | Without Mortgage | With Mortgage |
| Less than $800 | 0 (0.0%) | 0 (0.0%) |
| $800 to $1,499 | 0 (0.0%) | 0 (0.0%) |
| $800 to $1,499 | 0 (0.0%) | 0 (0.0%) |
| Total | 38 (100.0%) | 0 (0.0%) |
Health & Disability in Whale Pass
Health Insurance Coverage by Age in Whale Pass
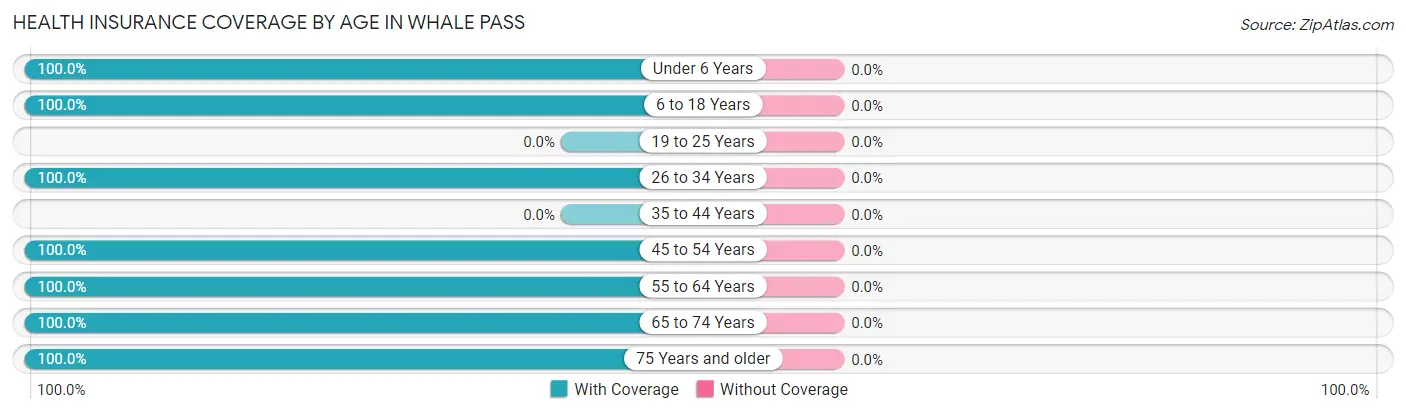
| Age Bracket | With Coverage | Without Coverage |
| Under 6 Years | 2 (100.0%) | 0 (0.0%) |
| 6 to 18 Years | 10 (100.0%) | 0 (0.0%) |
| 19 to 25 Years | 0 (0.0%) | 0 (0.0%) |
| 26 to 34 Years | 5 (100.0%) | 0 (0.0%) |
| 35 to 44 Years | 0 (0.0%) | 0 (0.0%) |
| 45 to 54 Years | 16 (100.0%) | 0 (0.0%) |
| 55 to 64 Years | 34 (100.0%) | 0 (0.0%) |
| 65 to 74 Years | 5 (100.0%) | 0 (0.0%) |
| 75 Years and older | 26 (100.0%) | 0 (0.0%) |
| Total | 98 (100.0%) | 0 (0.0%) |
Health Insurance Coverage by Citizenship Status in Whale Pass
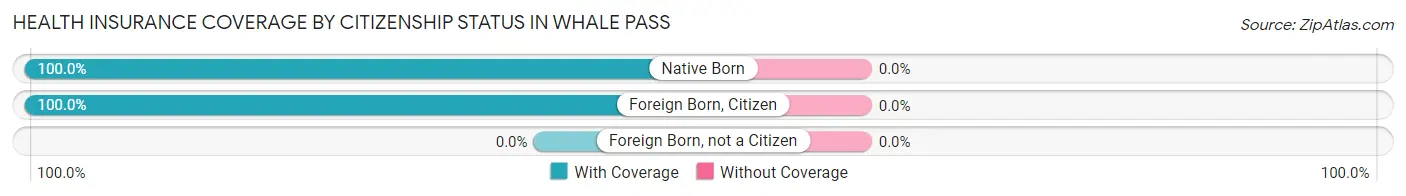
| Citizenship Status | With Coverage | Without Coverage |
| Native Born | 2 (100.0%) | 0 (0.0%) |
| Foreign Born, Citizen | 10 (100.0%) | 0 (0.0%) |
| Foreign Born, not a Citizen | 0 (0.0%) | 0 (0.0%) |
Health Insurance Coverage by Household Income in Whale Pass
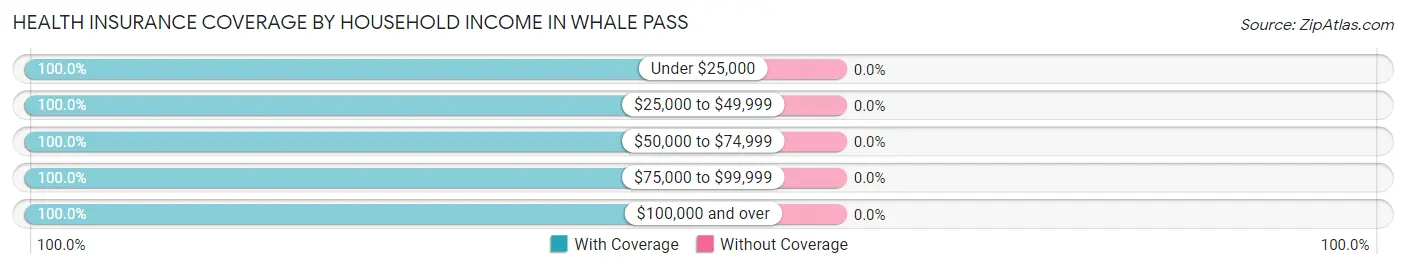
| Household Income | With Coverage | Without Coverage |
| Under $25,000 | 2 (100.0%) | 0 (0.0%) |
| $25,000 to $49,999 | 41 (100.0%) | 0 (0.0%) |
| $50,000 to $74,999 | 26 (100.0%) | 0 (0.0%) |
| $75,000 to $99,999 | 5 (100.0%) | 0 (0.0%) |
| $100,000 and over | 24 (100.0%) | 0 (0.0%) |
Public vs Private Health Insurance Coverage by Age in Whale Pass
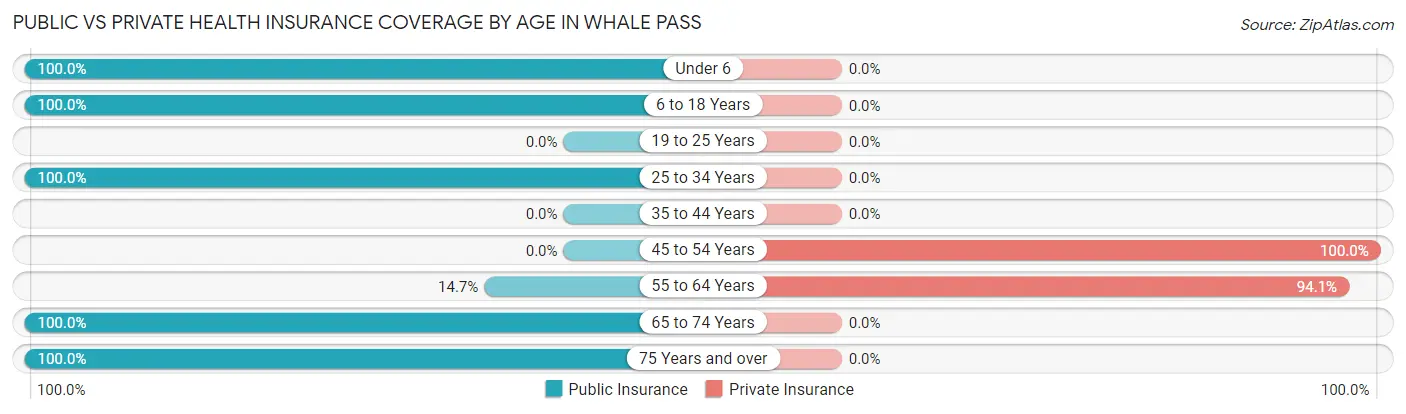
| Age Bracket | Public Insurance | Private Insurance |
| Under 6 | 2 (100.0%) | 0 (0.0%) |
| 6 to 18 Years | 10 (100.0%) | 0 (0.0%) |
| 19 to 25 Years | 0 (0.0%) | 0 (0.0%) |
| 25 to 34 Years | 5 (100.0%) | 0 (0.0%) |
| 35 to 44 Years | 0 (0.0%) | 0 (0.0%) |
| 45 to 54 Years | 0 (0.0%) | 16 (100.0%) |
| 55 to 64 Years | 5 (14.7%) | 32 (94.1%) |
| 65 to 74 Years | 5 (100.0%) | 0 (0.0%) |
| 75 Years and over | 26 (100.0%) | 0 (0.0%) |
| Total | 53 (54.1%) | 48 (49.0%) |
Disability Status by Sex by Age in Whale Pass
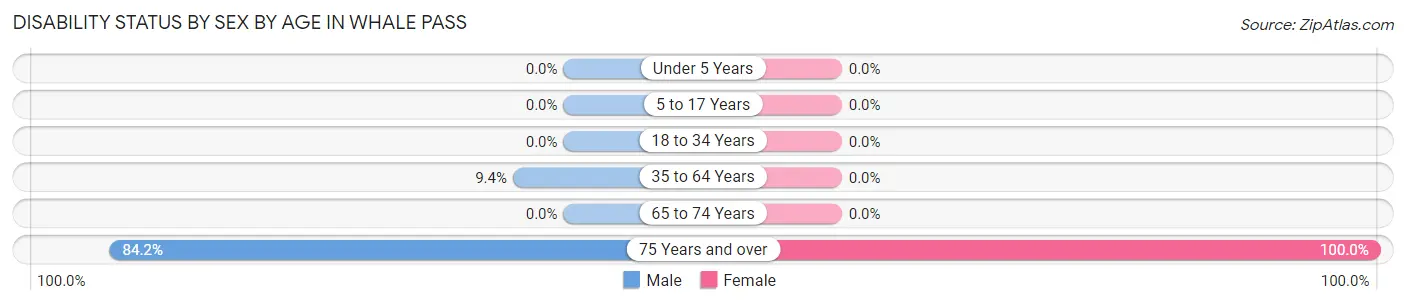
| Age Bracket | Male | Female |
| Under 5 Years | 0 (0.0%) | 0 (0.0%) |
| 5 to 17 Years | 0 (0.0%) | 0 (0.0%) |
| 18 to 34 Years | 0 (0.0%) | 0 (0.0%) |
| 35 to 64 Years | 3 (9.4%) | 0 (0.0%) |
| 65 to 74 Years | 0 (0.0%) | 0 (0.0%) |
| 75 Years and over | 16 (84.2%) | 7 (100.0%) |
Disability Class by Sex by Age in Whale Pass
Disability Class: Hearing Difficulty
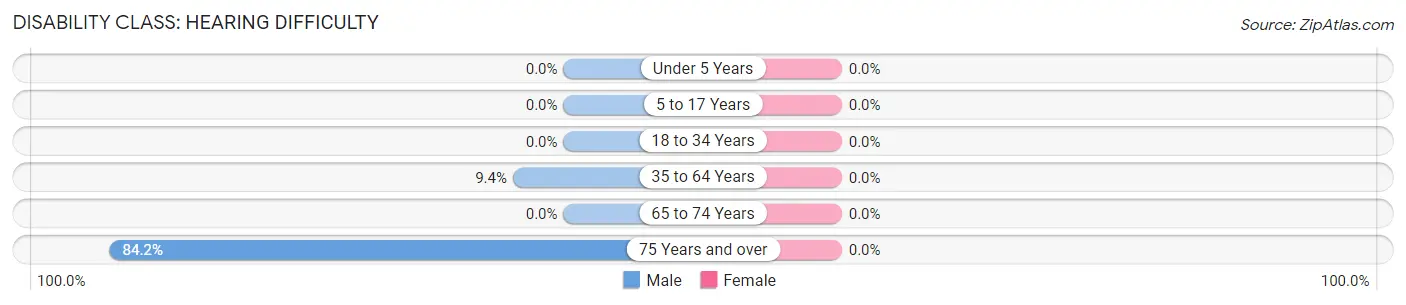
| Age Bracket | Male | Female |
| Under 5 Years | 0 (0.0%) | 0 (0.0%) |
| 5 to 17 Years | 0 (0.0%) | 0 (0.0%) |
| 18 to 34 Years | 0 (0.0%) | 0 (0.0%) |
| 35 to 64 Years | 3 (9.4%) | 0 (0.0%) |
| 65 to 74 Years | 0 (0.0%) | 0 (0.0%) |
| 75 Years and over | 16 (84.2%) | 0 (0.0%) |
Disability Class: Vision Difficulty
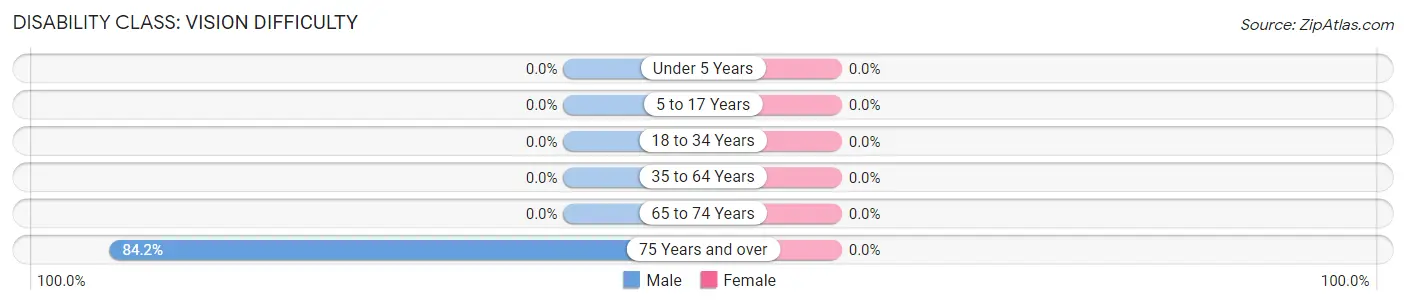
| Age Bracket | Male | Female |
| Under 5 Years | 0 (0.0%) | 0 (0.0%) |
| 5 to 17 Years | 0 (0.0%) | 0 (0.0%) |
| 18 to 34 Years | 0 (0.0%) | 0 (0.0%) |
| 35 to 64 Years | 0 (0.0%) | 0 (0.0%) |
| 65 to 74 Years | 0 (0.0%) | 0 (0.0%) |
| 75 Years and over | 16 (84.2%) | 0 (0.0%) |
Disability Class: Cognitive Difficulty
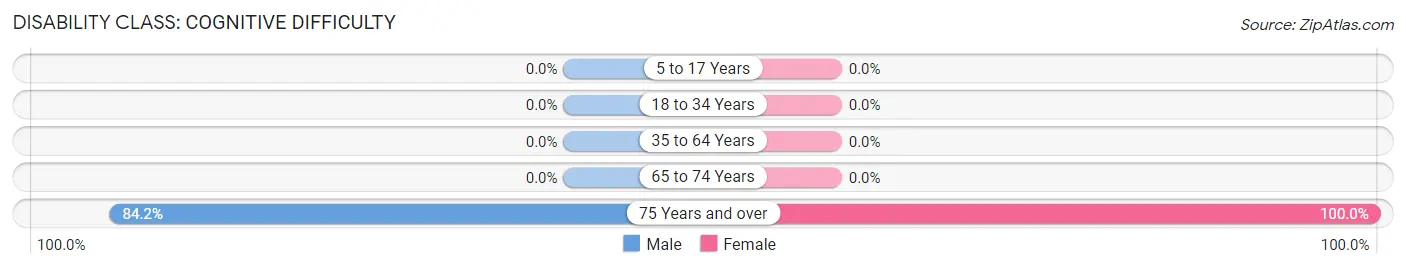
| Age Bracket | Male | Female |
| 5 to 17 Years | 0 (0.0%) | 0 (0.0%) |
| 18 to 34 Years | 0 (0.0%) | 0 (0.0%) |
| 35 to 64 Years | 0 (0.0%) | 0 (0.0%) |
| 65 to 74 Years | 0 (0.0%) | 0 (0.0%) |
| 75 Years and over | 16 (84.2%) | 7 (100.0%) |
Disability Class: Ambulatory Difficulty
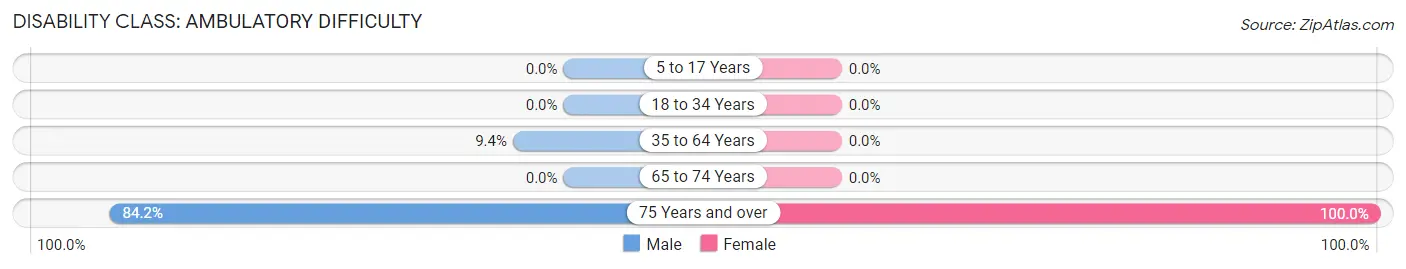
| Age Bracket | Male | Female |
| 5 to 17 Years | 0 (0.0%) | 0 (0.0%) |
| 18 to 34 Years | 0 (0.0%) | 0 (0.0%) |
| 35 to 64 Years | 3 (9.4%) | 0 (0.0%) |
| 65 to 74 Years | 0 (0.0%) | 0 (0.0%) |
| 75 Years and over | 16 (84.2%) | 7 (100.0%) |
Disability Class: Self-Care Difficulty
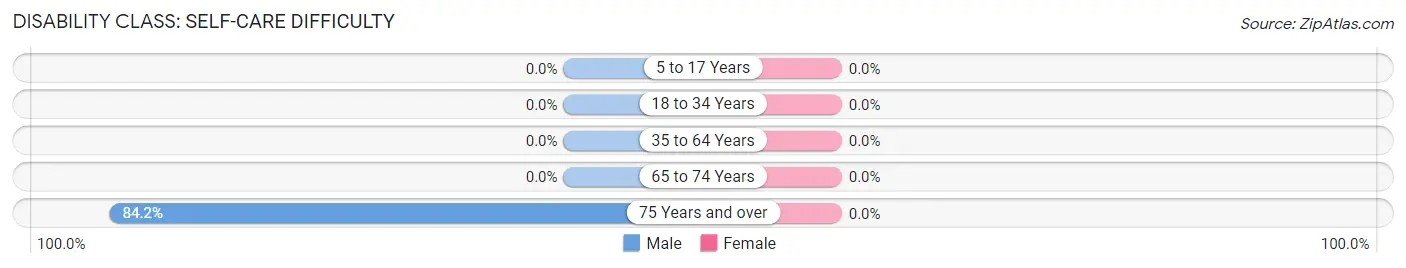
| Age Bracket | Male | Female |
| 5 to 17 Years | 0 (0.0%) | 0 (0.0%) |
| 18 to 34 Years | 0 (0.0%) | 0 (0.0%) |
| 35 to 64 Years | 0 (0.0%) | 0 (0.0%) |
| 65 to 74 Years | 0 (0.0%) | 0 (0.0%) |
| 75 Years and over | 16 (84.2%) | 0 (0.0%) |
Technology Access in Whale Pass
Computing Device Access in Whale Pass
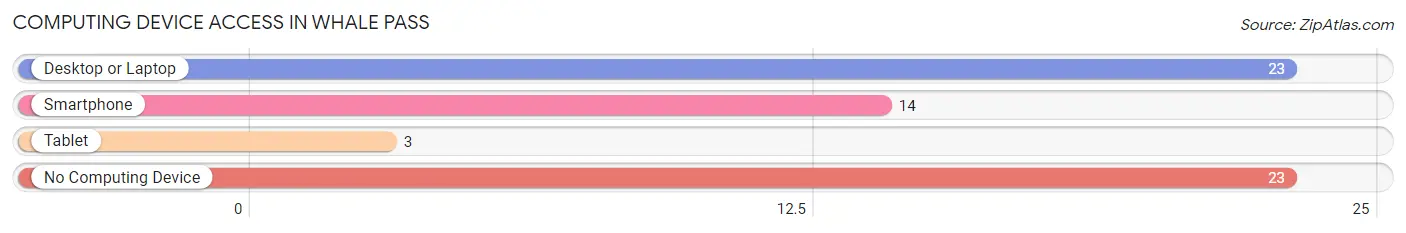
| Device Type | # Households | % Households |
| Desktop or Laptop | 23 | 50.0% |
| Smartphone | 14 | 30.4% |
| Tablet | 3 | 6.5% |
| No Computing Device | 23 | 50.0% |
| Total | 46 | 100.0% |
Internet Access in Whale Pass
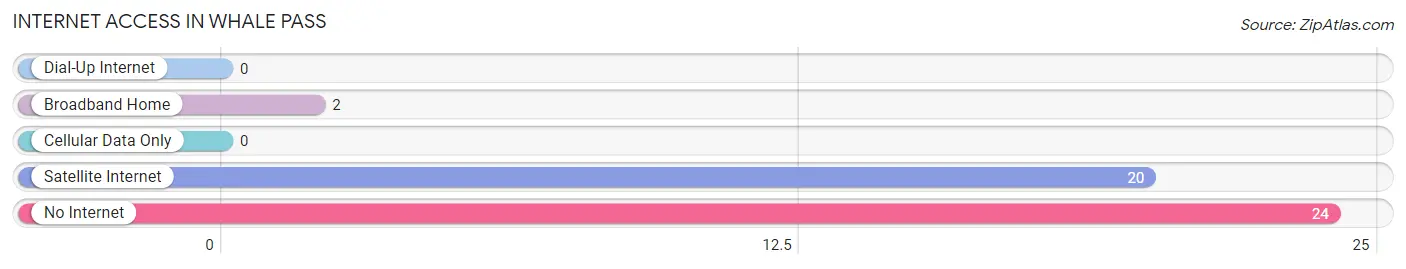
| Internet Type | # Households | % Households |
| Dial-Up Internet | 0 | 0.0% |
| Broadband Home | 2 | 4.3% |
| Cellular Data Only | 0 | 0.0% |
| Satellite Internet | 20 | 43.5% |
| No Internet | 24 | 52.2% |
| Total | 46 | 100.0% |
Whale Pass Summary
Whale Pass is a small unincorporated community located in the Prince of Wales-Hyder Census Area of the U.S. state of Alaska. It is located on the east side of Prince of Wales Island, approximately 40 miles (64 km) southeast of Ketchikan. The community is accessible by air and by boat.
History
Whale Pass was first settled in the late 1800s by the Tlingit people, who used the area for fishing and hunting. The first non-Native settlers arrived in the early 1900s, and the community was officially established in the 1920s. The community was named after the nearby Whale Pass, which was used by the Tlingit people to travel between Prince of Wales Island and the mainland.
Geography
Whale Pass is located on the east side of Prince of Wales Island, approximately 40 miles (64 km) southeast of Ketchikan. The community is situated on the shore of Whale Pass, a narrow strait that separates the island from the mainland. The area is surrounded by dense forest and is home to a variety of wildlife, including deer, bears, and eagles.
Economy
The economy of Whale Pass is largely based on fishing and logging. The community is home to several commercial fishing operations, and the surrounding waters are rich in salmon, halibut, and other fish species. Logging is also an important industry in the area, and the nearby forests are home to a variety of timber species.
Demographics
As of the 2010 census, the population of Whale Pass was estimated to be around 200 people. The majority of the population is Native American, with the Tlingit people making up the largest ethnic group. The median household income in Whale Pass is around $30,000, and the median age is around 40 years old. The community is served by a small post office and a volunteer fire department.
Common Questions
What is Per Capita Income in Whale Pass?
Per Capita income in Whale Pass is $32,737.
What is the Median Family Income in Whale Pass?
Median Family Income in Whale Pass is $117,727.
What is the Median Household income in Whale Pass?
Median Household Income in Whale Pass is $49,063.
What is Income or Wage Gap in Whale Pass?
Income or Wage Gap in Whale Pass is 15.0%.
Women in Whale Pass earn 85.0 cents for every dollar earned by a man.
What is Inequality or Gini Index in Whale Pass?
Inequality or Gini Index in Whale Pass is 0.30.
What is the Total Population of Whale Pass?
Total Population of Whale Pass is 98.
What is the Total Male Population of Whale Pass?
Total Male Population of Whale Pass is 63.
What is the Total Female Population of Whale Pass?
Total Female Population of Whale Pass is 35.
What is the Ratio of Males per 100 Females in Whale Pass?
There are 180.00 Males per 100 Females in Whale Pass.
What is the Ratio of Females per 100 Males in Whale Pass?
There are 55.56 Females per 100 Males in Whale Pass.
What is the Median Population Age in Whale Pass?
Median Population Age in Whale Pass is 63.1 Years.
What is the Average Family Size in Whale Pass
Average Family Size in Whale Pass is 3.6 People.
What is the Average Household Size in Whale Pass
Average Household Size in Whale Pass is 2.1 People.
How Large is the Labor Force in Whale Pass?
There are 51 People in the Labor Forcein in Whale Pass.
What is the Percentage of People in the Labor Force in Whale Pass?
59.3% of People are in the Labor Force in Whale Pass.
What is the Unemployment Rate in Whale Pass?
Unemployment Rate in Whale Pass is 5.9%.