Port Huron, MI Map & Demographics
Port Huron Map
Port Huron Overview
$27,273
PER CAPITA INCOME
$56,030
AVG FAMILY INCOME
$47,906
AVG HOUSEHOLD INCOME
31.3%
WAGE / INCOME GAP [ % ]
68.7¢/ $1
WAGE / INCOME GAP [ $ ]
$12,291
FAMILY INCOME DEFICIT
0.45
INEQUALITY / GINI INDEX
28,881
TOTAL POPULATION
14,124
MALE POPULATION
14,757
FEMALE POPULATION
95.71
MALES / 100 FEMALES
104.48
FEMALES / 100 MALES
39.0
MEDIAN AGE
2.9
AVG FAMILY SIZE
2.3
AVG HOUSEHOLD SIZE
13,783
LABOR FORCE [ PEOPLE ]
58.9%
PERCENT IN LABOR FORCE
9.3%
UNEMPLOYMENT RATE
Port Huron Zip Codes
Port Huron Area Codes
Income in Port Huron
Income Overview in Port Huron
Per Capita Income in Port Huron is $27,273, while median incomes of families and households are $56,030 and $47,906 respectively.
| Characteristic | Number | Measure |
| Per Capita Income | 28,881 | $27,273 |
| Median Family Income | 7,315 | $56,030 |
| Mean Family Income | 7,315 | $74,059 |
| Median Household Income | 12,325 | $47,906 |
| Mean Household Income | 12,325 | $63,344 |
| Income Deficit | 7,315 | $12,291 |
| Wage / Income Gap (%) | 28,881 | 31.28% |
| Wage / Income Gap ($) | 28,881 | 68.72¢ per $1 |
| Gini / Inequality Index | 28,881 | 0.45 |
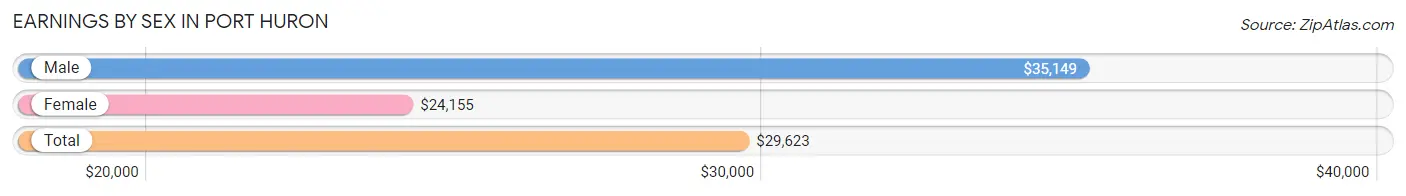
Earnings by Sex in Port Huron
Average Earnings in Port Huron are $29,623, $35,149 for men and $24,155 for women, a difference of 31.3%.
| Sex | Number | Average Earnings |
| Male | 7,166 (50.3%) | $35,149 |
| Female | 7,069 (49.7%) | $24,155 |
| Total | 14,235 (100.0%) | $29,623 |
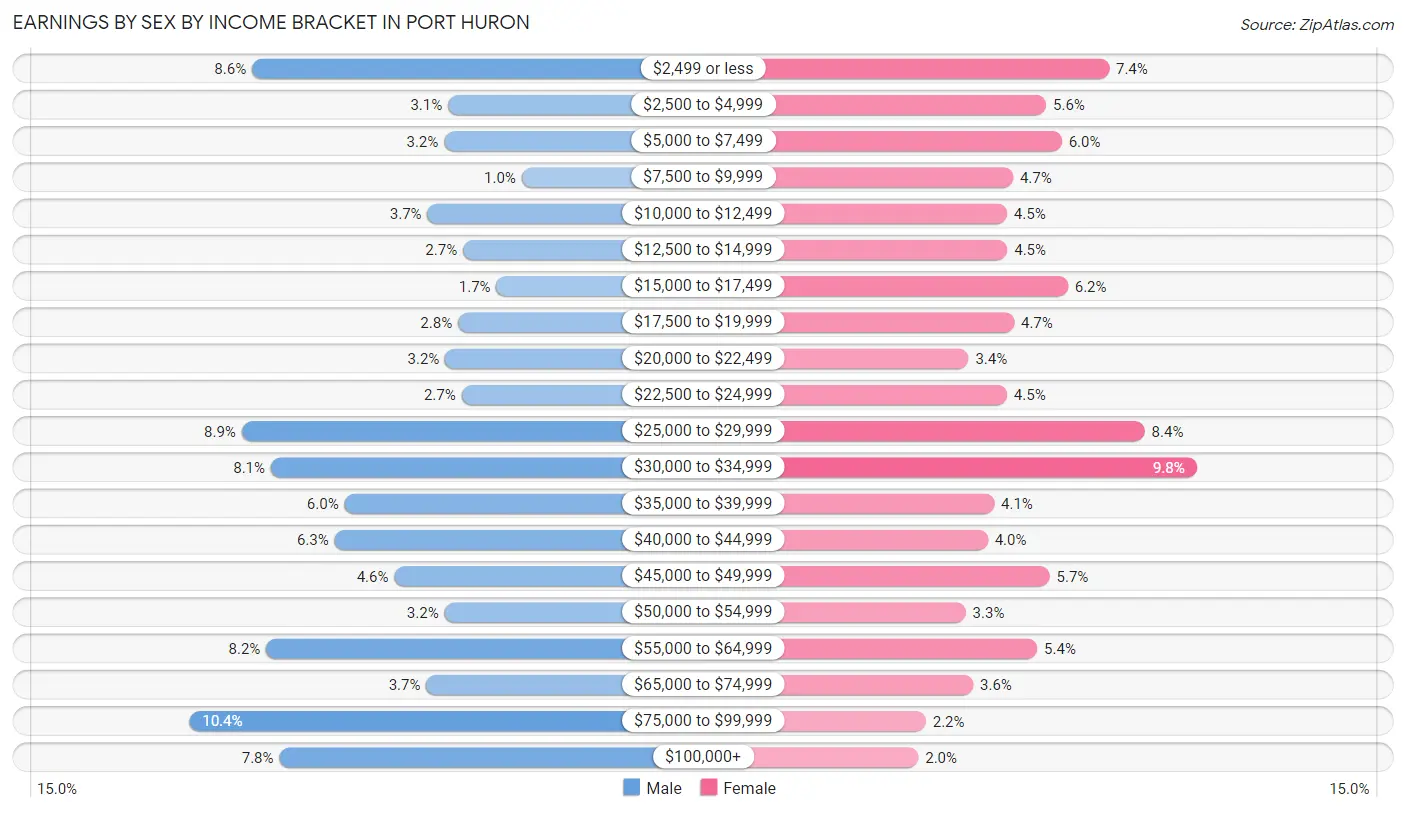
Earnings by Sex by Income Bracket in Port Huron
The most common earnings brackets in Port Huron are $75,000 to $99,999 for men (743 | 10.4%) and $30,000 to $34,999 for women (695 | 9.8%).
| Income | Male | Female |
| $2,499 or less | 617 (8.6%) | 521 (7.4%) |
| $2,500 to $4,999 | 222 (3.1%) | 396 (5.6%) |
| $5,000 to $7,499 | 230 (3.2%) | 427 (6.0%) |
| $7,500 to $9,999 | 74 (1.0%) | 330 (4.7%) |
| $10,000 to $12,499 | 264 (3.7%) | 318 (4.5%) |
| $12,500 to $14,999 | 192 (2.7%) | 319 (4.5%) |
| $15,000 to $17,499 | 125 (1.7%) | 439 (6.2%) |
| $17,500 to $19,999 | 202 (2.8%) | 332 (4.7%) |
| $20,000 to $22,499 | 228 (3.2%) | 242 (3.4%) |
| $22,500 to $24,999 | 195 (2.7%) | 318 (4.5%) |
| $25,000 to $29,999 | 638 (8.9%) | 592 (8.4%) |
| $30,000 to $34,999 | 579 (8.1%) | 695 (9.8%) |
| $35,000 to $39,999 | 431 (6.0%) | 293 (4.1%) |
| $40,000 to $44,999 | 451 (6.3%) | 280 (4.0%) |
| $45,000 to $49,999 | 330 (4.6%) | 403 (5.7%) |
| $50,000 to $54,999 | 229 (3.2%) | 236 (3.3%) |
| $55,000 to $64,999 | 588 (8.2%) | 378 (5.3%) |
| $65,000 to $74,999 | 266 (3.7%) | 251 (3.5%) |
| $75,000 to $99,999 | 743 (10.4%) | 157 (2.2%) |
| $100,000+ | 562 (7.8%) | 142 (2.0%) |
| Total | 7,166 (100.0%) | 7,069 (100.0%) |
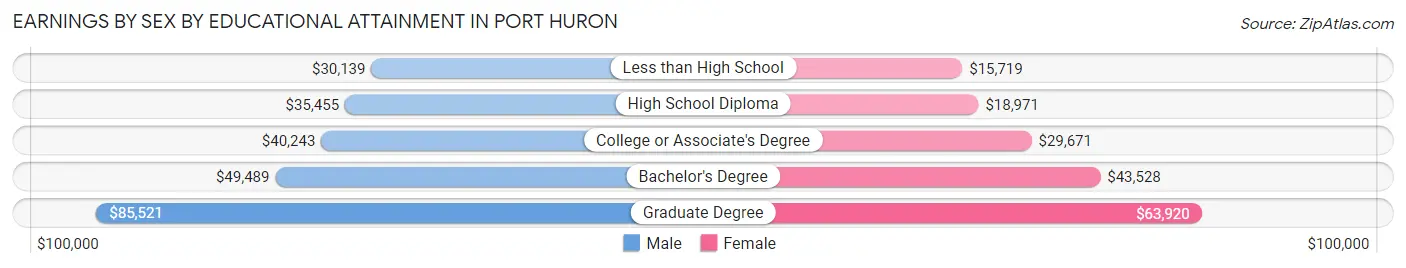
Earnings by Sex by Educational Attainment in Port Huron
Average earnings in Port Huron are $40,368 for men and $27,703 for women, a difference of 31.4%. Men with an educational attainment of graduate degree enjoy the highest average annual earnings of $85,521, while those with less than high school education earn the least with $30,139. Women with an educational attainment of graduate degree earn the most with the average annual earnings of $63,920, while those with less than high school education have the smallest earnings of $15,719.
| Educational Attainment | Male Income | Female Income |
| Less than High School | $30,139 | $15,719 |
| High School Diploma | $35,455 | $18,971 |
| College or Associate's Degree | $40,243 | $29,671 |
| Bachelor's Degree | $49,489 | $43,528 |
| Graduate Degree | $85,521 | $63,920 |
| Total | $40,368 | $27,703 |
Family Income in Port Huron
Family Income Brackets in Port Huron
According to the Port Huron family income data, there are 1,119 families falling into the $50,000 to $74,999 income range, which is the most common income bracket and makes up 15.3% of all families. Conversely, the $10,000 to $14,999 income bracket is the least frequent group with only 395 families (5.4%) belonging to this category.
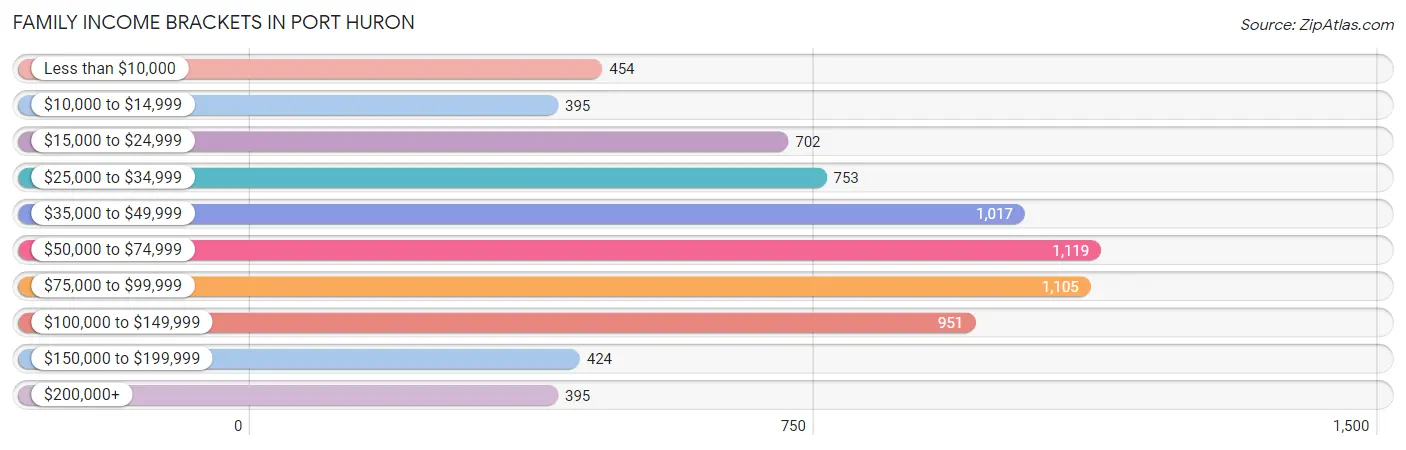
| Income Bracket | # Families | % Families |
| Less than $10,000 | 454 | 6.2% |
| $10,000 to $14,999 | 395 | 5.4% |
| $15,000 to $24,999 | 702 | 9.6% |
| $25,000 to $34,999 | 753 | 10.3% |
| $35,000 to $49,999 | 1,017 | 13.9% |
| $50,000 to $74,999 | 1,119 | 15.3% |
| $75,000 to $99,999 | 1,105 | 15.1% |
| $100,000 to $149,999 | 951 | 13.0% |
| $150,000 to $199,999 | 424 | 5.8% |
| $200,000+ | 395 | 5.4% |
Family Income by Famaliy Size in Port Huron
7+ person families (112 | 1.5%) account for the highest median family income in Port Huron with $140,769 per family, while 2-person families (3,717 | 50.8%) have the highest median income of $27,847 per family member.
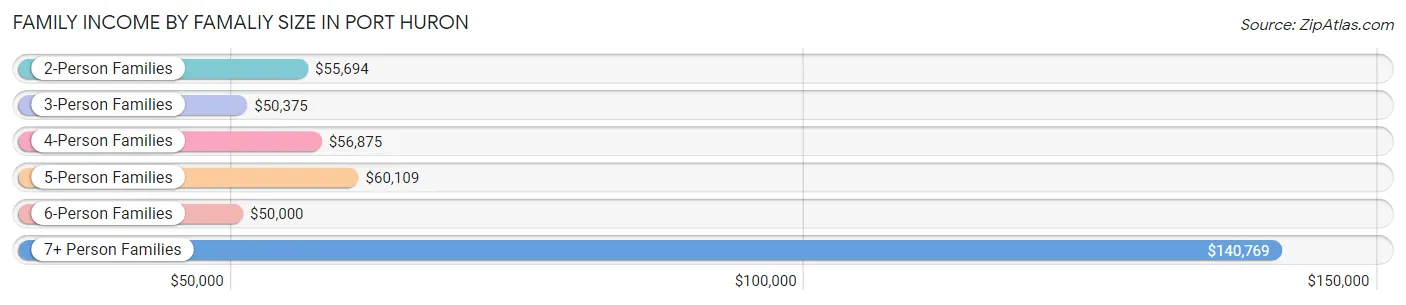
| Income Bracket | # Families | Median Income |
| 2-Person Families | 3,717 (50.8%) | $55,694 |
| 3-Person Families | 1,835 (25.1%) | $50,375 |
| 4-Person Families | 893 (12.2%) | $56,875 |
| 5-Person Families | 586 (8.0%) | $60,109 |
| 6-Person Families | 172 (2.4%) | $50,000 |
| 7+ Person Families | 112 (1.5%) | $140,769 |
| Total | 7,315 (100.0%) | $56,030 |
Family Income by Number of Earners in Port Huron
The median family income in Port Huron is $56,030, with families comprising 3+ earners (727) having the highest median family income of $135,809, while families with 1 earner (2,592) have the lowest median family income of $35,143, accounting for 9.9% and 35.4% of families, respectively.
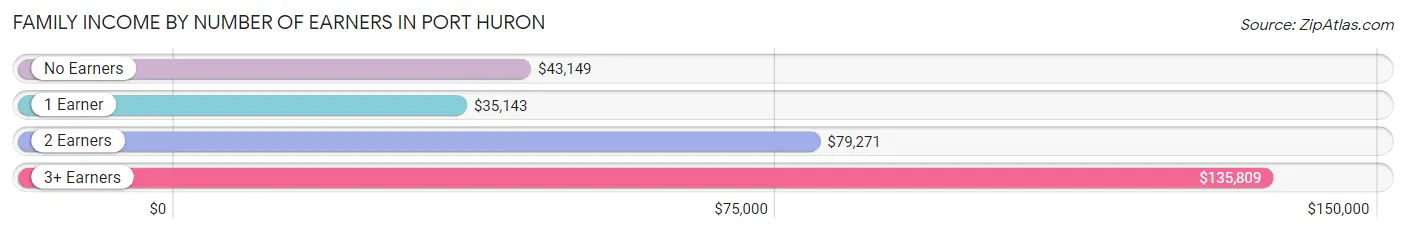
| Number of Earners | # Families | Median Income |
| No Earners | 1,562 (21.3%) | $43,149 |
| 1 Earner | 2,592 (35.4%) | $35,143 |
| 2 Earners | 2,434 (33.3%) | $79,271 |
| 3+ Earners | 727 (9.9%) | $135,809 |
| Total | 7,315 (100.0%) | $56,030 |
Household Income in Port Huron
Household Income Brackets in Port Huron
With 2,009 households falling in the category, the $50,000 to $74,999 income range is the most frequent in Port Huron, accounting for 16.3% of all households. In contrast, only 456 households (3.7%) fall into the $200,000+ income bracket, making it the least populous group.
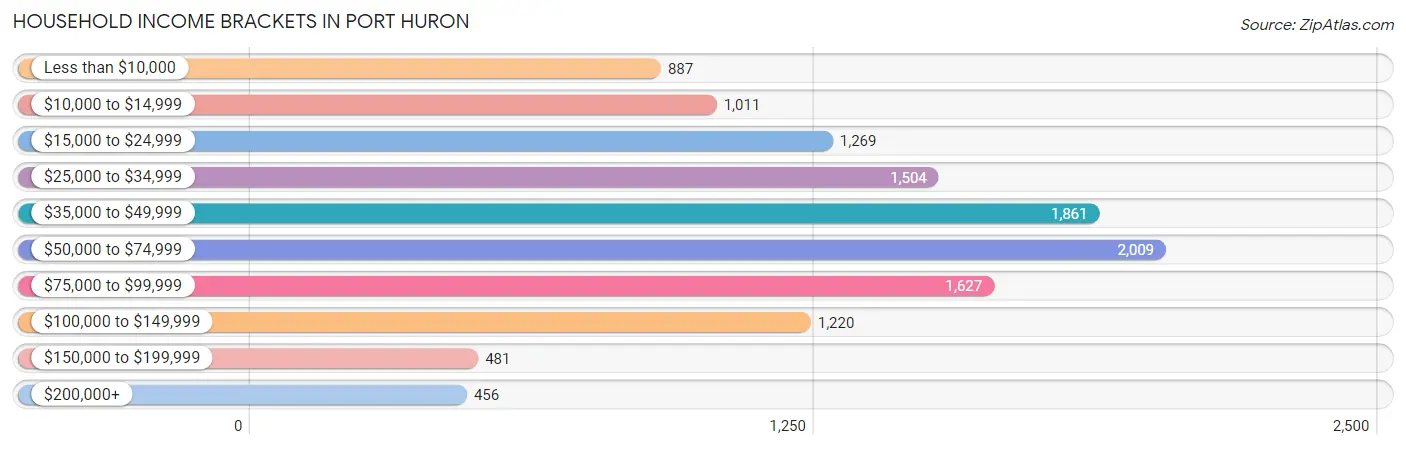
| Income Bracket | # Households | % Households |
| Less than $10,000 | 887 | 7.2% |
| $10,000 to $14,999 | 1,011 | 8.2% |
| $15,000 to $24,999 | 1,269 | 10.3% |
| $25,000 to $34,999 | 1,504 | 12.2% |
| $35,000 to $49,999 | 1,861 | 15.1% |
| $50,000 to $74,999 | 2,009 | 16.3% |
| $75,000 to $99,999 | 1,627 | 13.2% |
| $100,000 to $149,999 | 1,220 | 9.9% |
| $150,000 to $199,999 | 481 | 3.9% |
| $200,000+ | 456 | 3.7% |
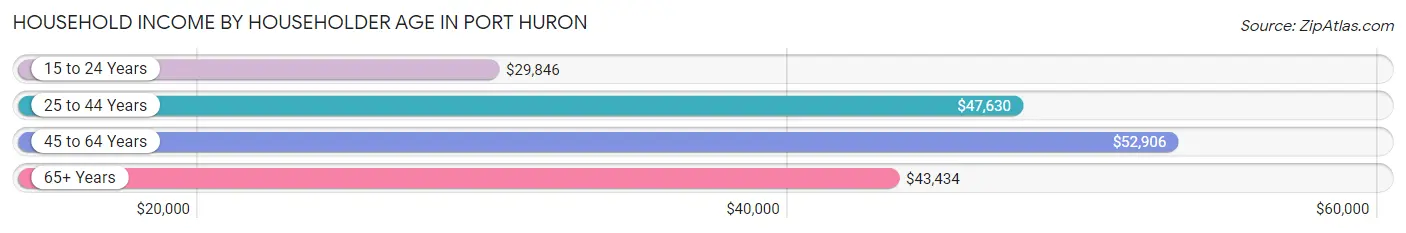
Household Income by Householder Age in Port Huron
The median household income in Port Huron is $47,906, with the highest median household income of $52,906 found in the 45 to 64 years age bracket for the primary householder. A total of 4,357 households (35.3%) fall into this category. Meanwhile, the 15 to 24 years age bracket for the primary householder has the lowest median household income of $29,846, with 337 households (2.7%) in this group.
| Income Bracket | # Households | Median Income |
| 15 to 24 Years | 337 (2.7%) | $29,846 |
| 25 to 44 Years | 4,175 (33.9%) | $47,630 |
| 45 to 64 Years | 4,357 (35.3%) | $52,906 |
| 65+ Years | 3,456 (28.0%) | $43,434 |
| Total | 12,325 (100.0%) | $47,906 |
Poverty in Port Huron
Income Below Poverty by Sex and Age in Port Huron
With 21.3% poverty level for males and 23.1% for females among the residents of Port Huron, 6 to 11 year old males and 15 year old females are the most vulnerable to poverty, with 555 males (54.8%) and 76 females (46.3%) in their respective age groups living below the poverty level.
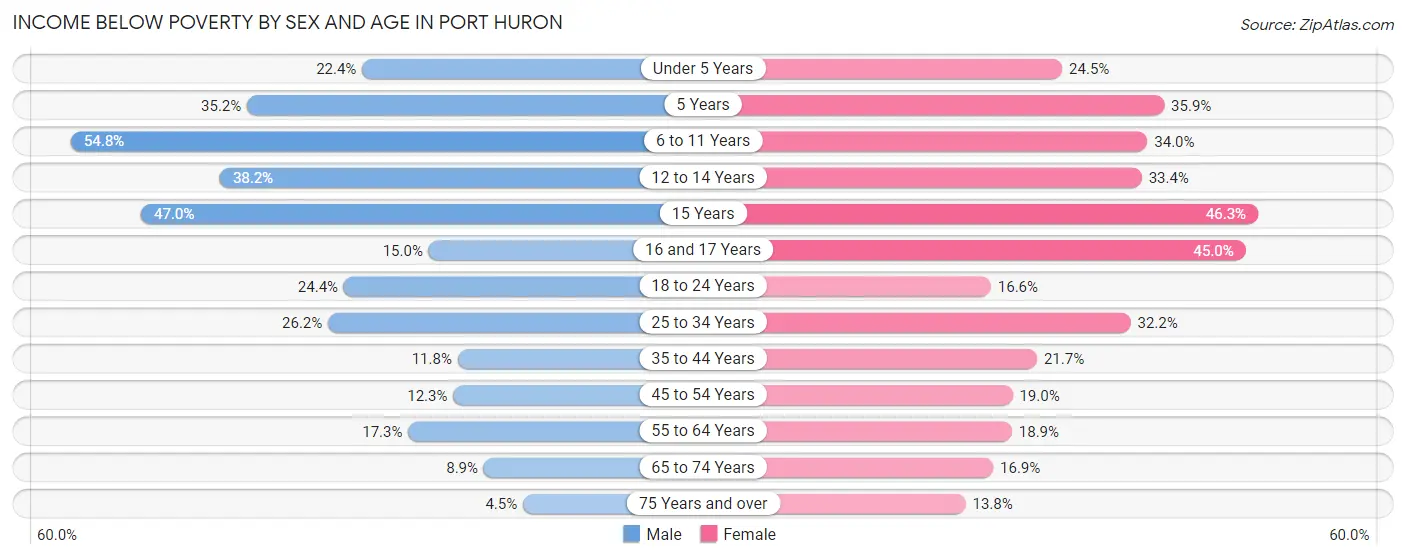
| Age Bracket | Male | Female |
| Under 5 Years | 215 (22.4%) | 146 (24.5%) |
| 5 Years | 56 (35.2%) | 28 (35.9%) |
| 6 to 11 Years | 555 (54.8%) | 358 (34.0%) |
| 12 to 14 Years | 239 (38.2%) | 162 (33.4%) |
| 15 Years | 95 (47.0%) | 76 (46.3%) |
| 16 and 17 Years | 64 (15.0%) | 179 (45.0%) |
| 18 to 24 Years | 352 (24.4%) | 208 (16.6%) |
| 25 to 34 Years | 569 (26.2%) | 611 (32.2%) |
| 35 to 44 Years | 191 (11.8%) | 440 (21.7%) |
| 45 to 54 Years | 201 (12.3%) | 314 (19.0%) |
| 55 to 64 Years | 294 (17.3%) | 373 (18.9%) |
| 65 to 74 Years | 110 (8.8%) | 275 (16.9%) |
| 75 Years and over | 33 (4.5%) | 176 (13.8%) |
| Total | 2,974 (21.3%) | 3,346 (23.1%) |
Income Above Poverty by Sex and Age in Port Huron
According to the poverty statistics in Port Huron, males aged 75 years and over and females aged 75 years and over are the age groups that are most secure financially, with 95.5% of males and 86.2% of females in these age groups living above the poverty line.
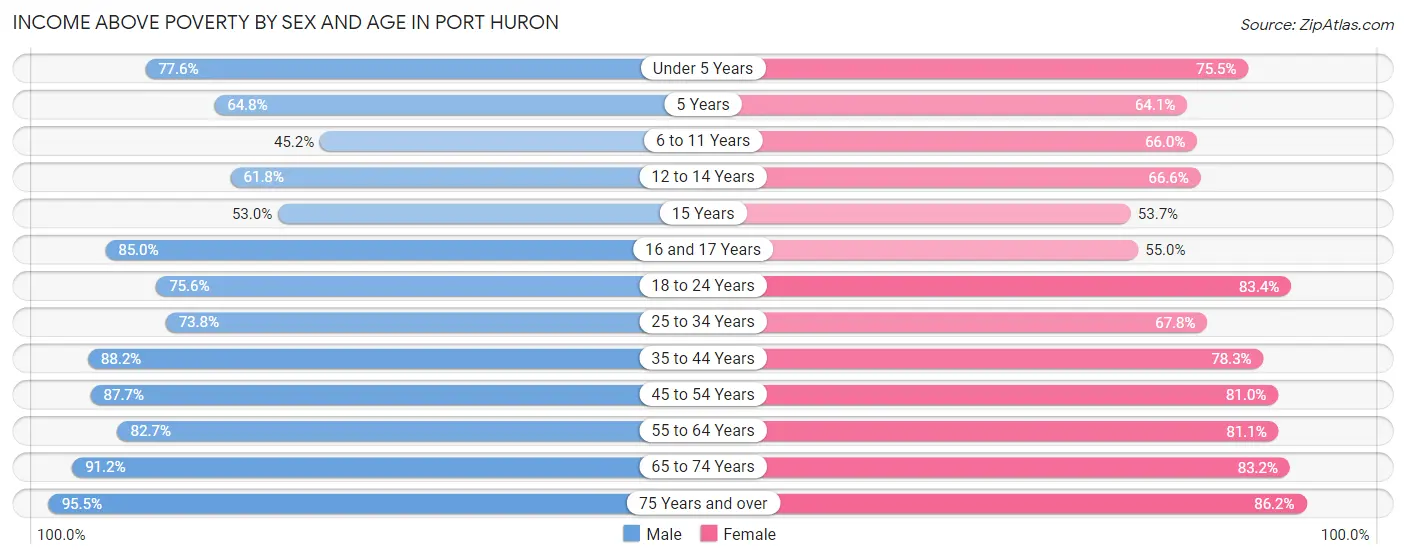
| Age Bracket | Male | Female |
| Under 5 Years | 745 (77.6%) | 449 (75.5%) |
| 5 Years | 103 (64.8%) | 50 (64.1%) |
| 6 to 11 Years | 457 (45.2%) | 694 (66.0%) |
| 12 to 14 Years | 386 (61.8%) | 323 (66.6%) |
| 15 Years | 107 (53.0%) | 88 (53.7%) |
| 16 and 17 Years | 363 (85.0%) | 219 (55.0%) |
| 18 to 24 Years | 1,088 (75.6%) | 1,045 (83.4%) |
| 25 to 34 Years | 1,603 (73.8%) | 1,289 (67.8%) |
| 35 to 44 Years | 1,433 (88.2%) | 1,584 (78.3%) |
| 45 to 54 Years | 1,439 (87.7%) | 1,338 (81.0%) |
| 55 to 64 Years | 1,408 (82.7%) | 1,596 (81.1%) |
| 65 to 74 Years | 1,133 (91.1%) | 1,357 (83.2%) |
| 75 Years and over | 702 (95.5%) | 1,101 (86.2%) |
| Total | 10,967 (78.7%) | 11,133 (76.9%) |
Income Below Poverty Among Married-Couple Families in Port Huron
The poverty statistics for married-couple families in Port Huron show that 5.8% or 234 of the total 4,050 families live below the poverty line. Families with 5 or more children have the highest poverty rate of 25.0%, comprising of 4 families. On the other hand, families with no children have the lowest poverty rate of 3.5%, which includes 96 families.
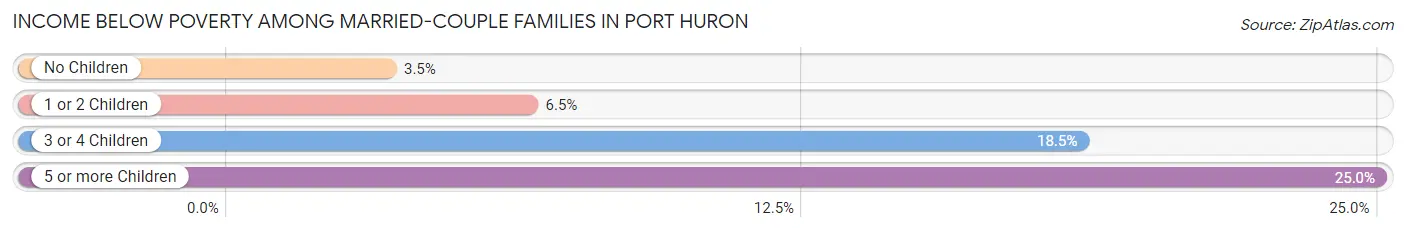
| Children | Above Poverty | Below Poverty |
| No Children | 2,680 (96.5%) | 96 (3.5%) |
| 1 or 2 Children | 772 (93.5%) | 54 (6.5%) |
| 3 or 4 Children | 352 (81.5%) | 80 (18.5%) |
| 5 or more Children | 12 (75.0%) | 4 (25.0%) |
| Total | 3,816 (94.2%) | 234 (5.8%) |
Income Below Poverty Among Single-Parent Households in Port Huron
According to the poverty data in Port Huron, 13.6% or 123 single-father households and 37.0% or 872 single-mother households are living below the poverty line. Among single-father households, those with 1 or 2 children have the highest poverty rate, with 88 households (19.6%) experiencing poverty. Likewise, among single-mother households, those with 3 or 4 children have the highest poverty rate, with 297 households (89.5%) falling below the poverty line.
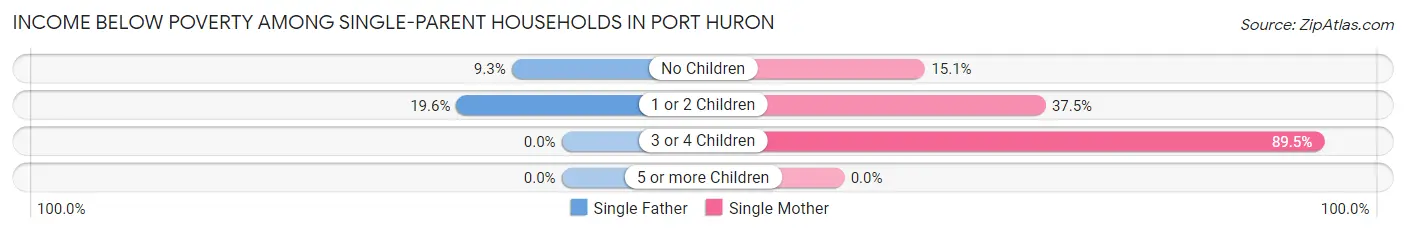
| Children | Single Father | Single Mother |
| No Children | 35 (9.3%) | 124 (15.0%) |
| 1 or 2 Children | 88 (19.6%) | 451 (37.5%) |
| 3 or 4 Children | 0 (0.0%) | 297 (89.5%) |
| 5 or more Children | 0 (0.0%) | 0 (0.0%) |
| Total | 123 (13.6%) | 872 (37.0%) |
Income Below Poverty Among Married-Couple vs Single-Parent Households in Port Huron
The poverty data for Port Huron shows that 234 of the married-couple family households (5.8%) and 995 of the single-parent households (30.5%) are living below the poverty level. Within the married-couple family households, those with 5 or more children have the highest poverty rate, with 4 households (25.0%) falling below the poverty line. Among the single-parent households, those with 3 or 4 children have the highest poverty rate, with 297 household (76.1%) living below poverty.
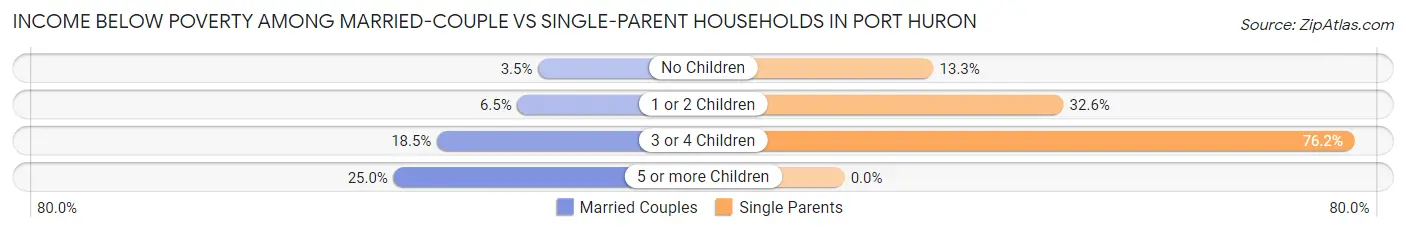
| Children | Married-Couple Families | Single-Parent Households |
| No Children | 96 (3.5%) | 159 (13.3%) |
| 1 or 2 Children | 54 (6.5%) | 539 (32.6%) |
| 3 or 4 Children | 80 (18.5%) | 297 (76.1%) |
| 5 or more Children | 4 (25.0%) | 0 (0.0%) |
| Total | 234 (5.8%) | 995 (30.5%) |
Race in Port Huron
The most populous races in Port Huron are White / Caucasian (23,446 | 81.2%), Two or more Races (2,353 | 8.2%), and Black / African American (2,351 | 8.1%).
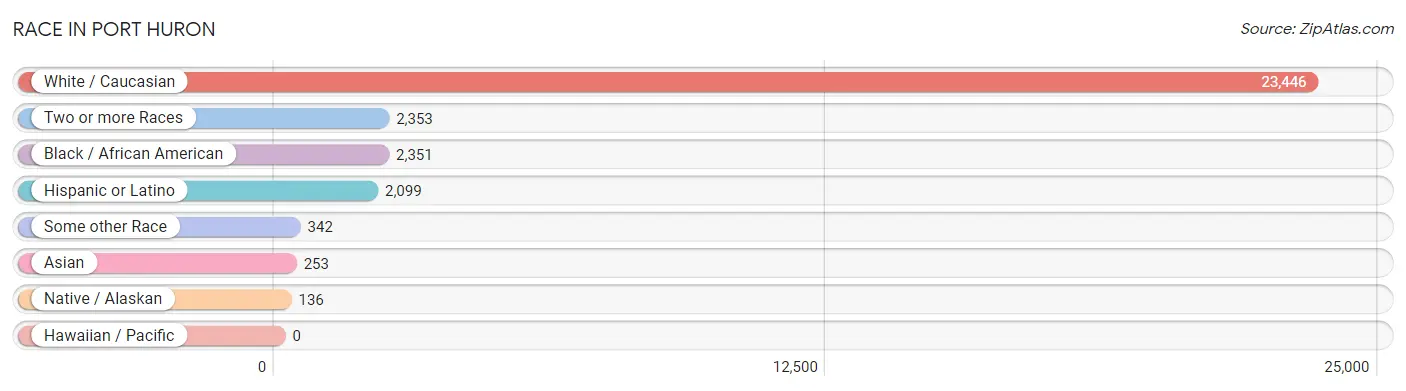
| Race | # Population | % Population |
| Asian | 253 | 0.9% |
| Black / African American | 2,351 | 8.1% |
| Hawaiian / Pacific | 0 | 0.0% |
| Hispanic or Latino | 2,099 | 7.3% |
| Native / Alaskan | 136 | 0.5% |
| White / Caucasian | 23,446 | 81.2% |
| Two or more Races | 2,353 | 8.2% |
| Some other Race | 342 | 1.2% |
| Total | 28,881 | 100.0% |
Ancestry in Port Huron
The most populous ancestries reported in Port Huron are German (5,838 | 20.2%), Irish (3,350 | 11.6%), English (2,933 | 10.2%), Polish (1,532 | 5.3%), and Mexican (1,440 | 5.0%), together accounting for 52.3% of all Port Huron residents.
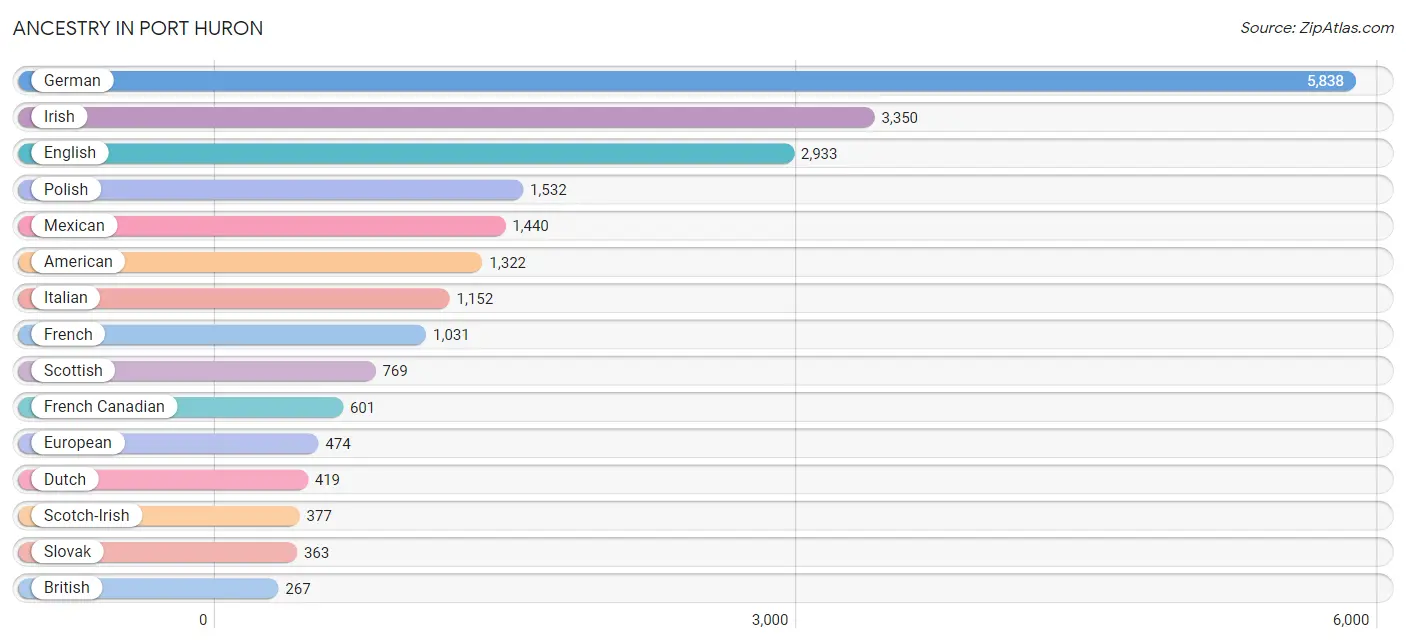
| Ancestry | # Population | % Population |
| African | 74 | 0.3% |
| American | 1,322 | 4.6% |
| Apache | 43 | 0.2% |
| Arab | 112 | 0.4% |
| Australian | 160 | 0.5% |
| Austrian | 36 | 0.1% |
| Barbadian | 6 | 0.0% |
| Belgian | 201 | 0.7% |
| Bhutanese | 25 | 0.1% |
| Blackfeet | 104 | 0.4% |
| British | 267 | 0.9% |
| Bulgarian | 8 | 0.0% |
| Burmese | 9 | 0.0% |
| Canadian | 117 | 0.4% |
| Central American | 132 | 0.5% |
| Central American Indian | 16 | 0.1% |
| Cherokee | 57 | 0.2% |
| Chippewa | 69 | 0.2% |
| Choctaw | 5 | 0.0% |
| Colombian | 12 | 0.0% |
| Creek | 18 | 0.1% |
| Cuban | 94 | 0.3% |
| Czech | 91 | 0.3% |
| Czechoslovakian | 16 | 0.1% |
| Danish | 141 | 0.5% |
| Dominican | 22 | 0.1% |
| Dutch | 419 | 1.5% |
| Eastern European | 50 | 0.2% |
| Ecuadorian | 16 | 0.1% |
| English | 2,933 | 10.2% |
| European | 474 | 1.6% |
| Finnish | 215 | 0.7% |
| French | 1,031 | 3.6% |
| French Canadian | 601 | 2.1% |
| German | 5,838 | 20.2% |
| Greek | 61 | 0.2% |
| Guatemalan | 26 | 0.1% |
| Hungarian | 258 | 0.9% |
| Indian (Asian) | 91 | 0.3% |
| Iranian | 48 | 0.2% |
| Iraqi | 6 | 0.0% |
| Irish | 3,350 | 11.6% |
| Iroquois | 13 | 0.1% |
| Italian | 1,152 | 4.0% |
| Jamaican | 45 | 0.2% |
| Korean | 216 | 0.7% |
| Lebanese | 51 | 0.2% |
| Lithuanian | 63 | 0.2% |
| Menominee | 13 | 0.1% |
| Mexican | 1,440 | 5.0% |
| Mexican American Indian | 11 | 0.0% |
| Native Hawaiian | 41 | 0.1% |
| Nicaraguan | 97 | 0.3% |
| Nigerian | 138 | 0.5% |
| Northern European | 12 | 0.0% |
| Norwegian | 237 | 0.8% |
| Ottawa | 11 | 0.0% |
| Panamanian | 9 | 0.0% |
| Polish | 1,532 | 5.3% |
| Puerto Rican | 62 | 0.2% |
| Romanian | 142 | 0.5% |
| Russian | 115 | 0.4% |
| Scandinavian | 101 | 0.4% |
| Scotch-Irish | 377 | 1.3% |
| Scottish | 769 | 2.7% |
| Sioux | 30 | 0.1% |
| Slavic | 9 | 0.0% |
| Slovak | 363 | 1.3% |
| South American | 28 | 0.1% |
| Spaniard | 58 | 0.2% |
| Spanish | 32 | 0.1% |
| Sri Lankan | 37 | 0.1% |
| Subsaharan African | 212 | 0.7% |
| Swedish | 264 | 0.9% |
| Swiss | 34 | 0.1% |
| Syrian | 30 | 0.1% |
| Thai | 12 | 0.0% |
| Turkish | 19 | 0.1% |
| Ukrainian | 22 | 0.1% |
| Welsh | 77 | 0.3% |
| Yugoslavian | 30 | 0.1% | View All 81 Rows |
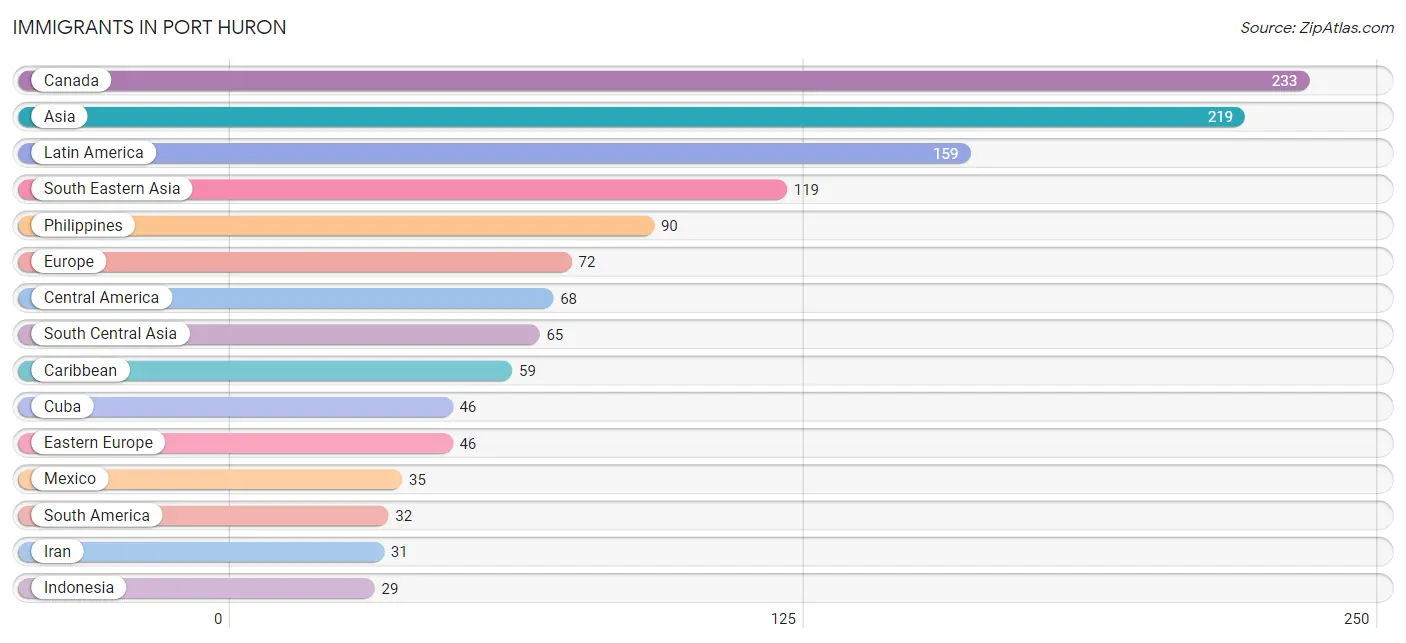
Immigrants in Port Huron
The most numerous immigrant groups reported in Port Huron came from Canada (233 | 0.8%), Asia (219 | 0.8%), Latin America (159 | 0.5%), South Eastern Asia (119 | 0.4%), and Philippines (90 | 0.3%), together accounting for 2.8% of all Port Huron residents.
| Immigration Origin | # Population | % Population |
| Asia | 219 | 0.8% |
| Bosnia and Herzegovina | 11 | 0.0% |
| Brazil | 20 | 0.1% |
| Canada | 233 | 0.8% |
| Caribbean | 59 | 0.2% |
| Central America | 68 | 0.2% |
| China | 12 | 0.0% |
| Colombia | 12 | 0.0% |
| Costa Rica | 2 | 0.0% |
| Cuba | 46 | 0.2% |
| Eastern Asia | 15 | 0.1% |
| Eastern Europe | 46 | 0.2% |
| England | 4 | 0.0% |
| Europe | 72 | 0.3% |
| Germany | 5 | 0.0% |
| Honduras | 22 | 0.1% |
| India | 12 | 0.0% |
| Indonesia | 29 | 0.1% |
| Iran | 31 | 0.1% |
| Iraq | 19 | 0.1% |
| Jamaica | 7 | 0.0% |
| Korea | 3 | 0.0% |
| Latin America | 159 | 0.5% |
| Lebanon | 1 | 0.0% |
| Mexico | 35 | 0.1% |
| Netherlands | 17 | 0.1% |
| Northern Europe | 4 | 0.0% |
| Pakistan | 22 | 0.1% |
| Panama | 9 | 0.0% |
| Philippines | 90 | 0.3% |
| Poland | 7 | 0.0% |
| Russia | 28 | 0.1% |
| South America | 32 | 0.1% |
| South Central Asia | 65 | 0.2% |
| South Eastern Asia | 119 | 0.4% |
| West Indies | 6 | 0.0% |
| Western Asia | 20 | 0.1% |
| Western Europe | 22 | 0.1% | View All 38 Rows |
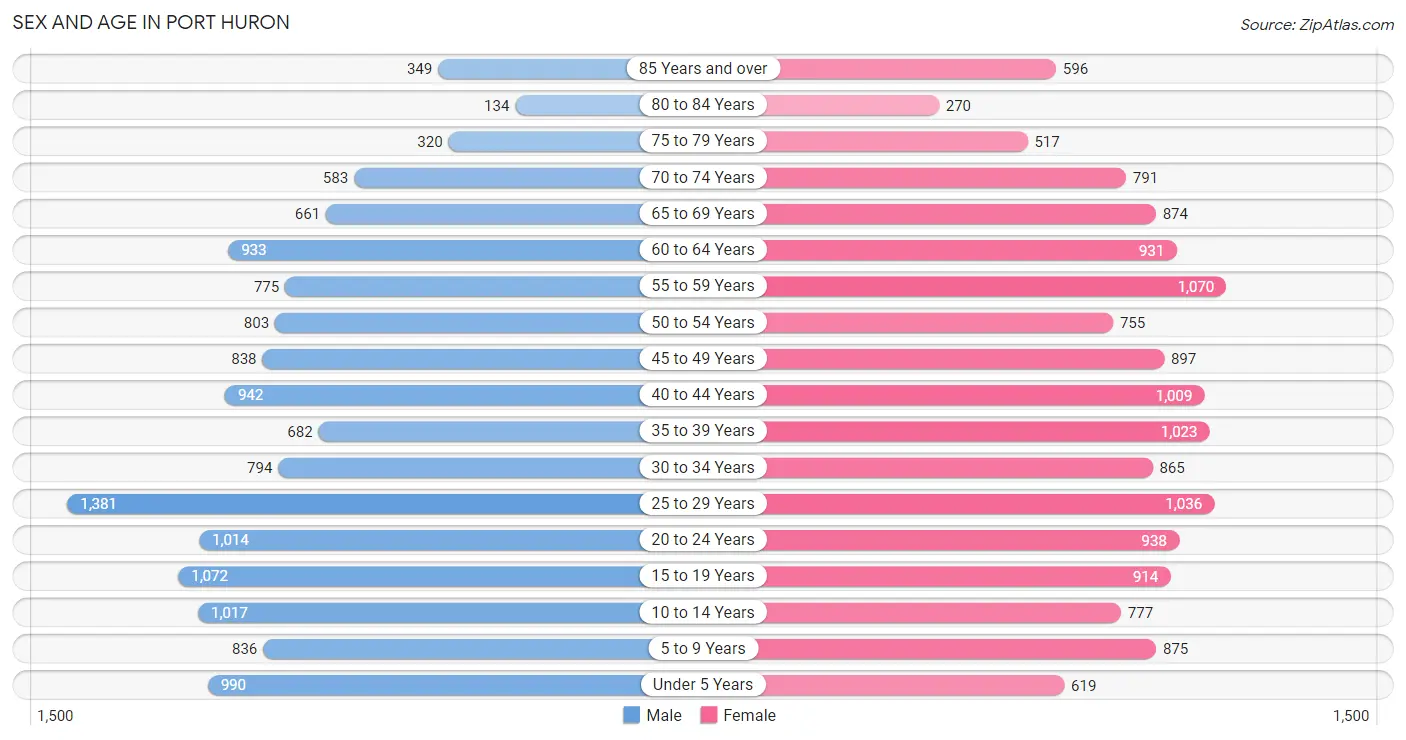
Sex and Age in Port Huron
Sex and Age in Port Huron
The most populous age groups in Port Huron are 25 to 29 Years (1,381 | 9.8%) for men and 55 to 59 Years (1,070 | 7.2%) for women.
| Age Bracket | Male | Female |
| Under 5 Years | 990 (7.0%) | 619 (4.2%) |
| 5 to 9 Years | 836 (5.9%) | 875 (5.9%) |
| 10 to 14 Years | 1,017 (7.2%) | 777 (5.3%) |
| 15 to 19 Years | 1,072 (7.6%) | 914 (6.2%) |
| 20 to 24 Years | 1,014 (7.2%) | 938 (6.4%) |
| 25 to 29 Years | 1,381 (9.8%) | 1,036 (7.0%) |
| 30 to 34 Years | 794 (5.6%) | 865 (5.9%) |
| 35 to 39 Years | 682 (4.8%) | 1,023 (6.9%) |
| 40 to 44 Years | 942 (6.7%) | 1,009 (6.8%) |
| 45 to 49 Years | 838 (5.9%) | 897 (6.1%) |
| 50 to 54 Years | 803 (5.7%) | 755 (5.1%) |
| 55 to 59 Years | 775 (5.5%) | 1,070 (7.2%) |
| 60 to 64 Years | 933 (6.6%) | 931 (6.3%) |
| 65 to 69 Years | 661 (4.7%) | 874 (5.9%) |
| 70 to 74 Years | 583 (4.1%) | 791 (5.4%) |
| 75 to 79 Years | 320 (2.3%) | 517 (3.5%) |
| 80 to 84 Years | 134 (0.9%) | 270 (1.8%) |
| 85 Years and over | 349 (2.5%) | 596 (4.0%) |
| Total | 14,124 (100.0%) | 14,757 (100.0%) |
Families and Households in Port Huron
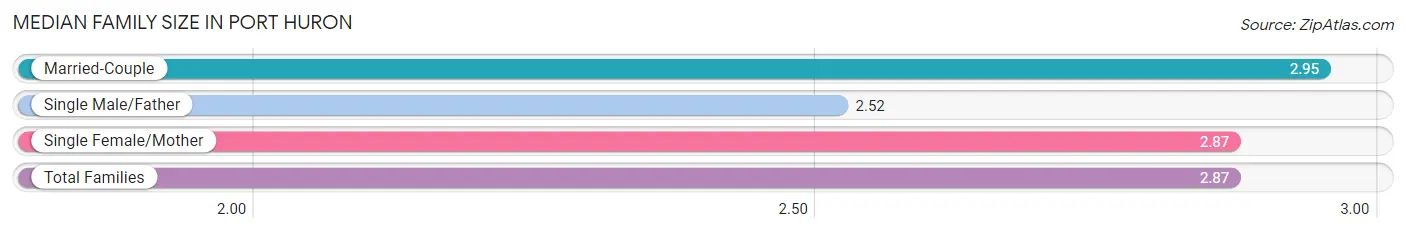
Median Family Size in Port Huron
The median family size in Port Huron is 2.87 persons per family, with married-couple families (4,050 | 55.4%) accounting for the largest median family size of 2.95 persons per family. On the other hand, single male/father families (906 | 12.4%) represent the smallest median family size with 2.52 persons per family.
| Family Type | # Families | Family Size |
| Married-Couple | 4,050 (55.4%) | 2.95 |
| Single Male/Father | 906 (12.4%) | 2.52 |
| Single Female/Mother | 2,359 (32.3%) | 2.87 |
| Total Families | 7,315 (100.0%) | 2.87 |
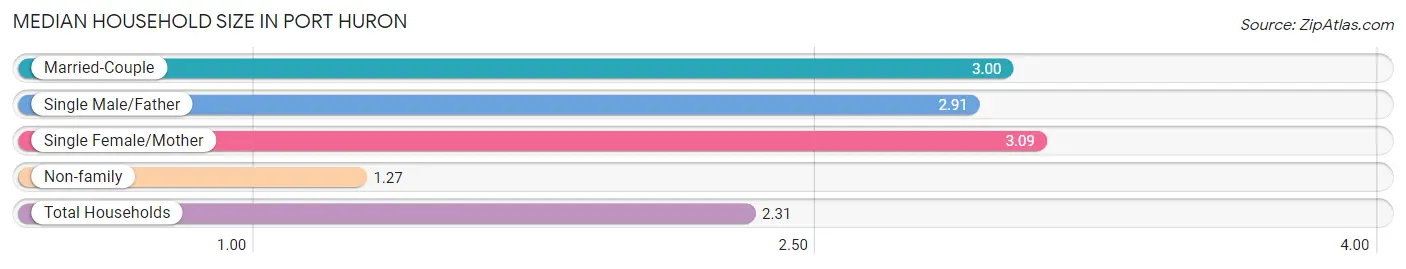
Median Household Size in Port Huron
The median household size in Port Huron is 2.31 persons per household, with single female/mother households (2,359 | 19.1%) accounting for the largest median household size of 3.09 persons per household. non-family households (5,010 | 40.6%) represent the smallest median household size with 1.27 persons per household.
| Household Type | # Households | Household Size |
| Married-Couple | 4,050 (32.9%) | 3.00 |
| Single Male/Father | 906 (7.3%) | 2.91 |
| Single Female/Mother | 2,359 (19.1%) | 3.09 |
| Non-family | 5,010 (40.6%) | 1.27 |
| Total Households | 12,325 (100.0%) | 2.31 |
Household Size by Marriage Status in Port Huron
Out of a total of 12,325 households in Port Huron, 7,315 (59.4%) are family households, while 5,010 (40.6%) are nonfamily households. The most numerous type of family households are 2-person households, comprising 3,405, and the most common type of nonfamily households are 1-person households, comprising 3,945.
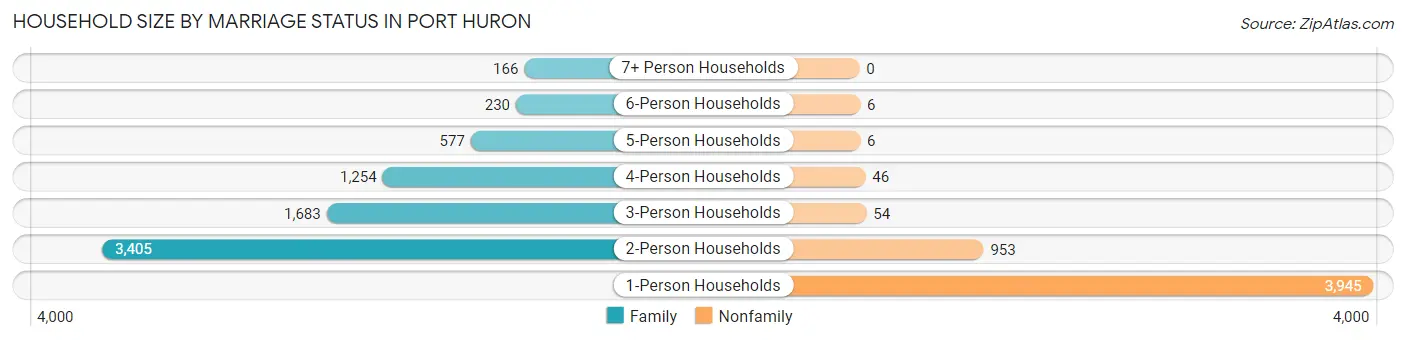
| Household Size | Family Households | Nonfamily Households |
| 1-Person Households | - | 3,945 (32.0%) |
| 2-Person Households | 3,405 (27.6%) | 953 (7.7%) |
| 3-Person Households | 1,683 (13.7%) | 54 (0.4%) |
| 4-Person Households | 1,254 (10.2%) | 46 (0.4%) |
| 5-Person Households | 577 (4.7%) | 6 (0.1%) |
| 6-Person Households | 230 (1.9%) | 6 (0.1%) |
| 7+ Person Households | 166 (1.3%) | 0 (0.0%) |
| Total | 7,315 (59.4%) | 5,010 (40.6%) |
Female Fertility in Port Huron
Fertility by Age in Port Huron
Average fertility rate in Port Huron is 57.0 births per 1,000 women. Women in the age bracket of 20 to 34 years have the highest fertility rate with 90.0 births per 1,000 women. Women in the age bracket of 20 to 34 years acount for 65.8% of all women with births.
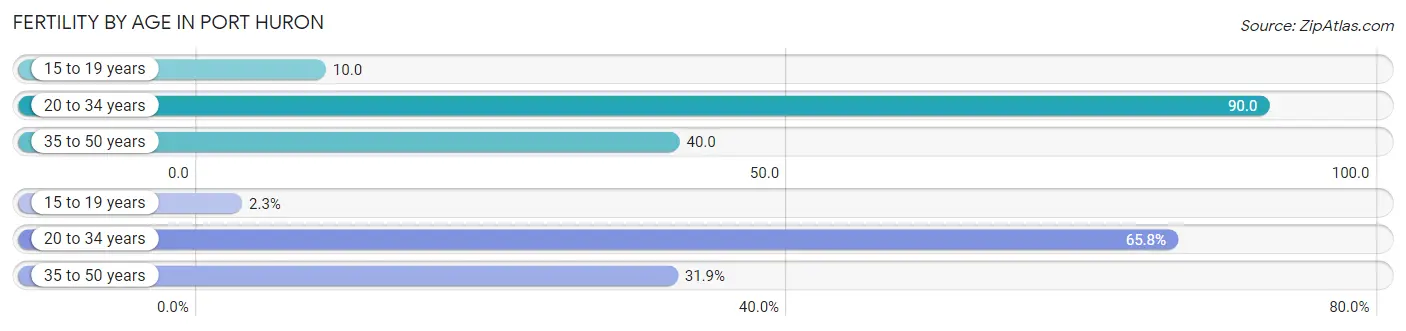
| Age Bracket | Women with Births | Births / 1,000 Women |
| 15 to 19 years | 9 (2.3%) | 10.0 |
| 20 to 34 years | 256 (65.8%) | 90.0 |
| 35 to 50 years | 124 (31.9%) | 40.0 |
| Total | 389 (100.0%) | 57.0 |
Fertility by Age by Marriage Status in Port Huron
52.4% of women with births (389) in Port Huron are married. The highest percentage of unmarried women with births falls into 15 to 19 years age bracket with 100.0% of them unmarried at the time of birth, while the lowest percentage of unmarried women with births belong to 35 to 50 years age bracket with 43.5% of them unmarried.
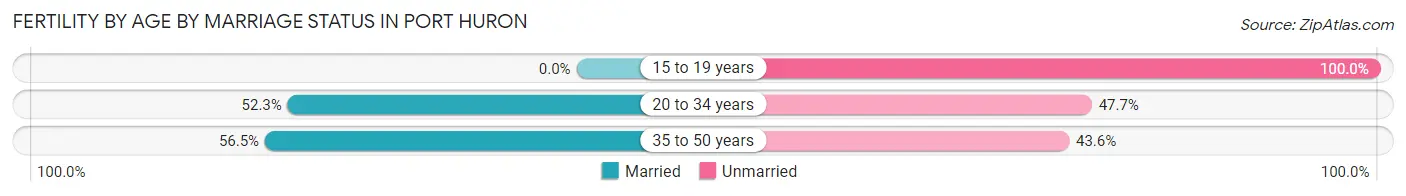
| Age Bracket | Married | Unmarried |
| 15 to 19 years | 0 (0.0%) | 9 (100.0%) |
| 20 to 34 years | 134 (52.3%) | 122 (47.7%) |
| 35 to 50 years | 70 (56.5%) | 54 (43.5%) |
| Total | 204 (52.4%) | 185 (47.6%) |
Fertility by Education in Port Huron
Average fertility rate in Port Huron is 57.0 births per 1,000 women. Women with the education attainment of bachelor's degree have the highest fertility rate of 105.0 births per 1,000 women, while women with the education attainment of less than high school have the lowest fertility at 30.0 births per 1,000 women. Women with the education attainment of high school diploma represent 36.8% of all women with births.
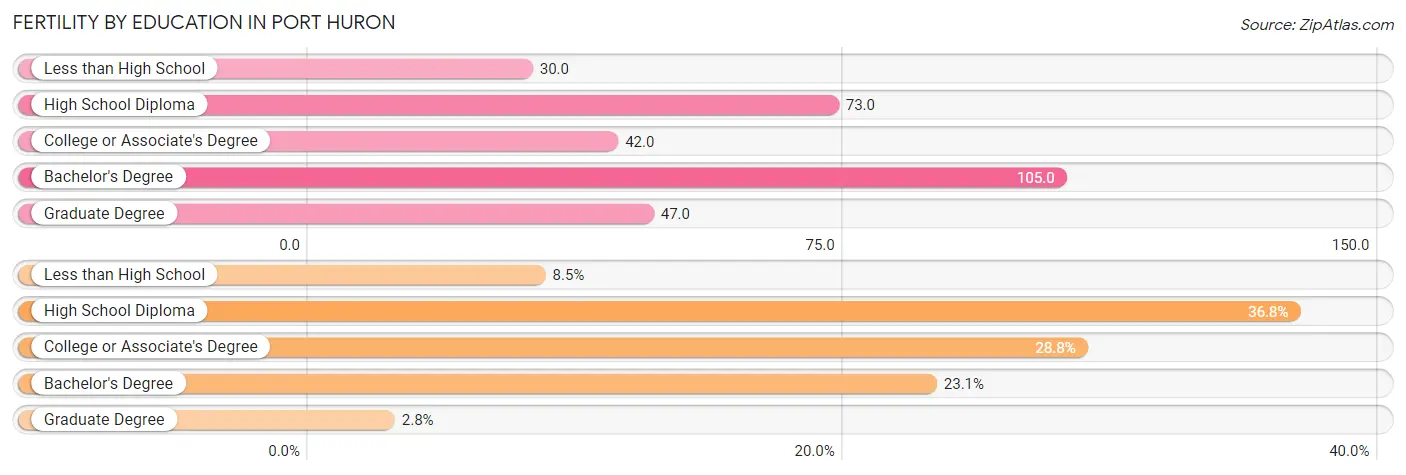
| Educational Attainment | Women with Births | Births / 1,000 Women |
| Less than High School | 33 (8.5%) | 30.0 |
| High School Diploma | 143 (36.8%) | 73.0 |
| College or Associate's Degree | 112 (28.8%) | 42.0 |
| Bachelor's Degree | 90 (23.1%) | 105.0 |
| Graduate Degree | 11 (2.8%) | 47.0 |
| Total | 389 (100.0%) | 57.0 |
Fertility by Education by Marriage Status in Port Huron
47.6% of women with births in Port Huron are unmarried. Women with the educational attainment of bachelor's degree are most likely to be married with 100.0% of them married at childbirth, while women with the educational attainment of graduate degree are least likely to be married with 100.0% of them unmarried at childbirth.
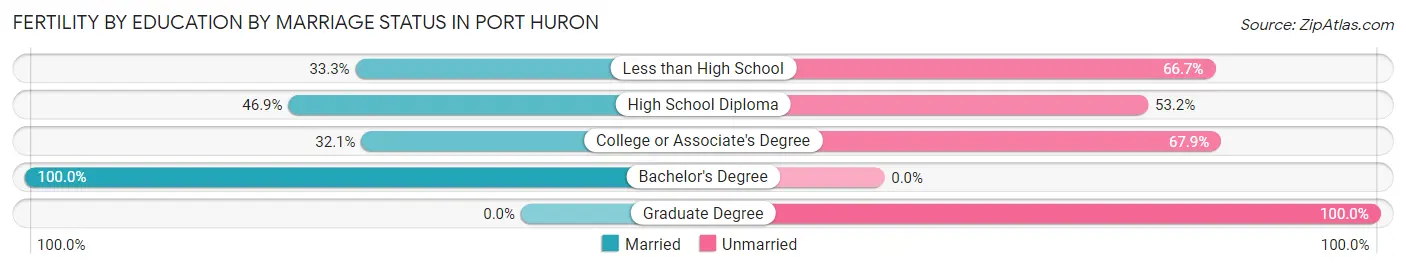
| Educational Attainment | Married | Unmarried |
| Less than High School | 11 (33.3%) | 22 (66.7%) |
| High School Diploma | 67 (46.9%) | 76 (53.1%) |
| College or Associate's Degree | 36 (32.1%) | 76 (67.9%) |
| Bachelor's Degree | 90 (100.0%) | 0 (0.0%) |
| Graduate Degree | 0 (0.0%) | 11 (100.0%) |
| Total | 204 (52.4%) | 185 (47.6%) |
Employment Characteristics in Port Huron
Employment by Class of Employer in Port Huron
Among the 12,180 employed individuals in Port Huron, private company employees (9,027 | 74.1%), not-for-profit organizations (984 | 8.1%), and self-employed (not incorporated) (868 | 7.1%) make up the most common classes of employment.
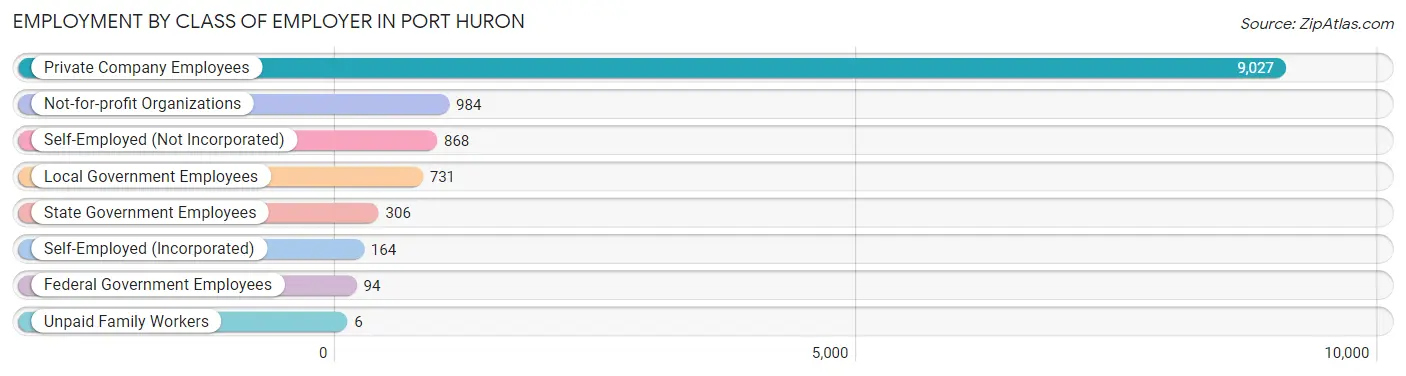
| Employer Class | # Employees | % Employees |
| Private Company Employees | 9,027 | 74.1% |
| Self-Employed (Incorporated) | 164 | 1.3% |
| Self-Employed (Not Incorporated) | 868 | 7.1% |
| Not-for-profit Organizations | 984 | 8.1% |
| Local Government Employees | 731 | 6.0% |
| State Government Employees | 306 | 2.5% |
| Federal Government Employees | 94 | 0.8% |
| Unpaid Family Workers | 6 | 0.1% |
| Total | 12,180 | 100.0% |
Employment Status by Age in Port Huron
According to the labor force statistics for Port Huron, out of the total population over 16 years of age (23,401), 58.9% or 13,783 individuals are in the labor force, with 9.3% or 1,282 of them unemployed. The age group with the highest labor force participation rate is 25 to 29 years, with 83.1% or 2,009 individuals in the labor force. Within the labor force, the 16 to 19 years age range has the highest percentage of unemployed individuals, with 25.2% or 186 of them being unemployed.
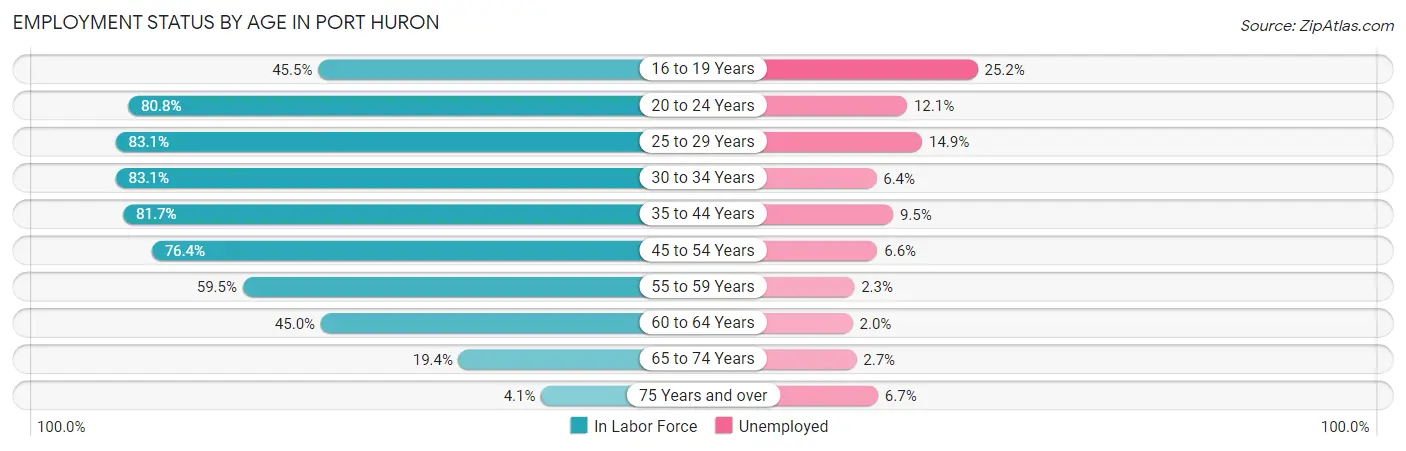
| Age Bracket | In Labor Force | Unemployed |
| 16 to 19 Years | 737 (45.5%) | 186 (25.2%) |
| 20 to 24 Years | 1,577 (80.8%) | 191 (12.1%) |
| 25 to 29 Years | 2,009 (83.1%) | 299 (14.9%) |
| 30 to 34 Years | 1,379 (83.1%) | 88 (6.4%) |
| 35 to 44 Years | 2,987 (81.7%) | 284 (9.5%) |
| 45 to 54 Years | 2,516 (76.4%) | 166 (6.6%) |
| 55 to 59 Years | 1,098 (59.5%) | 25 (2.3%) |
| 60 to 64 Years | 839 (45.0%) | 17 (2.0%) |
| 65 to 74 Years | 564 (19.4%) | 15 (2.7%) |
| 75 Years and over | 90 (4.1%) | 6 (6.7%) |
| Total | 13,783 (58.9%) | 1,282 (9.3%) |
Employment Status by Educational Attainment in Port Huron
According to labor force statistics for Port Huron, 73.5% of individuals (10,829) out of the total population between 25 and 64 years of age (14,734) are in the labor force, with 8.1% or 877 of them being unemployed. The group with the highest labor force participation rate are those with the educational attainment of bachelor's degree or higher, with 90.6% or 2,183 individuals in the labor force. Within the labor force, individuals with high school diploma education have the highest percentage of unemployment, with 11.5% or 409 of them being unemployed.
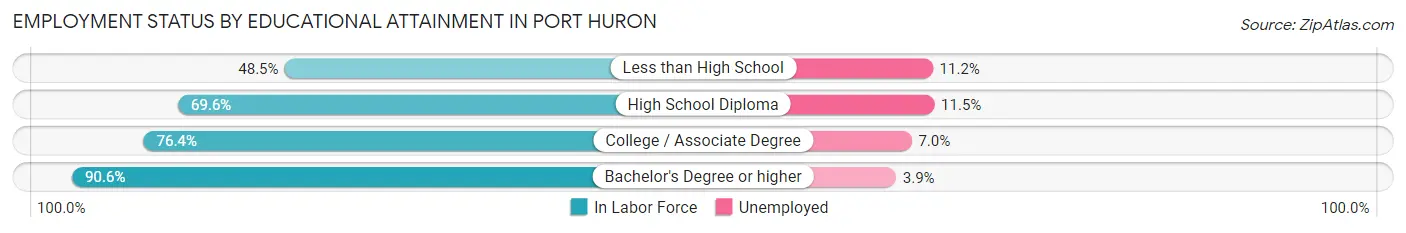
| Educational Attainment | In Labor Force | Unemployed |
| Less than High School | 744 (48.5%) | 172 (11.2%) |
| High School Diploma | 3,554 (69.6%) | 587 (11.5%) |
| College / Associate Degree | 4,341 (76.4%) | 398 (7.0%) |
| Bachelor's Degree or higher | 2,183 (90.6%) | 94 (3.9%) |
| Total | 10,829 (73.5%) | 1,193 (8.1%) |
Employment Occupations by Sex in Port Huron
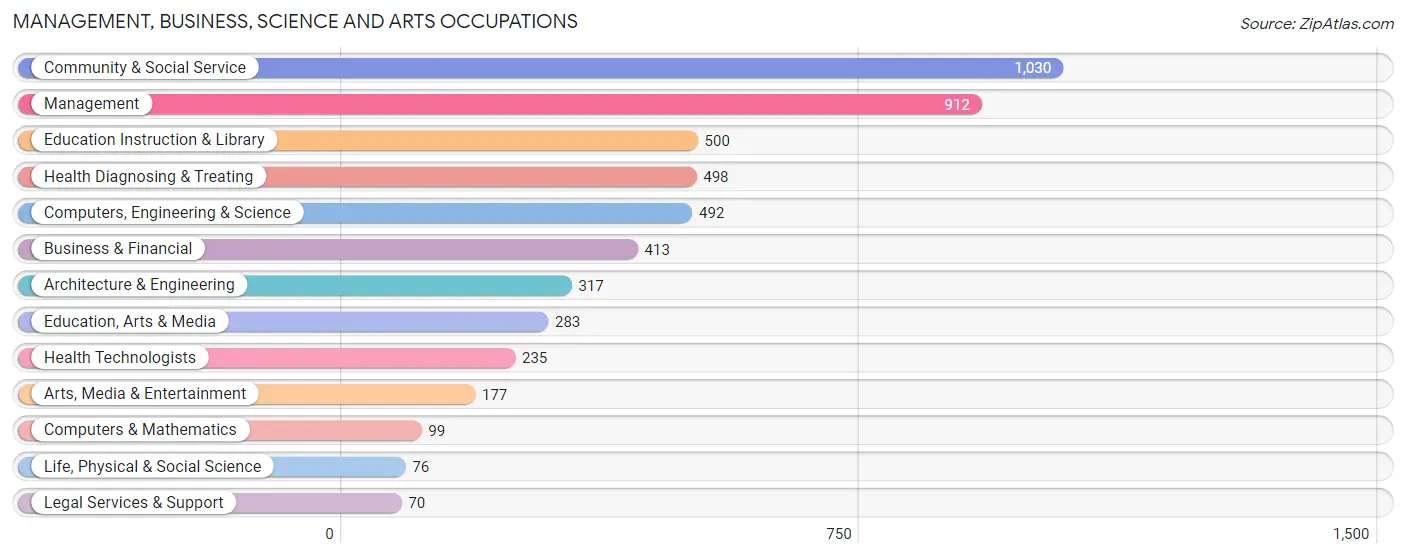
Management, Business, Science and Arts Occupations
The most common Management, Business, Science and Arts occupations in Port Huron are Community & Social Service (1,030 | 8.2%), Management (912 | 7.3%), Education Instruction & Library (500 | 4.0%), Health Diagnosing & Treating (498 | 4.0%), and Computers, Engineering & Science (492 | 3.9%).
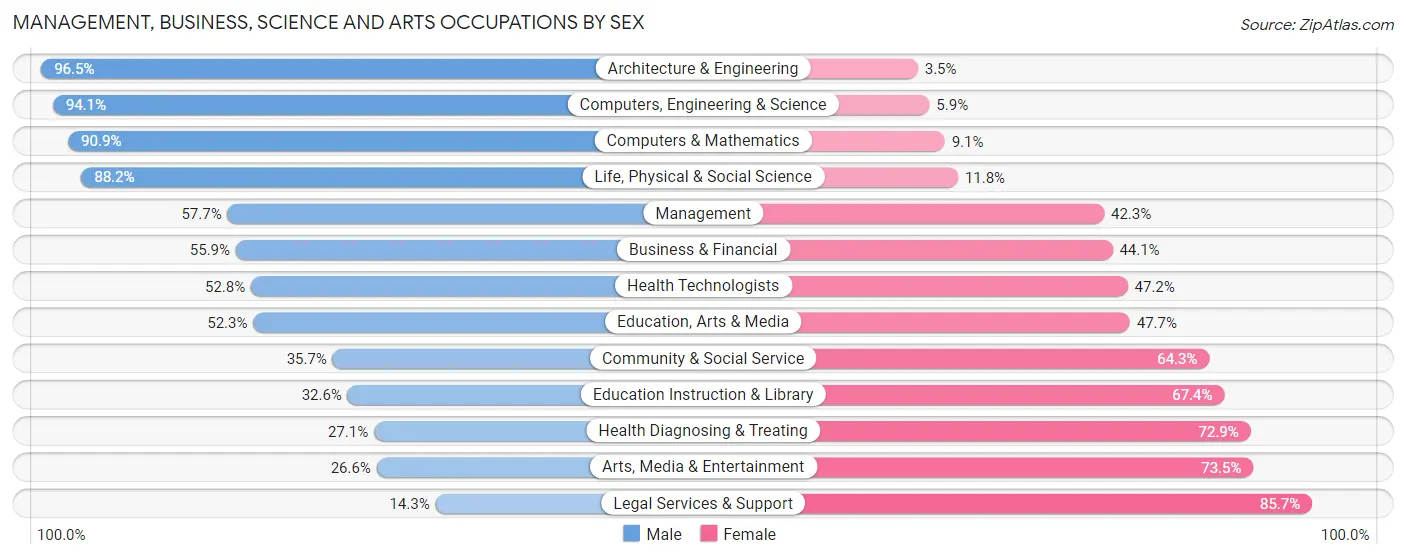
Management, Business, Science and Arts Occupations by Sex
Within the Management, Business, Science and Arts occupations in Port Huron, the most male-oriented occupations are Architecture & Engineering (96.5%), Computers, Engineering & Science (94.1%), and Computers & Mathematics (90.9%), while the most female-oriented occupations are Legal Services & Support (85.7%), Arts, Media & Entertainment (73.5%), and Health Diagnosing & Treating (72.9%).
| Occupation | Male | Female |
| Management | 526 (57.7%) | 386 (42.3%) |
| Business & Financial | 231 (55.9%) | 182 (44.1%) |
| Computers, Engineering & Science | 463 (94.1%) | 29 (5.9%) |
| Computers & Mathematics | 90 (90.9%) | 9 (9.1%) |
| Architecture & Engineering | 306 (96.5%) | 11 (3.5%) |
| Life, Physical & Social Science | 67 (88.2%) | 9 (11.8%) |
| Community & Social Service | 368 (35.7%) | 662 (64.3%) |
| Education, Arts & Media | 148 (52.3%) | 135 (47.7%) |
| Legal Services & Support | 10 (14.3%) | 60 (85.7%) |
| Education Instruction & Library | 163 (32.6%) | 337 (67.4%) |
| Arts, Media & Entertainment | 47 (26.6%) | 130 (73.5%) |
| Health Diagnosing & Treating | 135 (27.1%) | 363 (72.9%) |
| Health Technologists | 124 (52.8%) | 111 (47.2%) |
| Total (Category) | 1,723 (51.5%) | 1,622 (48.5%) |
| Total (Overall) | 6,325 (50.6%) | 6,186 (49.4%) |
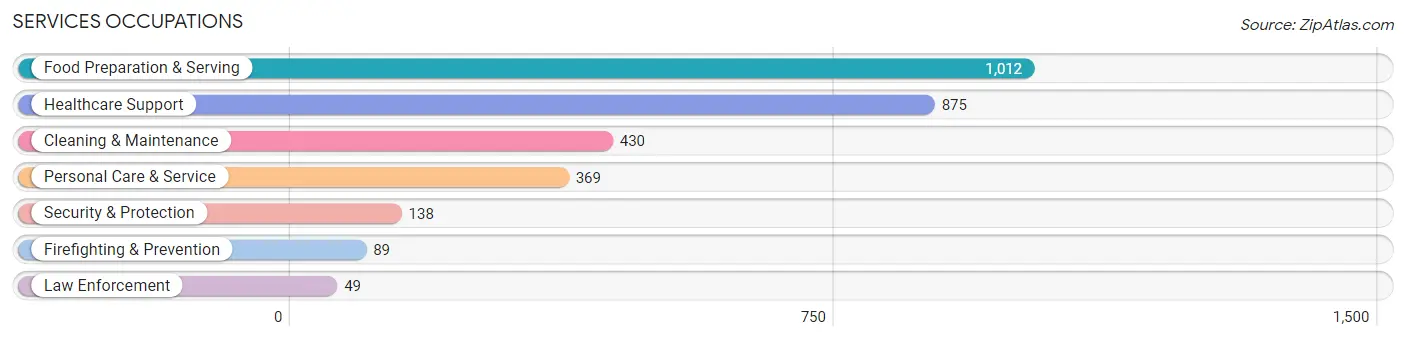
Services Occupations
The most common Services occupations in Port Huron are Food Preparation & Serving (1,012 | 8.1%), Healthcare Support (875 | 7.0%), Cleaning & Maintenance (430 | 3.4%), Personal Care & Service (369 | 2.9%), and Security & Protection (138 | 1.1%).
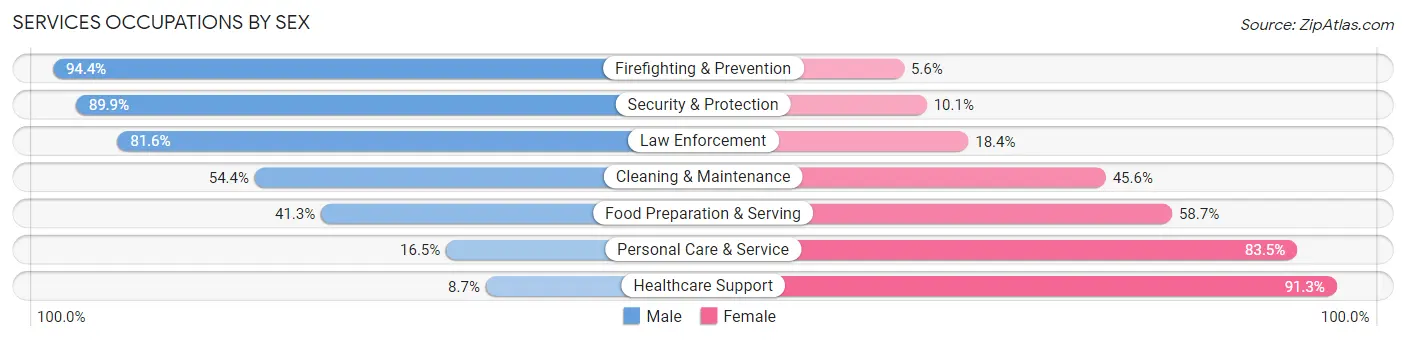
Services Occupations by Sex
Within the Services occupations in Port Huron, the most male-oriented occupations are Firefighting & Prevention (94.4%), Security & Protection (89.9%), and Law Enforcement (81.6%), while the most female-oriented occupations are Healthcare Support (91.3%), Personal Care & Service (83.5%), and Food Preparation & Serving (58.7%).
| Occupation | Male | Female |
| Healthcare Support | 76 (8.7%) | 799 (91.3%) |
| Security & Protection | 124 (89.9%) | 14 (10.1%) |
| Firefighting & Prevention | 84 (94.4%) | 5 (5.6%) |
| Law Enforcement | 40 (81.6%) | 9 (18.4%) |
| Food Preparation & Serving | 418 (41.3%) | 594 (58.7%) |
| Cleaning & Maintenance | 234 (54.4%) | 196 (45.6%) |
| Personal Care & Service | 61 (16.5%) | 308 (83.5%) |
| Total (Category) | 913 (32.3%) | 1,911 (67.7%) |
| Total (Overall) | 6,325 (50.6%) | 6,186 (49.4%) |
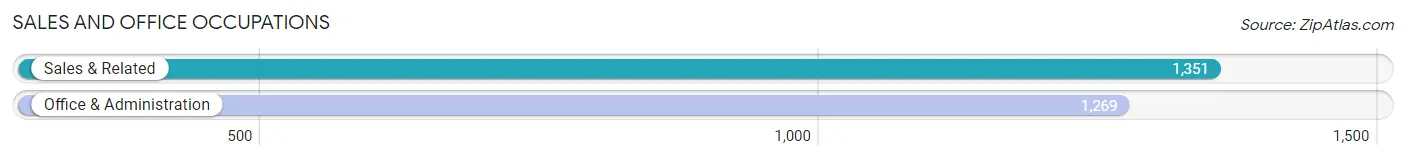
Sales and Office Occupations
The most common Sales and Office occupations in Port Huron are Sales & Related (1,351 | 10.8%), and Office & Administration (1,269 | 10.1%).
Sales and Office Occupations by Sex
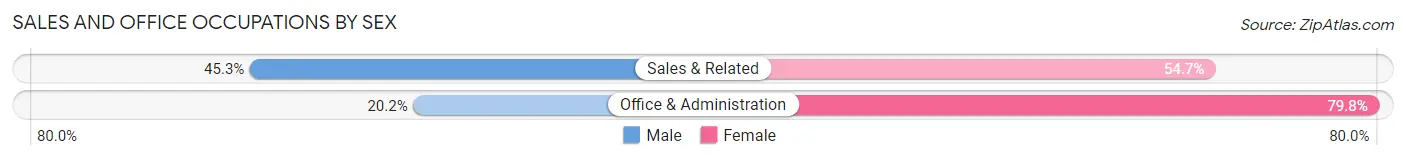
| Occupation | Male | Female |
| Sales & Related | 612 (45.3%) | 739 (54.7%) |
| Office & Administration | 256 (20.2%) | 1,013 (79.8%) |
| Total (Category) | 868 (33.1%) | 1,752 (66.9%) |
| Total (Overall) | 6,325 (50.6%) | 6,186 (49.4%) |
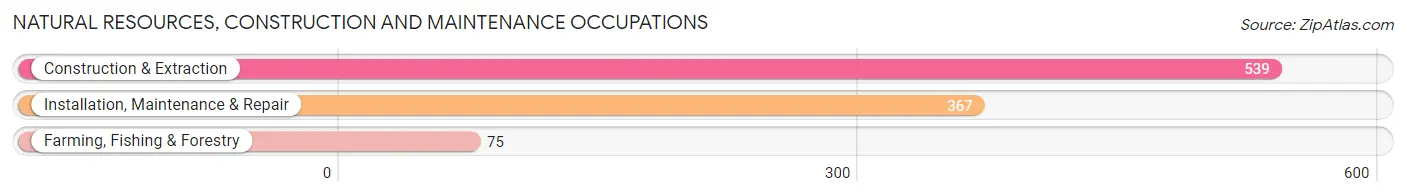
Natural Resources, Construction and Maintenance Occupations
The most common Natural Resources, Construction and Maintenance occupations in Port Huron are Construction & Extraction (539 | 4.3%), Installation, Maintenance & Repair (367 | 2.9%), and Farming, Fishing & Forestry (75 | 0.6%).
Natural Resources, Construction and Maintenance Occupations by Sex
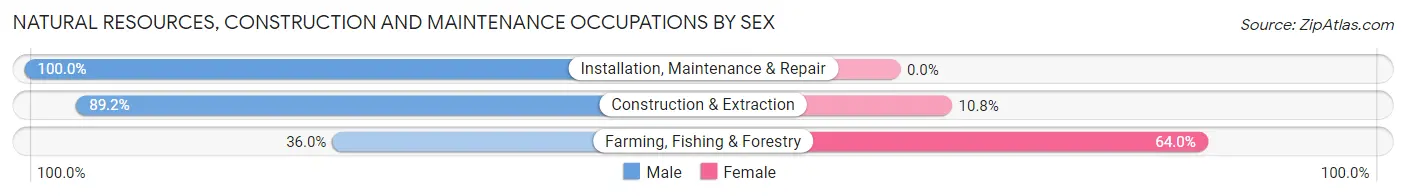
| Occupation | Male | Female |
| Farming, Fishing & Forestry | 27 (36.0%) | 48 (64.0%) |
| Construction & Extraction | 481 (89.2%) | 58 (10.8%) |
| Installation, Maintenance & Repair | 367 (100.0%) | 0 (0.0%) |
| Total (Category) | 875 (89.2%) | 106 (10.8%) |
| Total (Overall) | 6,325 (50.6%) | 6,186 (49.4%) |
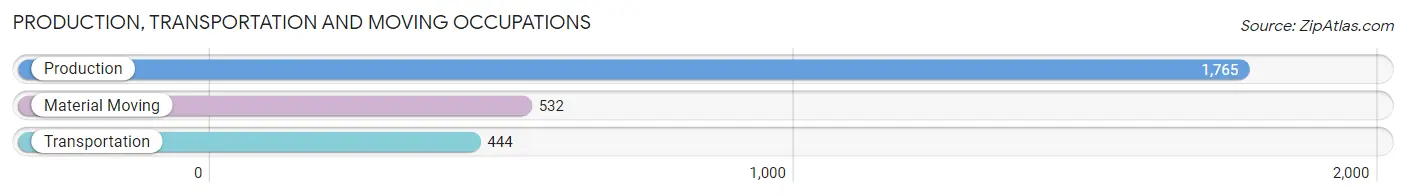
Production, Transportation and Moving Occupations
The most common Production, Transportation and Moving occupations in Port Huron are Production (1,765 | 14.1%), Material Moving (532 | 4.3%), and Transportation (444 | 3.5%).
Production, Transportation and Moving Occupations by Sex
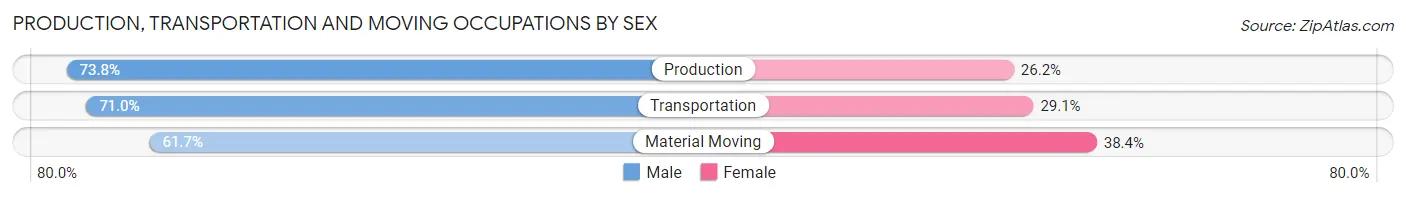
| Occupation | Male | Female |
| Production | 1,303 (73.8%) | 462 (26.2%) |
| Transportation | 315 (71.0%) | 129 (29.0%) |
| Material Moving | 328 (61.7%) | 204 (38.4%) |
| Total (Category) | 1,946 (71.0%) | 795 (29.0%) |
| Total (Overall) | 6,325 (50.6%) | 6,186 (49.4%) |
Employment Industries by Sex in Port Huron
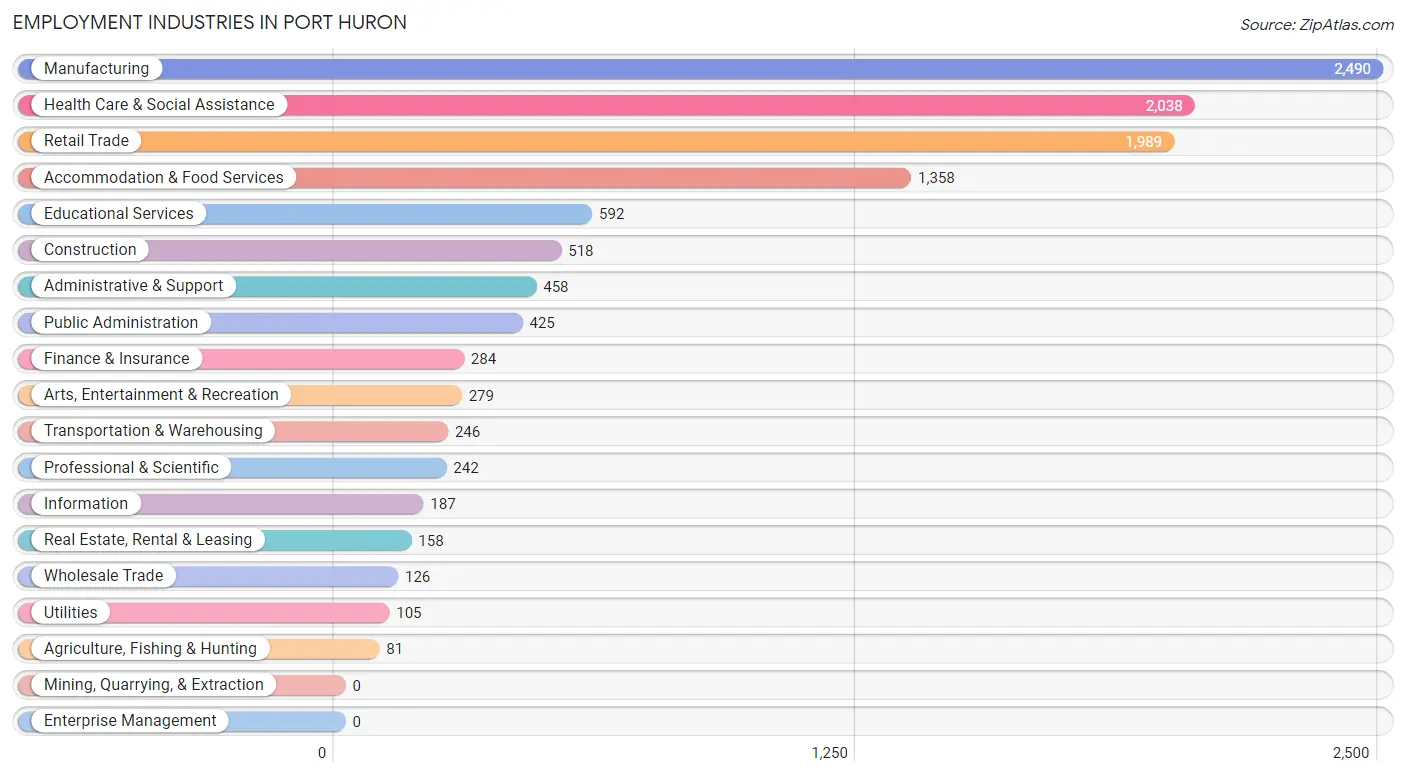
Employment Industries in Port Huron
The major employment industries in Port Huron include Manufacturing (2,490 | 19.9%), Health Care & Social Assistance (2,038 | 16.3%), Retail Trade (1,989 | 15.9%), Accommodation & Food Services (1,358 | 10.8%), and Educational Services (592 | 4.7%).
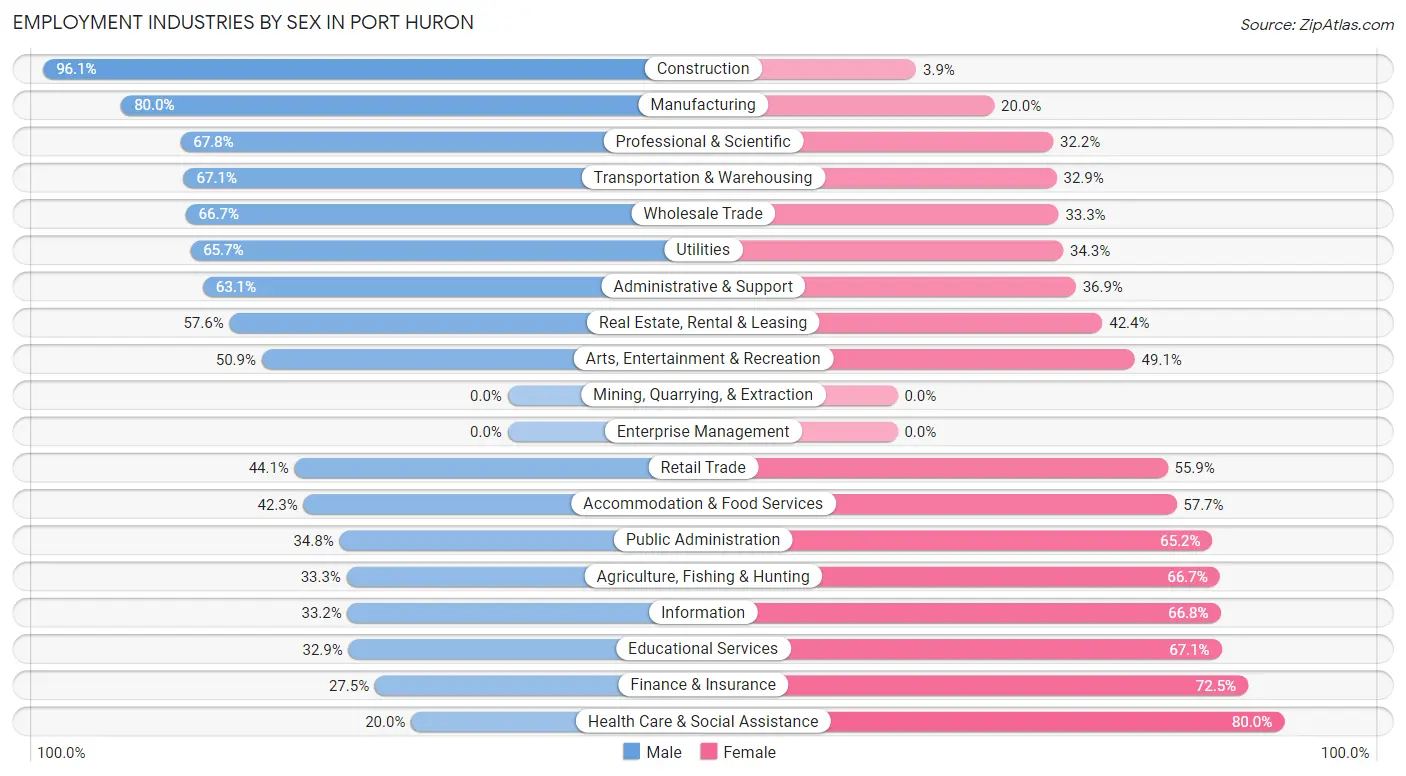
Employment Industries by Sex in Port Huron
The Port Huron industries that see more men than women are Construction (96.1%), Manufacturing (80.0%), and Professional & Scientific (67.8%), whereas the industries that tend to have a higher number of women are Health Care & Social Assistance (80.0%), Finance & Insurance (72.5%), and Educational Services (67.1%).
| Industry | Male | Female |
| Agriculture, Fishing & Hunting | 27 (33.3%) | 54 (66.7%) |
| Mining, Quarrying, & Extraction | 0 (0.0%) | 0 (0.0%) |
| Construction | 498 (96.1%) | 20 (3.9%) |
| Manufacturing | 1,992 (80.0%) | 498 (20.0%) |
| Wholesale Trade | 84 (66.7%) | 42 (33.3%) |
| Retail Trade | 877 (44.1%) | 1,112 (55.9%) |
| Transportation & Warehousing | 165 (67.1%) | 81 (32.9%) |
| Utilities | 69 (65.7%) | 36 (34.3%) |
| Information | 62 (33.2%) | 125 (66.8%) |
| Finance & Insurance | 78 (27.5%) | 206 (72.5%) |
| Real Estate, Rental & Leasing | 91 (57.6%) | 67 (42.4%) |
| Professional & Scientific | 164 (67.8%) | 78 (32.2%) |
| Enterprise Management | 0 (0.0%) | 0 (0.0%) |
| Administrative & Support | 289 (63.1%) | 169 (36.9%) |
| Educational Services | 195 (32.9%) | 397 (67.1%) |
| Health Care & Social Assistance | 407 (20.0%) | 1,631 (80.0%) |
| Arts, Entertainment & Recreation | 142 (50.9%) | 137 (49.1%) |
| Accommodation & Food Services | 574 (42.3%) | 784 (57.7%) |
| Public Administration | 148 (34.8%) | 277 (65.2%) |
| Total | 6,325 (50.6%) | 6,186 (49.4%) |
Education in Port Huron
School Enrollment in Port Huron
The most common levels of schooling among the 6,265 students in Port Huron are high school (1,751 | 28.0%), middle school (1,459 | 23.3%), and elementary school (1,329 | 21.2%).
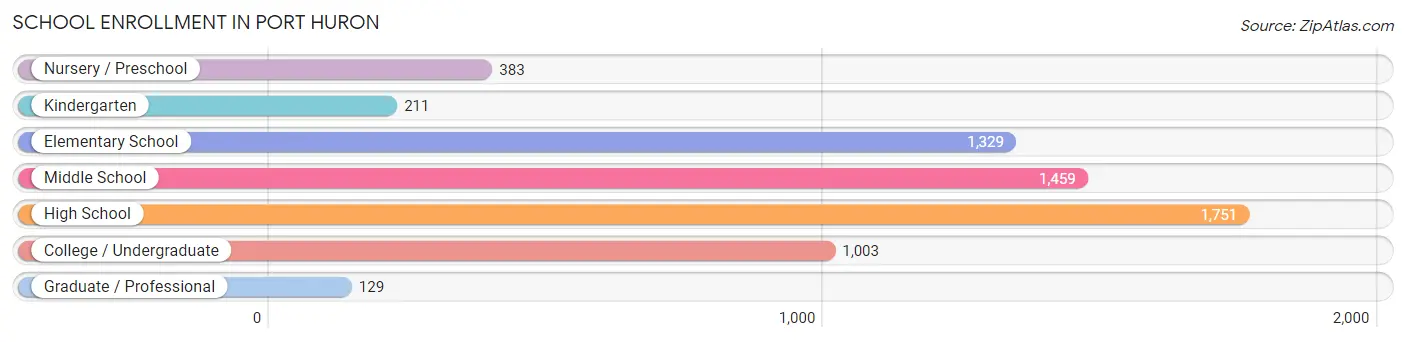
| School Level | # Students | % Students |
| Nursery / Preschool | 383 | 6.1% |
| Kindergarten | 211 | 3.4% |
| Elementary School | 1,329 | 21.2% |
| Middle School | 1,459 | 23.3% |
| High School | 1,751 | 28.0% |
| College / Undergraduate | 1,003 | 16.0% |
| Graduate / Professional | 129 | 2.1% |
| Total | 6,265 | 100.0% |
School Enrollment by Age by Funding Source in Port Huron
Out of a total of 6,265 students who are enrolled in schools in Port Huron, 545 (8.7%) attend a private institution, while the remaining 5,720 (91.3%) are enrolled in public schools. The age group of 35 years and over has the highest likelihood of being enrolled in private schools, with 121 (41.2% in the age bracket) enrolled. Conversely, the age group of 20 to 24 year olds has the lowest likelihood of being enrolled in a private school, with 494 (98.8% in the age bracket) attending a public institution.
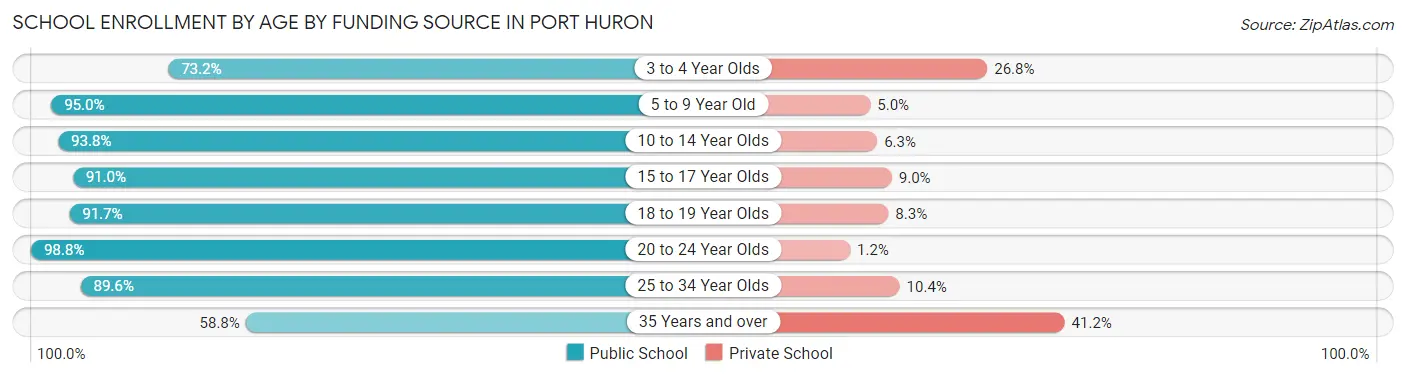
| Age Bracket | Public School | Private School |
| 3 to 4 Year Olds | 156 (73.2%) | 57 (26.8%) |
| 5 to 9 Year Old | 1,509 (95.0%) | 79 (5.0%) |
| 10 to 14 Year Olds | 1,606 (93.8%) | 107 (6.2%) |
| 15 to 17 Year Olds | 1,015 (91.0%) | 100 (9.0%) |
| 18 to 19 Year Olds | 473 (91.7%) | 43 (8.3%) |
| 20 to 24 Year Olds | 494 (98.8%) | 6 (1.2%) |
| 25 to 34 Year Olds | 292 (89.6%) | 34 (10.4%) |
| 35 Years and over | 173 (58.8%) | 121 (41.2%) |
| Total | 5,720 (91.3%) | 545 (8.7%) |
Educational Attainment by Field of Study in Port Huron
Business (813 | 20.1%), education (713 | 17.6%), arts & humanities (395 | 9.8%), science & technology (360 | 8.9%), and psychology (296 | 7.3%) are the most common fields of study among 4,048 individuals in Port Huron who have obtained a bachelor's degree or higher.
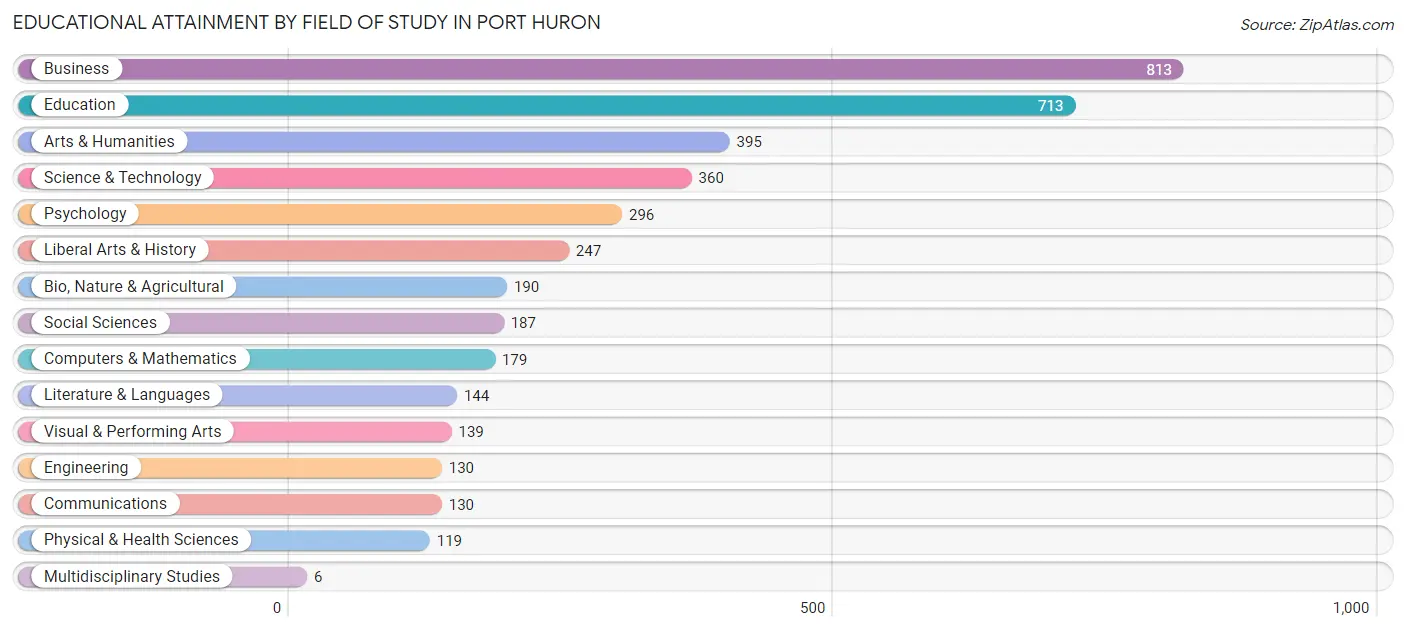
| Field of Study | # Graduates | % Graduates |
| Computers & Mathematics | 179 | 4.4% |
| Bio, Nature & Agricultural | 190 | 4.7% |
| Physical & Health Sciences | 119 | 2.9% |
| Psychology | 296 | 7.3% |
| Social Sciences | 187 | 4.6% |
| Engineering | 130 | 3.2% |
| Multidisciplinary Studies | 6 | 0.2% |
| Science & Technology | 360 | 8.9% |
| Business | 813 | 20.1% |
| Education | 713 | 17.6% |
| Literature & Languages | 144 | 3.6% |
| Liberal Arts & History | 247 | 6.1% |
| Visual & Performing Arts | 139 | 3.4% |
| Communications | 130 | 3.2% |
| Arts & Humanities | 395 | 9.8% |
| Total | 4,048 | 100.0% |
Transportation & Commute in Port Huron
Vehicle Availability by Sex in Port Huron
The most prevalent vehicle ownership categories in Port Huron are males with 2 vehicles (2,980, accounting for 48.3%) and females with 2 vehicles (2,225, making up 49.8%).
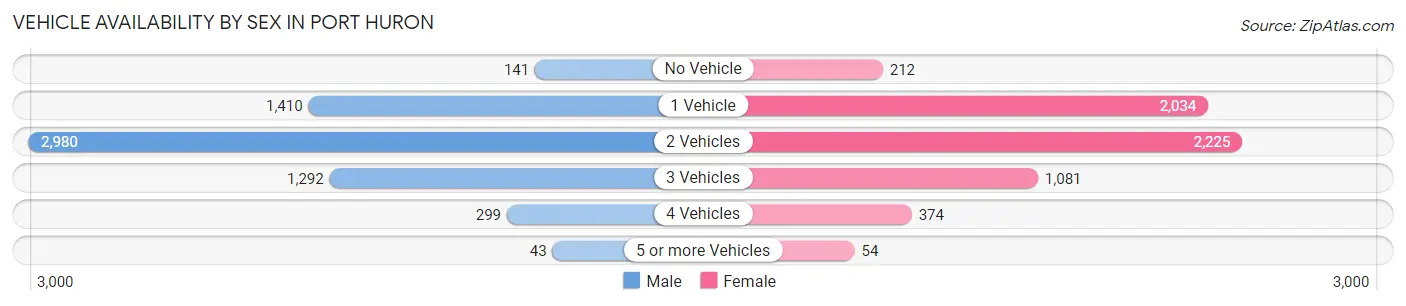
| Vehicles Available | Male | Female |
| No Vehicle | 141 (2.3%) | 212 (3.5%) |
| 1 Vehicle | 1,410 (22.9%) | 2,034 (34.0%) |
| 2 Vehicles | 2,980 (48.3%) | 2,225 (37.2%) |
| 3 Vehicles | 1,292 (21.0%) | 1,081 (18.1%) |
| 4 Vehicles | 299 (4.9%) | 374 (6.2%) |
| 5 or more Vehicles | 43 (0.7%) | 54 (0.9%) |
| Total | 6,165 (100.0%) | 5,980 (100.0%) |
Commute Time in Port Huron
The most frequently occuring commute durations in Port Huron are 10 to 14 minutes (2,263 commuters, 19.5%), 5 to 9 minutes (2,174 commuters, 18.7%), and 15 to 19 minutes (2,127 commuters, 18.3%).
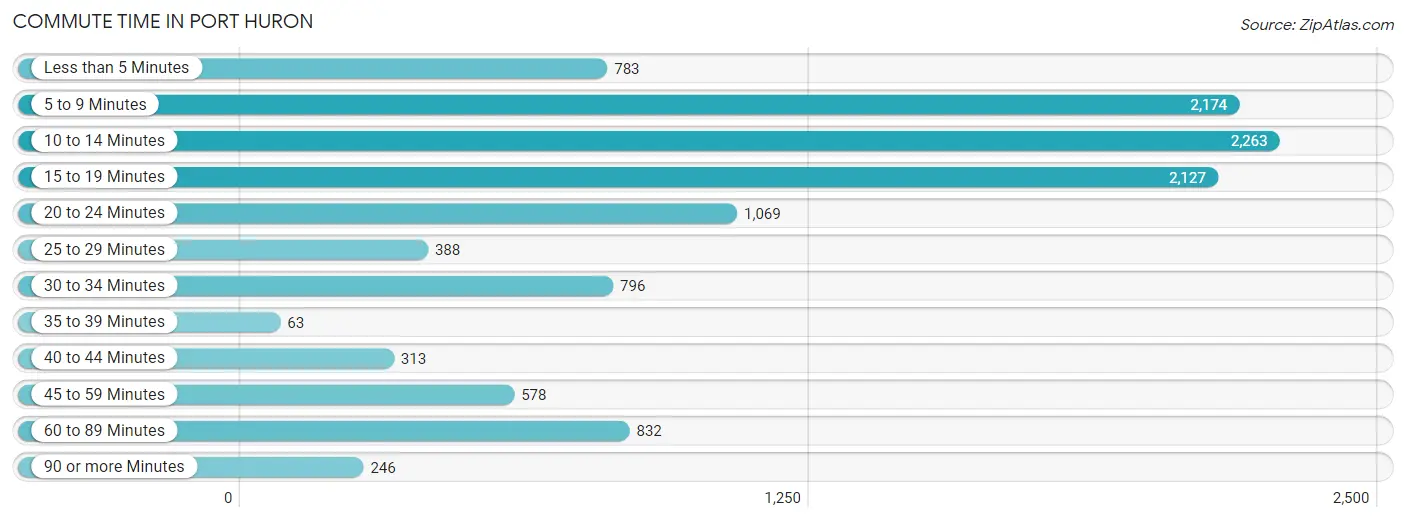
| Commute Time | # Commuters | % Commuters |
| Less than 5 Minutes | 783 | 6.7% |
| 5 to 9 Minutes | 2,174 | 18.7% |
| 10 to 14 Minutes | 2,263 | 19.5% |
| 15 to 19 Minutes | 2,127 | 18.3% |
| 20 to 24 Minutes | 1,069 | 9.2% |
| 25 to 29 Minutes | 388 | 3.3% |
| 30 to 34 Minutes | 796 | 6.8% |
| 35 to 39 Minutes | 63 | 0.5% |
| 40 to 44 Minutes | 313 | 2.7% |
| 45 to 59 Minutes | 578 | 5.0% |
| 60 to 89 Minutes | 832 | 7.1% |
| 90 or more Minutes | 246 | 2.1% |
Commute Time by Sex in Port Huron
The most common commute times in Port Huron are 15 to 19 minutes (1,263 commuters, 20.9%) for males and 10 to 14 minutes (1,271 commuters, 22.7%) for females.
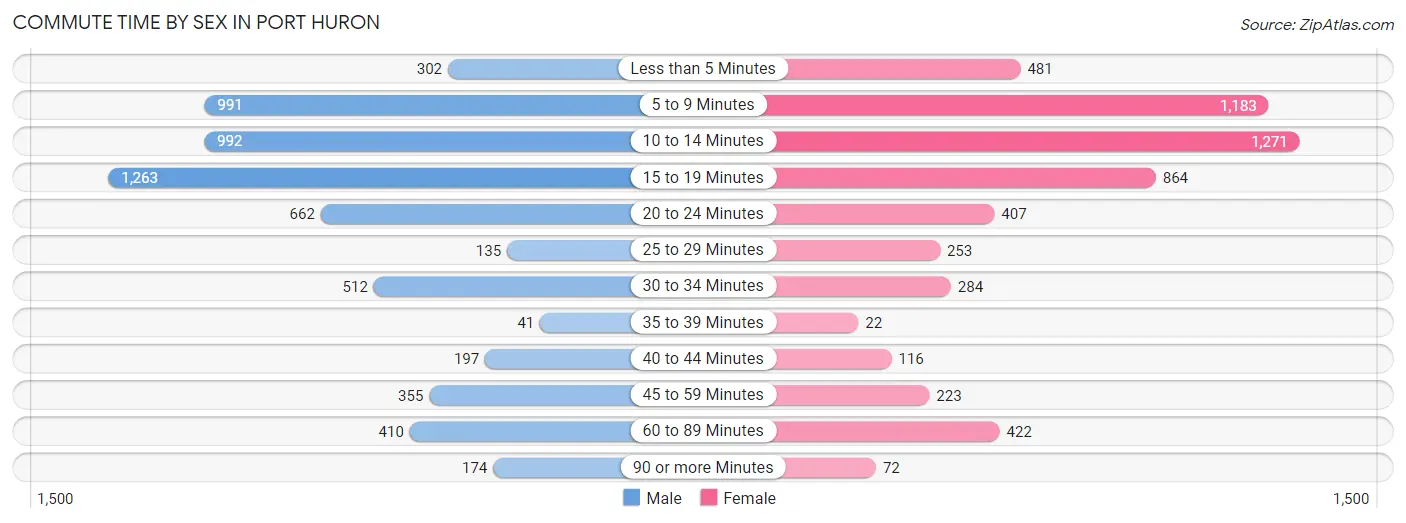
| Commute Time | Male | Female |
| Less than 5 Minutes | 302 (5.0%) | 481 (8.6%) |
| 5 to 9 Minutes | 991 (16.4%) | 1,183 (21.1%) |
| 10 to 14 Minutes | 992 (16.4%) | 1,271 (22.7%) |
| 15 to 19 Minutes | 1,263 (20.9%) | 864 (15.4%) |
| 20 to 24 Minutes | 662 (11.0%) | 407 (7.3%) |
| 25 to 29 Minutes | 135 (2.2%) | 253 (4.5%) |
| 30 to 34 Minutes | 512 (8.5%) | 284 (5.1%) |
| 35 to 39 Minutes | 41 (0.7%) | 22 (0.4%) |
| 40 to 44 Minutes | 197 (3.3%) | 116 (2.1%) |
| 45 to 59 Minutes | 355 (5.9%) | 223 (4.0%) |
| 60 to 89 Minutes | 410 (6.8%) | 422 (7.5%) |
| 90 or more Minutes | 174 (2.9%) | 72 (1.3%) |
Time of Departure to Work by Sex in Port Huron
The most frequent times of departure to work in Port Huron are 12:00 PM to 3:59 PM (779, 12.9%) for males and 7:30 AM to 7:59 AM (785, 14.0%) for females.
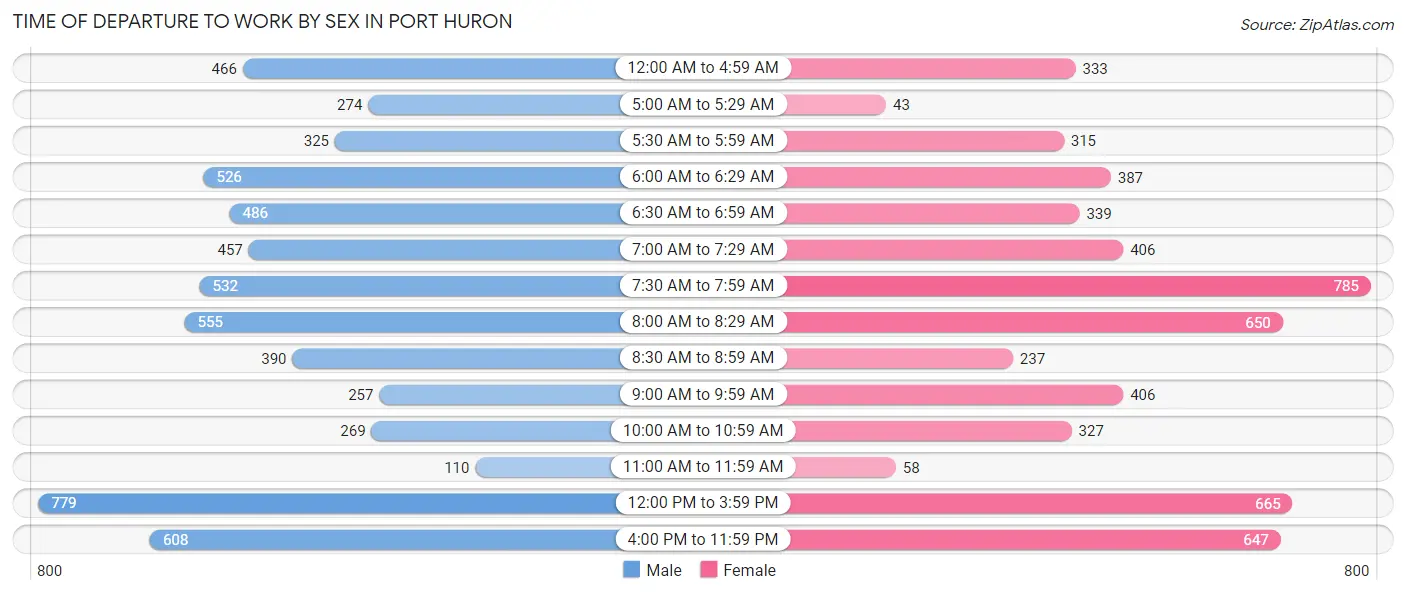
| Time of Departure | Male | Female |
| 12:00 AM to 4:59 AM | 466 (7.7%) | 333 (5.9%) |
| 5:00 AM to 5:29 AM | 274 (4.5%) | 43 (0.8%) |
| 5:30 AM to 5:59 AM | 325 (5.4%) | 315 (5.6%) |
| 6:00 AM to 6:29 AM | 526 (8.7%) | 387 (6.9%) |
| 6:30 AM to 6:59 AM | 486 (8.1%) | 339 (6.1%) |
| 7:00 AM to 7:29 AM | 457 (7.6%) | 406 (7.2%) |
| 7:30 AM to 7:59 AM | 532 (8.8%) | 785 (14.0%) |
| 8:00 AM to 8:29 AM | 555 (9.2%) | 650 (11.6%) |
| 8:30 AM to 8:59 AM | 390 (6.5%) | 237 (4.2%) |
| 9:00 AM to 9:59 AM | 257 (4.3%) | 406 (7.2%) |
| 10:00 AM to 10:59 AM | 269 (4.5%) | 327 (5.8%) |
| 11:00 AM to 11:59 AM | 110 (1.8%) | 58 (1.0%) |
| 12:00 PM to 3:59 PM | 779 (12.9%) | 665 (11.9%) |
| 4:00 PM to 11:59 PM | 608 (10.1%) | 647 (11.6%) |
| Total | 6,034 (100.0%) | 5,598 (100.0%) |
Housing Occupancy in Port Huron
Occupancy by Ownership in Port Huron
Of the total 12,325 dwellings in Port Huron, owner-occupied units account for 7,533 (61.1%), while renter-occupied units make up 4,792 (38.9%).
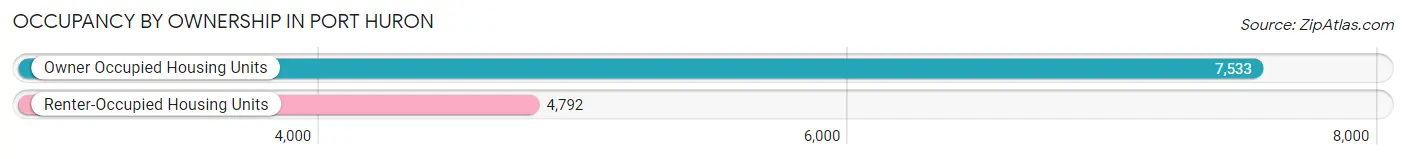
| Occupancy | # Housing Units | % Housing Units |
| Owner Occupied Housing Units | 7,533 | 61.1% |
| Renter-Occupied Housing Units | 4,792 | 38.9% |
| Total Occupied Housing Units | 12,325 | 100.0% |
Occupancy by Household Size in Port Huron
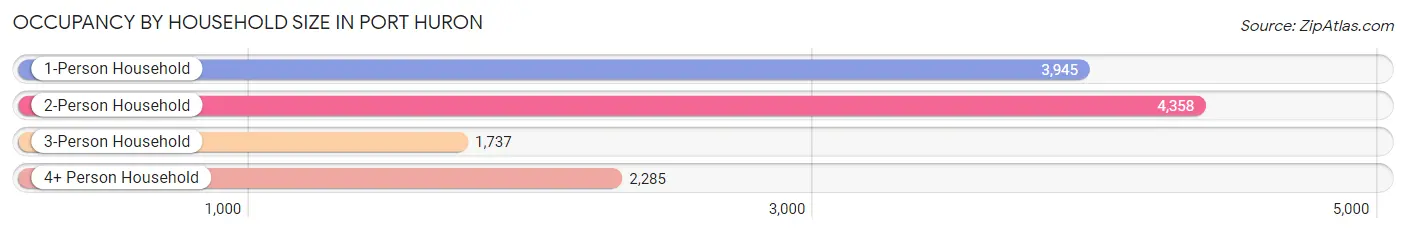
| Household Size | # Housing Units | % Housing Units |
| 1-Person Household | 3,945 | 32.0% |
| 2-Person Household | 4,358 | 35.4% |
| 3-Person Household | 1,737 | 14.1% |
| 4+ Person Household | 2,285 | 18.5% |
| Total Housing Units | 12,325 | 100.0% |
Occupancy by Ownership by Household Size in Port Huron
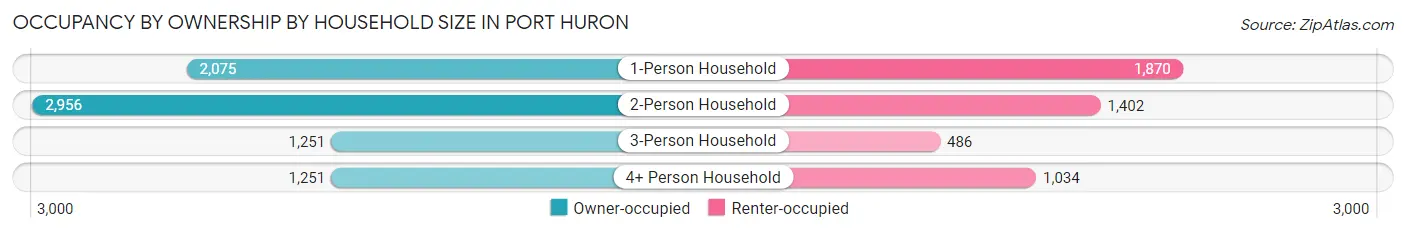
| Household Size | Owner-occupied | Renter-occupied |
| 1-Person Household | 2,075 (52.6%) | 1,870 (47.4%) |
| 2-Person Household | 2,956 (67.8%) | 1,402 (32.2%) |
| 3-Person Household | 1,251 (72.0%) | 486 (28.0%) |
| 4+ Person Household | 1,251 (54.7%) | 1,034 (45.3%) |
| Total Housing Units | 7,533 (61.1%) | 4,792 (38.9%) |
Occupancy by Educational Attainment in Port Huron
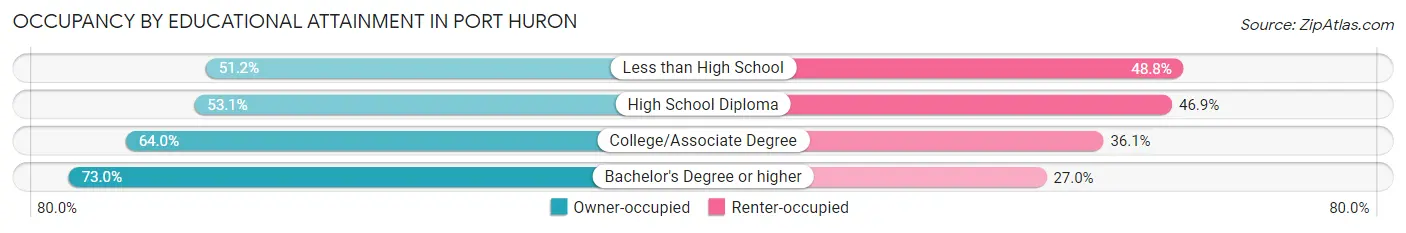
| Household Size | Owner-occupied | Renter-occupied |
| Less than High School | 598 (51.2%) | 569 (48.8%) |
| High School Diploma | 2,073 (53.1%) | 1,833 (46.9%) |
| College/Associate Degree | 3,051 (63.9%) | 1,720 (36.0%) |
| Bachelor's Degree or higher | 1,811 (73.0%) | 670 (27.0%) |
Occupancy by Age of Householder in Port Huron
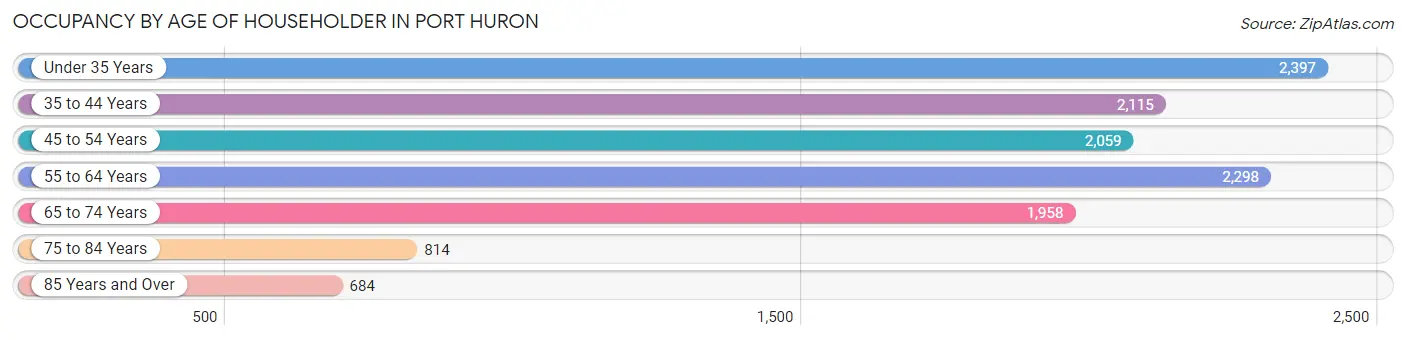
| Age Bracket | # Households | % Households |
| Under 35 Years | 2,397 | 19.5% |
| 35 to 44 Years | 2,115 | 17.2% |
| 45 to 54 Years | 2,059 | 16.7% |
| 55 to 64 Years | 2,298 | 18.6% |
| 65 to 74 Years | 1,958 | 15.9% |
| 75 to 84 Years | 814 | 6.6% |
| 85 Years and Over | 684 | 5.6% |
| Total | 12,325 | 100.0% |
Housing Finances in Port Huron
Median Income by Occupancy in Port Huron
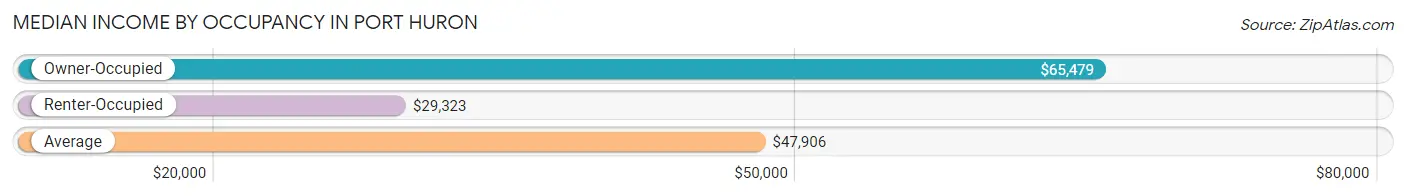
| Occupancy Type | # Households | Median Income |
| Owner-Occupied | 7,533 (61.1%) | $65,479 |
| Renter-Occupied | 4,792 (38.9%) | $29,323 |
| Average | 12,325 (100.0%) | $47,906 |
Occupancy by Householder Income Bracket in Port Huron
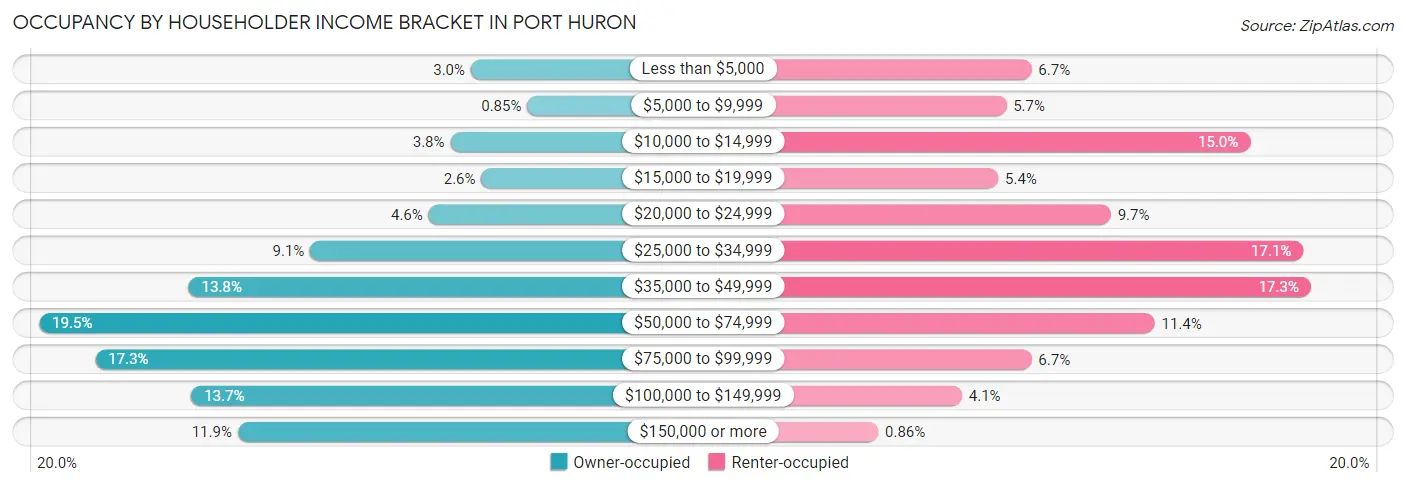
| Income Bracket | Owner-occupied | Renter-occupied |
| Less than $5,000 | 226 (3.0%) | 321 (6.7%) |
| $5,000 to $9,999 | 64 (0.9%) | 275 (5.7%) |
| $10,000 to $14,999 | 285 (3.8%) | 720 (15.0%) |
| $15,000 to $19,999 | 196 (2.6%) | 260 (5.4%) |
| $20,000 to $24,999 | 347 (4.6%) | 466 (9.7%) |
| $25,000 to $34,999 | 687 (9.1%) | 817 (17.1%) |
| $35,000 to $49,999 | 1,036 (13.8%) | 831 (17.3%) |
| $50,000 to $74,999 | 1,465 (19.5%) | 546 (11.4%) |
| $75,000 to $99,999 | 1,304 (17.3%) | 321 (6.7%) |
| $100,000 to $149,999 | 1,028 (13.7%) | 194 (4.1%) |
| $150,000 or more | 895 (11.9%) | 41 (0.9%) |
| Total | 7,533 (100.0%) | 4,792 (100.0%) |
Monthly Housing Cost Tiers in Port Huron
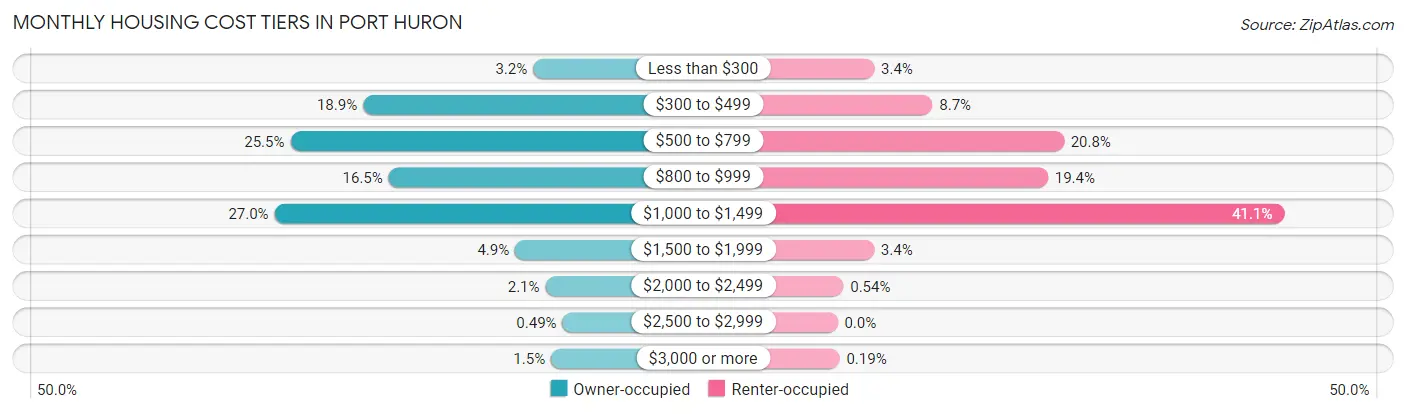
| Monthly Cost | Owner-occupied | Renter-occupied |
| Less than $300 | 240 (3.2%) | 162 (3.4%) |
| $300 to $499 | 1,420 (18.9%) | 419 (8.7%) |
| $500 to $799 | 1,924 (25.5%) | 998 (20.8%) |
| $800 to $999 | 1,242 (16.5%) | 928 (19.4%) |
| $1,000 to $1,499 | 2,034 (27.0%) | 1,971 (41.1%) |
| $1,500 to $1,999 | 365 (4.9%) | 161 (3.4%) |
| $2,000 to $2,499 | 155 (2.1%) | 26 (0.5%) |
| $2,500 to $2,999 | 37 (0.5%) | 0 (0.0%) |
| $3,000 or more | 116 (1.5%) | 9 (0.2%) |
| Total | 7,533 (100.0%) | 4,792 (100.0%) |
Physical Housing Characteristics in Port Huron
Housing Structures in Port Huron
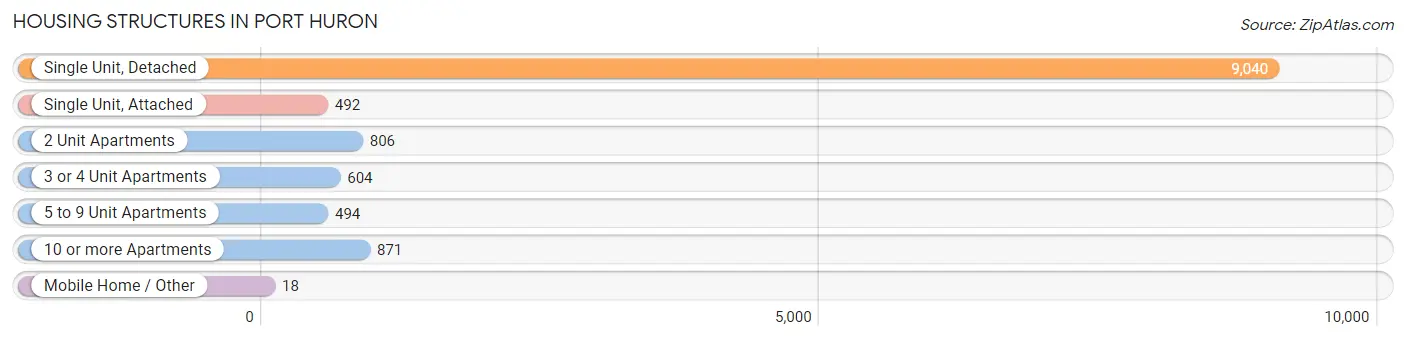
| Structure Type | # Housing Units | % Housing Units |
| Single Unit, Detached | 9,040 | 73.4% |
| Single Unit, Attached | 492 | 4.0% |
| 2 Unit Apartments | 806 | 6.5% |
| 3 or 4 Unit Apartments | 604 | 4.9% |
| 5 to 9 Unit Apartments | 494 | 4.0% |
| 10 or more Apartments | 871 | 7.1% |
| Mobile Home / Other | 18 | 0.2% |
| Total | 12,325 | 100.0% |
Housing Structures by Occupancy in Port Huron
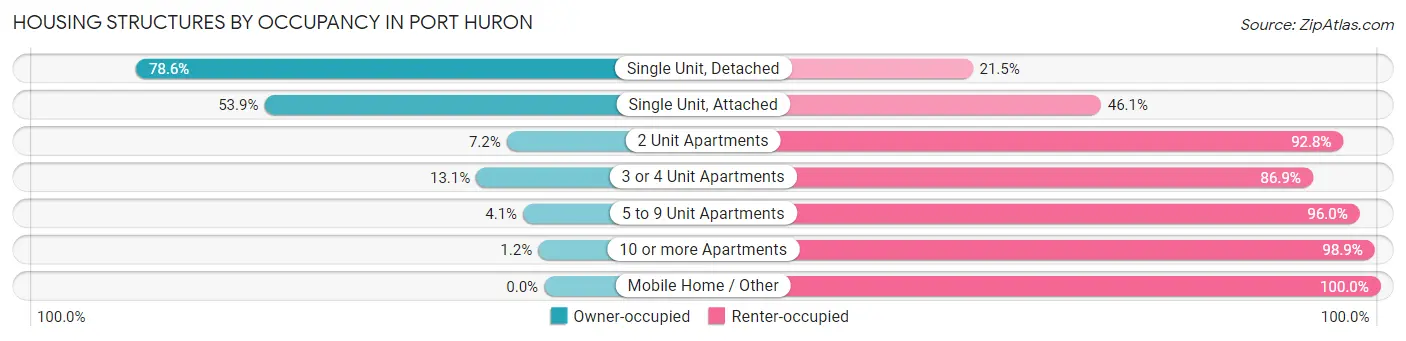
| Structure Type | Owner-occupied | Renter-occupied |
| Single Unit, Detached | 7,101 (78.5%) | 1,939 (21.4%) |
| Single Unit, Attached | 265 (53.9%) | 227 (46.1%) |
| 2 Unit Apartments | 58 (7.2%) | 748 (92.8%) |
| 3 or 4 Unit Apartments | 79 (13.1%) | 525 (86.9%) |
| 5 to 9 Unit Apartments | 20 (4.1%) | 474 (96.0%) |
| 10 or more Apartments | 10 (1.1%) | 861 (98.9%) |
| Mobile Home / Other | 0 (0.0%) | 18 (100.0%) |
| Total | 7,533 (61.1%) | 4,792 (38.9%) |
Housing Structures by Number of Rooms in Port Huron
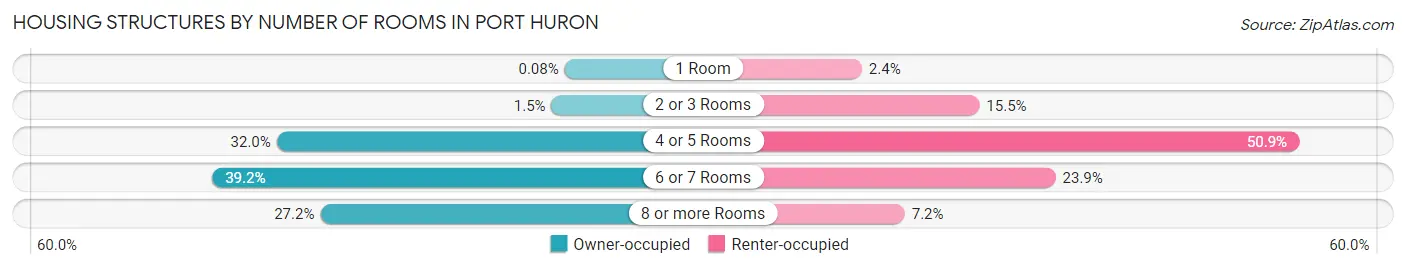
| Number of Rooms | Owner-occupied | Renter-occupied |
| 1 Room | 6 (0.1%) | 117 (2.4%) |
| 2 or 3 Rooms | 115 (1.5%) | 742 (15.5%) |
| 4 or 5 Rooms | 2,413 (32.0%) | 2,441 (50.9%) |
| 6 or 7 Rooms | 2,951 (39.2%) | 1,147 (23.9%) |
| 8 or more Rooms | 2,048 (27.2%) | 345 (7.2%) |
| Total | 7,533 (100.0%) | 4,792 (100.0%) |
Housing Structure by Heating Type in Port Huron
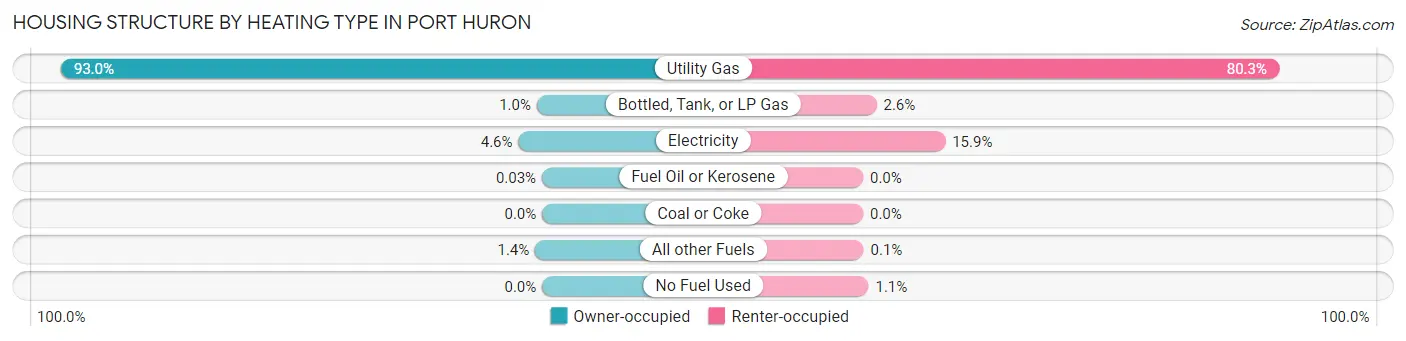
| Heating Type | Owner-occupied | Renter-occupied |
| Utility Gas | 7,006 (93.0%) | 3,850 (80.3%) |
| Bottled, Tank, or LP Gas | 77 (1.0%) | 125 (2.6%) |
| Electricity | 346 (4.6%) | 761 (15.9%) |
| Fuel Oil or Kerosene | 2 (0.0%) | 0 (0.0%) |
| Coal or Coke | 0 (0.0%) | 0 (0.0%) |
| All other Fuels | 102 (1.3%) | 5 (0.1%) |
| No Fuel Used | 0 (0.0%) | 51 (1.1%) |
| Total | 7,533 (100.0%) | 4,792 (100.0%) |
Household Vehicle Usage in Port Huron
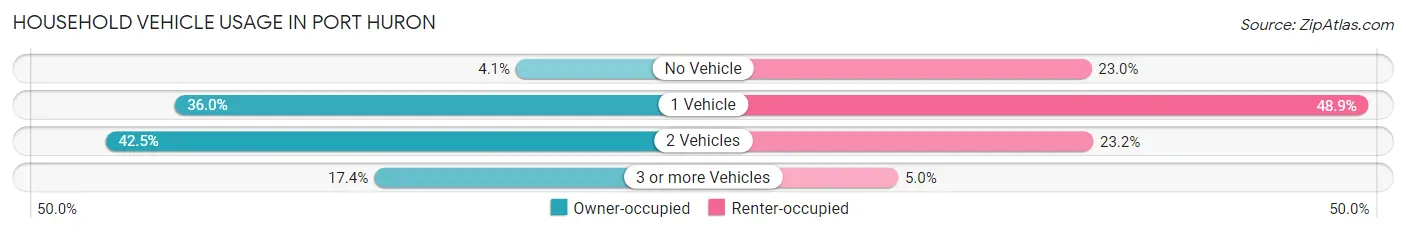
| Vehicles per Household | Owner-occupied | Renter-occupied |
| No Vehicle | 312 (4.1%) | 1,102 (23.0%) |
| 1 Vehicle | 2,714 (36.0%) | 2,343 (48.9%) |
| 2 Vehicles | 3,198 (42.4%) | 1,110 (23.2%) |
| 3 or more Vehicles | 1,309 (17.4%) | 237 (5.0%) |
| Total | 7,533 (100.0%) | 4,792 (100.0%) |
Real Estate & Mortgages in Port Huron
Real Estate and Mortgage Overview in Port Huron
| Characteristic | Without Mortgage | With Mortgage |
| Housing Units | 3,321 | 4,212 |
| Median Property Value | $116,400 | $125,200 |
| Median Household Income | $58,239 | $508 |
| Monthly Housing Costs | $507 | $109 |
| Real Estate Taxes | $1,820 | $125 |
Property Value by Mortgage Status in Port Huron
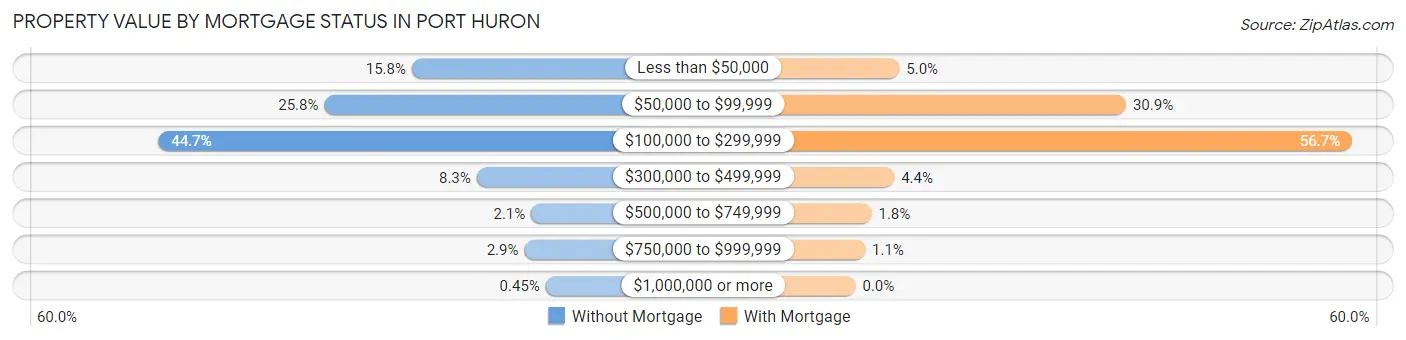
| Property Value | Without Mortgage | With Mortgage |
| Less than $50,000 | 523 (15.8%) | 211 (5.0%) |
| $50,000 to $99,999 | 855 (25.8%) | 1,302 (30.9%) |
| $100,000 to $299,999 | 1,485 (44.7%) | 2,390 (56.7%) |
| $300,000 to $499,999 | 277 (8.3%) | 186 (4.4%) |
| $500,000 to $749,999 | 70 (2.1%) | 77 (1.8%) |
| $750,000 to $999,999 | 96 (2.9%) | 46 (1.1%) |
| $1,000,000 or more | 15 (0.4%) | 0 (0.0%) |
| Total | 3,321 (100.0%) | 4,212 (100.0%) |
Household Income by Mortgage Status in Port Huron
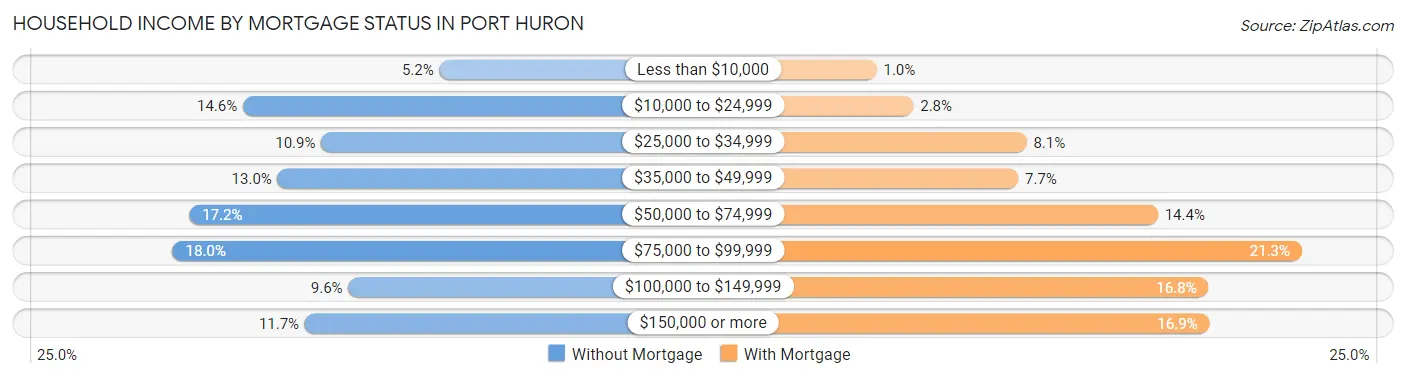
| Household Income | Without Mortgage | With Mortgage |
| Less than $10,000 | 174 (5.2%) | 42 (1.0%) |
| $10,000 to $24,999 | 485 (14.6%) | 116 (2.8%) |
| $25,000 to $34,999 | 361 (10.9%) | 343 (8.1%) |
| $35,000 to $49,999 | 430 (13.0%) | 326 (7.7%) |
| $50,000 to $74,999 | 570 (17.2%) | 606 (14.4%) |
| $75,000 to $99,999 | 596 (17.9%) | 895 (21.2%) |
| $100,000 to $149,999 | 318 (9.6%) | 708 (16.8%) |
| $150,000 or more | 387 (11.7%) | 710 (16.9%) |
| Total | 3,321 (100.0%) | 4,212 (100.0%) |
Property Value to Household Income Ratio in Port Huron
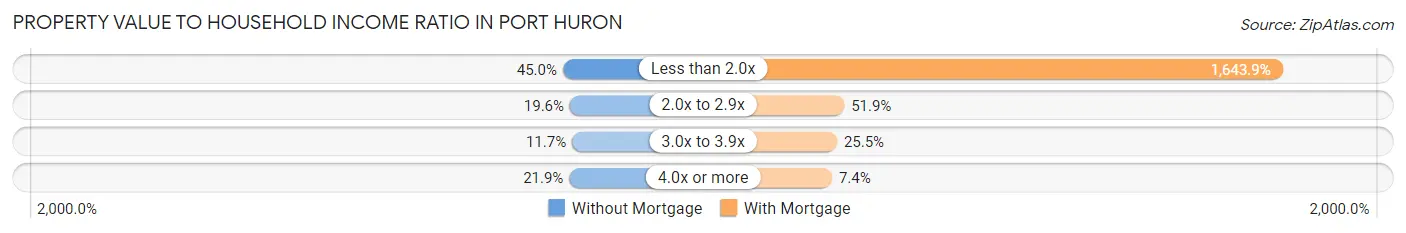
| Value-to-Income Ratio | Without Mortgage | With Mortgage |
| Less than 2.0x | 1,494 (45.0%) | 69,240 (1,643.9%) |
| 2.0x to 2.9x | 650 (19.6%) | 2,187 (51.9%) |
| 3.0x to 3.9x | 390 (11.7%) | 1,075 (25.5%) |
| 4.0x or more | 726 (21.9%) | 311 (7.4%) |
| Total | 3,321 (100.0%) | 4,212 (100.0%) |
Real Estate Taxes by Mortgage Status in Port Huron
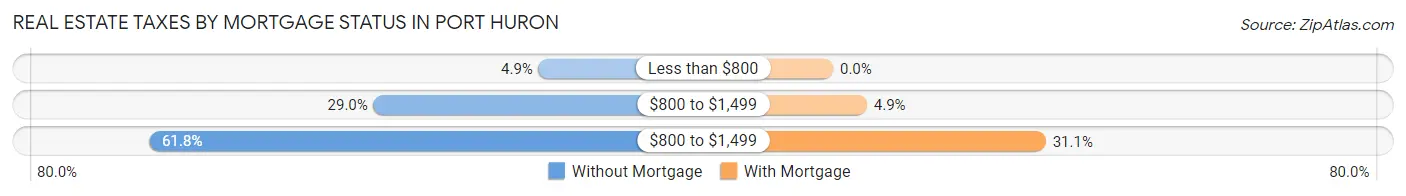
| Property Taxes | Without Mortgage | With Mortgage |
| Less than $800 | 162 (4.9%) | 0 (0.0%) |
| $800 to $1,499 | 963 (29.0%) | 208 (4.9%) |
| $800 to $1,499 | 2,053 (61.8%) | 1,309 (31.1%) |
| Total | 3,321 (100.0%) | 4,212 (100.0%) |
Health & Disability in Port Huron
Health Insurance Coverage by Age in Port Huron
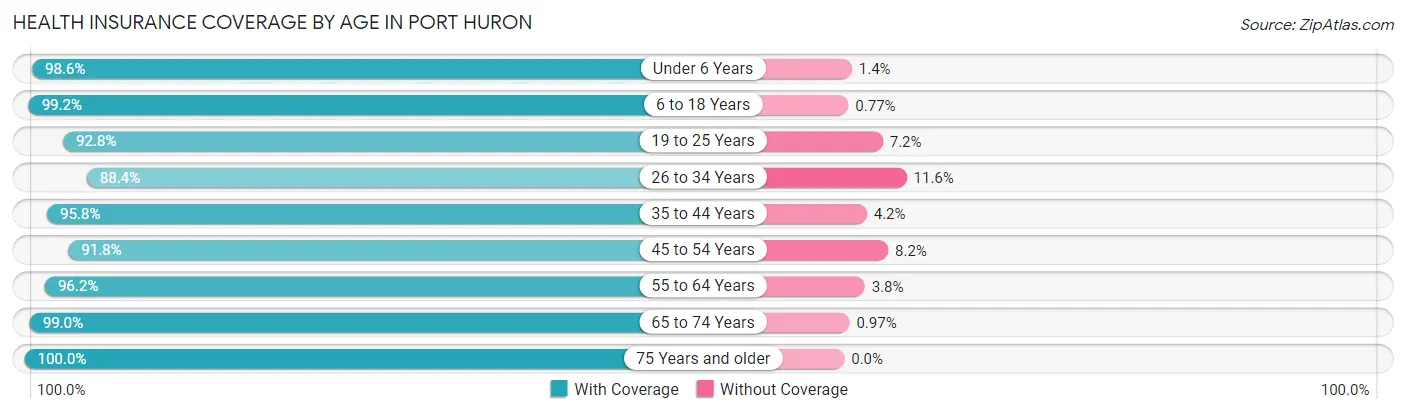
| Age Bracket | With Coverage | Without Coverage |
| Under 6 Years | 1,820 (98.6%) | 26 (1.4%) |
| 6 to 18 Years | 4,892 (99.2%) | 38 (0.8%) |
| 19 to 25 Years | 2,302 (92.8%) | 178 (7.2%) |
| 26 to 34 Years | 3,406 (88.4%) | 448 (11.6%) |
| 35 to 44 Years | 3,495 (95.8%) | 153 (4.2%) |
| 45 to 54 Years | 3,023 (91.8%) | 269 (8.2%) |
| 55 to 64 Years | 3,531 (96.2%) | 140 (3.8%) |
| 65 to 74 Years | 2,847 (99.0%) | 28 (1.0%) |
| 75 Years and older | 2,012 (100.0%) | 0 (0.0%) |
| Total | 27,328 (95.5%) | 1,280 (4.5%) |
Health Insurance Coverage by Citizenship Status in Port Huron
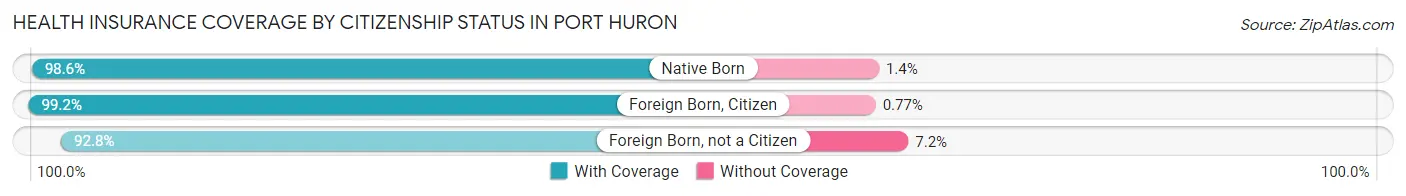
| Citizenship Status | With Coverage | Without Coverage |
| Native Born | 1,820 (98.6%) | 26 (1.4%) |
| Foreign Born, Citizen | 4,892 (99.2%) | 38 (0.8%) |
| Foreign Born, not a Citizen | 2,302 (92.8%) | 178 (7.2%) |
Health Insurance Coverage by Household Income in Port Huron
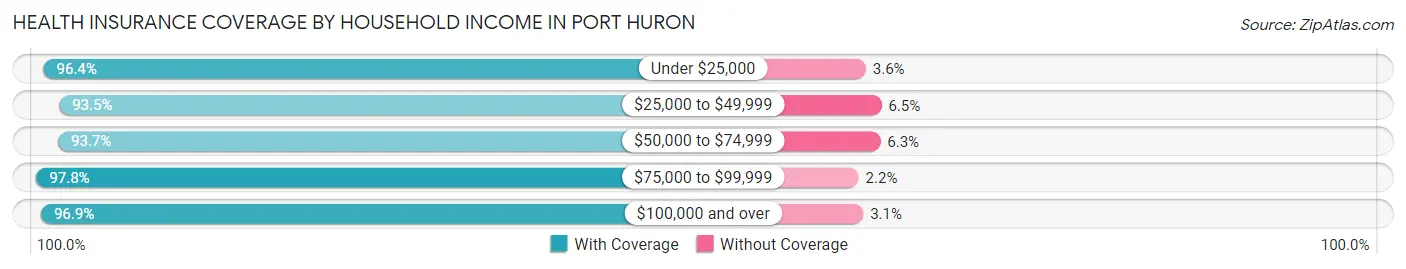
| Household Income | With Coverage | Without Coverage |
| Under $25,000 | 5,676 (96.4%) | 210 (3.6%) |
| $25,000 to $49,999 | 6,831 (93.5%) | 474 (6.5%) |
| $50,000 to $74,999 | 4,669 (93.7%) | 313 (6.3%) |
| $75,000 to $99,999 | 4,009 (97.8%) | 91 (2.2%) |
| $100,000 and over | 5,969 (96.9%) | 190 (3.1%) |
Public vs Private Health Insurance Coverage by Age in Port Huron
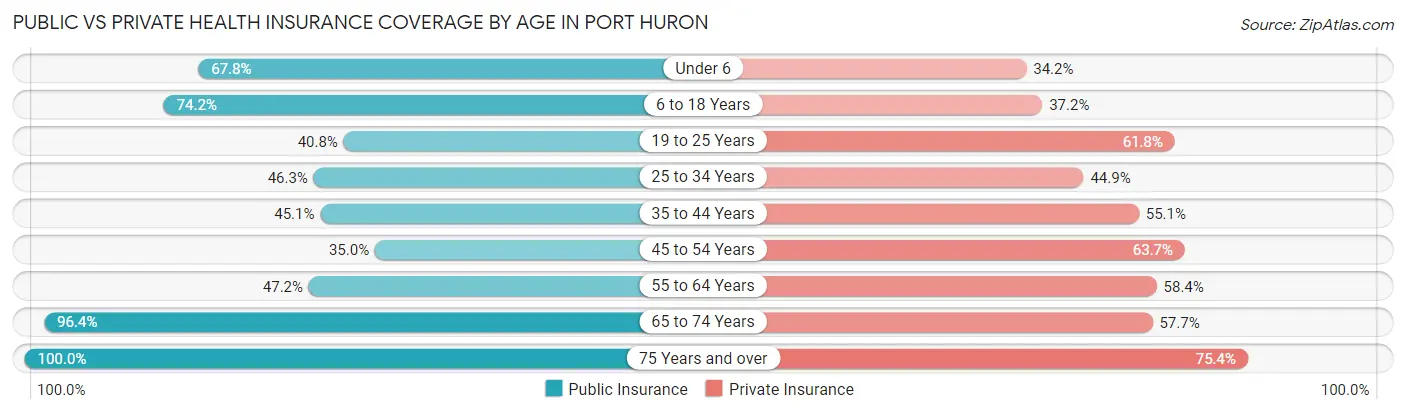
| Age Bracket | Public Insurance | Private Insurance |
| Under 6 | 1,251 (67.8%) | 632 (34.2%) |
| 6 to 18 Years | 3,657 (74.2%) | 1,834 (37.2%) |
| 19 to 25 Years | 1,011 (40.8%) | 1,533 (61.8%) |
| 25 to 34 Years | 1,786 (46.3%) | 1,729 (44.9%) |
| 35 to 44 Years | 1,646 (45.1%) | 2,011 (55.1%) |
| 45 to 54 Years | 1,151 (35.0%) | 2,096 (63.7%) |
| 55 to 64 Years | 1,734 (47.2%) | 2,145 (58.4%) |
| 65 to 74 Years | 2,771 (96.4%) | 1,658 (57.7%) |
| 75 Years and over | 2,012 (100.0%) | 1,516 (75.3%) |
| Total | 17,019 (59.5%) | 15,154 (53.0%) |
Disability Status by Sex by Age in Port Huron
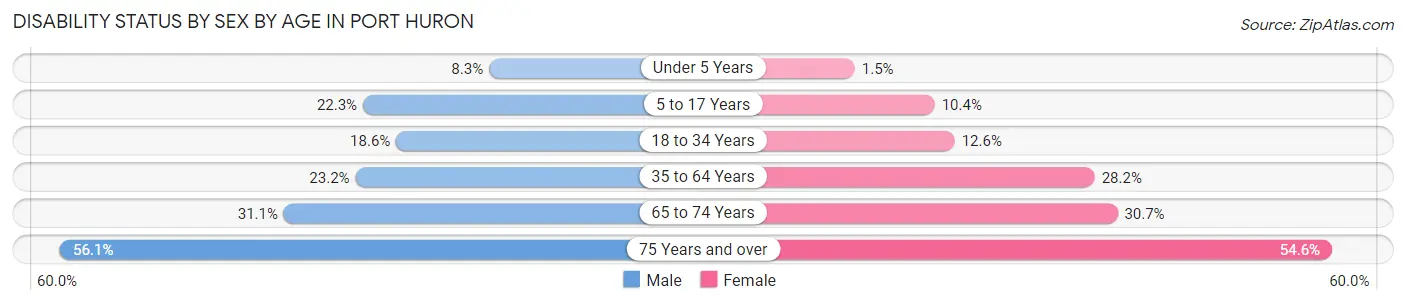
| Age Bracket | Male | Female |
| Under 5 Years | 82 (8.3%) | 9 (1.5%) |
| 5 to 17 Years | 554 (22.3%) | 229 (10.3%) |
| 18 to 34 Years | 674 (18.6%) | 401 (12.6%) |
| 35 to 64 Years | 1,150 (23.2%) | 1,590 (28.2%) |
| 65 to 74 Years | 387 (31.1%) | 501 (30.7%) |
| 75 Years and over | 412 (56.0%) | 697 (54.6%) |
Disability Class by Sex by Age in Port Huron
Disability Class: Hearing Difficulty
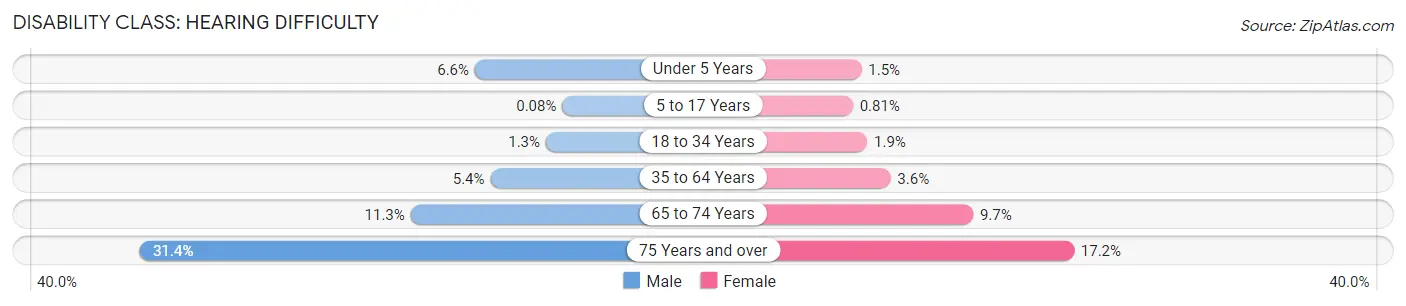
| Age Bracket | Male | Female |
| Under 5 Years | 65 (6.6%) | 9 (1.5%) |
| 5 to 17 Years | 2 (0.1%) | 18 (0.8%) |
| 18 to 34 Years | 47 (1.3%) | 60 (1.9%) |
| 35 to 64 Years | 269 (5.4%) | 204 (3.6%) |
| 65 to 74 Years | 141 (11.3%) | 159 (9.7%) |
| 75 Years and over | 231 (31.4%) | 220 (17.2%) |
Disability Class: Vision Difficulty
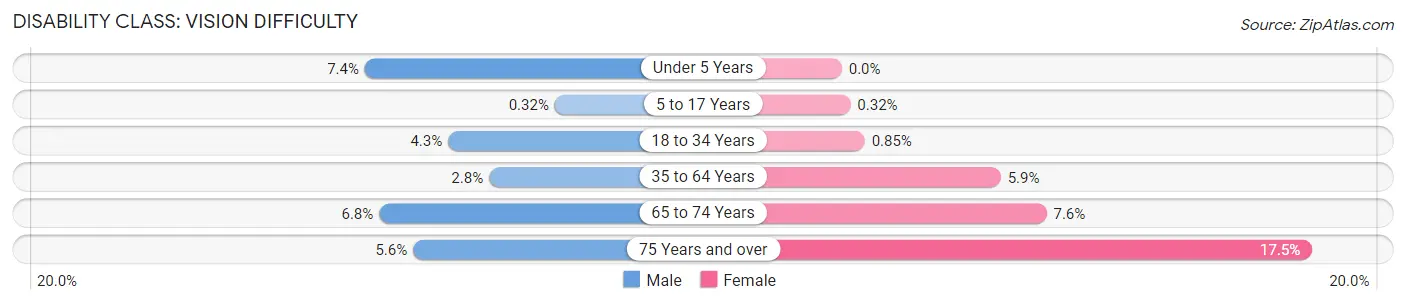
| Age Bracket | Male | Female |
| Under 5 Years | 73 (7.4%) | 0 (0.0%) |
| 5 to 17 Years | 8 (0.3%) | 7 (0.3%) |
| 18 to 34 Years | 155 (4.3%) | 27 (0.9%) |
| 35 to 64 Years | 137 (2.8%) | 333 (5.9%) |
| 65 to 74 Years | 85 (6.8%) | 124 (7.6%) |
| 75 Years and over | 41 (5.6%) | 223 (17.5%) |
Disability Class: Cognitive Difficulty
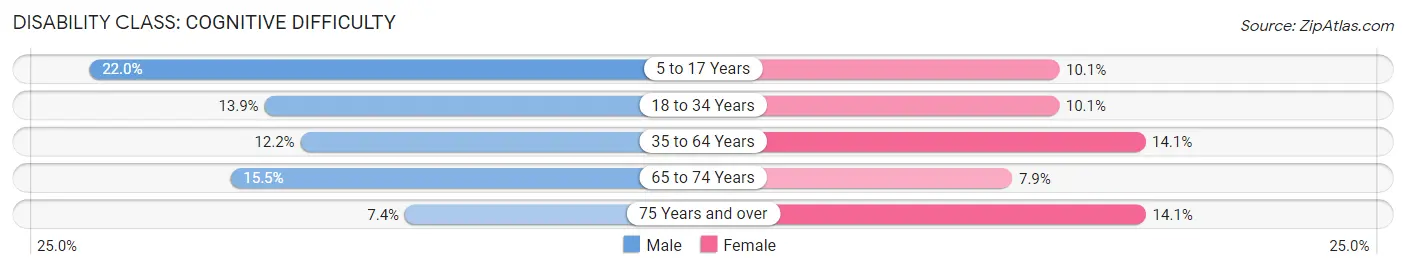
| Age Bracket | Male | Female |
| 5 to 17 Years | 546 (22.0%) | 223 (10.1%) |
| 18 to 34 Years | 502 (13.9%) | 321 (10.1%) |
| 35 to 64 Years | 606 (12.2%) | 794 (14.1%) |
| 65 to 74 Years | 192 (15.4%) | 129 (7.9%) |
| 75 Years and over | 54 (7.3%) | 180 (14.1%) |
Disability Class: Ambulatory Difficulty
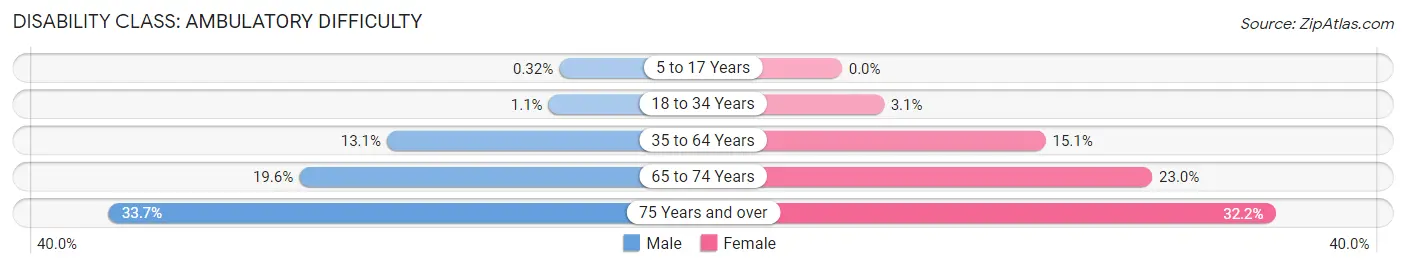
| Age Bracket | Male | Female |
| 5 to 17 Years | 8 (0.3%) | 0 (0.0%) |
| 18 to 34 Years | 40 (1.1%) | 99 (3.1%) |
| 35 to 64 Years | 651 (13.1%) | 854 (15.1%) |
| 65 to 74 Years | 244 (19.6%) | 376 (23.0%) |
| 75 Years and over | 248 (33.7%) | 411 (32.2%) |
Disability Class: Self-Care Difficulty
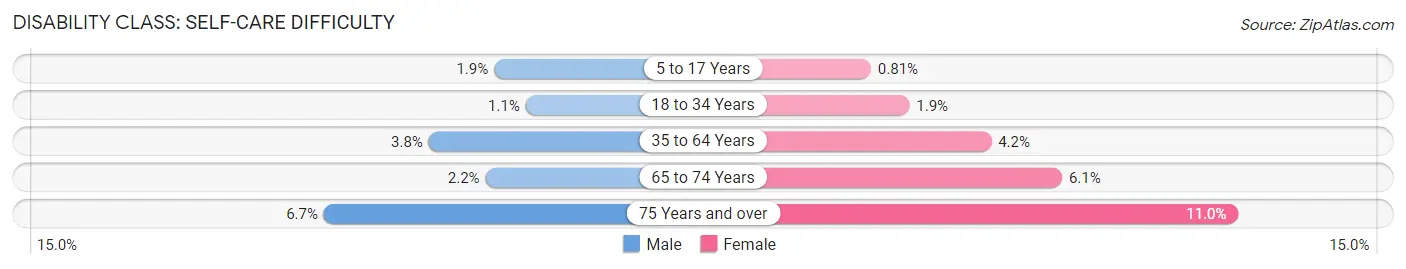
| Age Bracket | Male | Female |
| 5 to 17 Years | 48 (1.9%) | 18 (0.8%) |
| 18 to 34 Years | 38 (1.1%) | 60 (1.9%) |
| 35 to 64 Years | 186 (3.7%) | 235 (4.2%) |
| 65 to 74 Years | 27 (2.2%) | 100 (6.1%) |
| 75 Years and over | 49 (6.7%) | 141 (11.0%) |
Technology Access in Port Huron
Computing Device Access in Port Huron
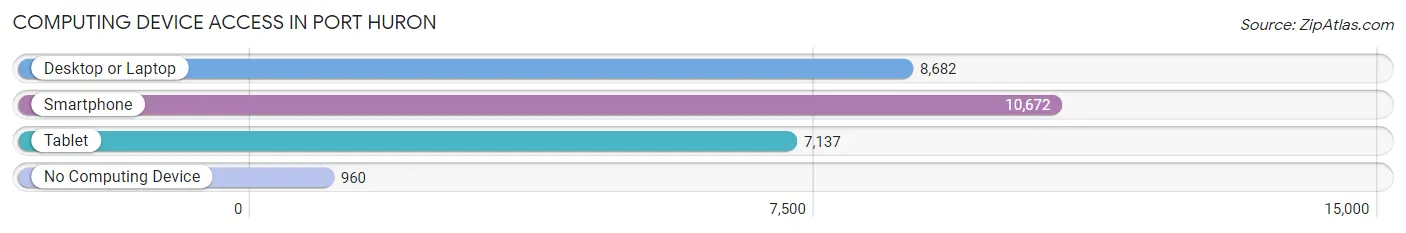
| Device Type | # Households | % Households |
| Desktop or Laptop | 8,682 | 70.4% |
| Smartphone | 10,672 | 86.6% |
| Tablet | 7,137 | 57.9% |
| No Computing Device | 960 | 7.8% |
| Total | 12,325 | 100.0% |
Internet Access in Port Huron
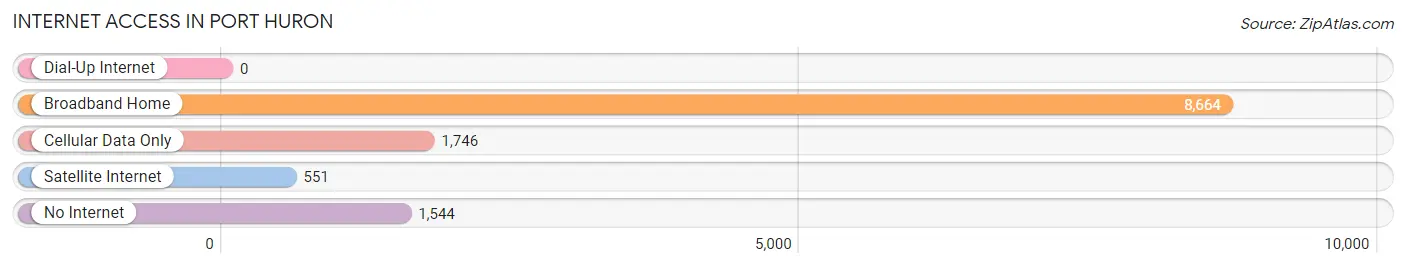
| Internet Type | # Households | % Households |
| Dial-Up Internet | 0 | 0.0% |
| Broadband Home | 8,664 | 70.3% |
| Cellular Data Only | 1,746 | 14.2% |
| Satellite Internet | 551 | 4.5% |
| No Internet | 1,544 | 12.5% |
| Total | 12,325 | 100.0% |
Port Huron Summary
History
Port Huron is a city located in the U.S. state of Michigan. It is the county seat of St. Clair County and is located along the St. Clair River, which forms the border between Michigan and Ontario, Canada. The city is situated at the mouth of the Black River, which flows into the St. Clair River. The city was founded in 1837 by fur trader William Smith and was originally named Smith’s Landing. The city was later renamed Port Huron in 1857 after the Huron Indians who lived in the area.
Port Huron has a long and rich history. During the War of 1812, the city was a major supply center for the British forces. In the mid-1800s, the city was a major port for the Great Lakes shipping industry. The city was also a major center for the lumber industry, and the city’s economy was heavily dependent on the lumber trade.
In the late 1800s, the city was a major hub for the railroad industry. The city was home to several major railroads, including the Grand Trunk Railway, the Michigan Central Railroad, and the Pere Marquette Railroad. The city was also home to several major industries, including the Port Huron Iron Works, the Port Huron Paper Company, and the Port Huron Foundry.
The city was also home to several major military installations during World War II. The city was home to the Port Huron Army Airfield, which was used as a training base for the U.S. Army Air Corps. The city was also home to the Port Huron Naval Base, which was used as a training base for the U.S. Navy.
Geography
Port Huron is located in the southeastern corner of Michigan, along the St. Clair River. The city is situated at the mouth of the Black River, which flows into the St. Clair River. The city is located approximately 60 miles north of Detroit and approximately 30 miles south of Sarnia, Ontario, Canada.
The city has a total area of 16.2 square miles, of which 15.7 square miles is land and 0.5 square miles is water. The city is located in a flat, low-lying area, with an elevation of 590 feet above sea level. The city is located in a humid continental climate zone, with hot, humid summers and cold, snowy winters.
Economy
Port Huron’s economy is largely based on manufacturing and tourism. The city is home to several major industries, including the Port Huron Iron Works, the Port Huron Paper Company, and the Port Huron Foundry. The city is also home to several major automotive suppliers, including the General Motors Powertrain plant and the Delphi Automotive plant.
The city is also home to several major tourist attractions, including the Thomas Edison Depot Museum, the Huron Lightship Museum, and the Port Huron Museum. The city is also home to several major festivals, including the Port Huron Music Festival and the Port Huron Blue Water Festival.
Demographics
As of the 2010 census, the city had a population of 30,184. The population is largely white (90.2%), with small percentages of African American (3.3%), Asian (2.2%), and Hispanic (2.1%) residents. The median household income is $37,945, and the median age is 40.7 years. The city has a poverty rate of 17.3%.
Port Huron is served by the Port Huron Area School District, which includes seven elementary schools, two middle schools, and one high school. The city is also home to several higher education institutions, including St. Clair County Community College and Baker College of Port Huron.
Common Questions
What is Per Capita Income in Port Huron?
Per Capita income in Port Huron is $27,273.
What is the Median Family Income in Port Huron?
Median Family Income in Port Huron is $56,030.
What is the Median Household income in Port Huron?
Median Household Income in Port Huron is $47,906.
What is Income or Wage Gap in Port Huron?
Income or Wage Gap in Port Huron is 31.3%.
Women in Port Huron earn 68.7 cents for every dollar earned by a man.
What is Family Income Deficit in Port Huron?
Family Income Deficit in Port Huron is $12,291.
Families that are below poverty line in Port Huron earn $12,291 less on average than the poverty threshold level.
What is Inequality or Gini Index in Port Huron?
Inequality or Gini Index in Port Huron is 0.45.
What is the Total Population of Port Huron?
Total Population of Port Huron is 28,881.
What is the Total Male Population of Port Huron?
Total Male Population of Port Huron is 14,124.
What is the Total Female Population of Port Huron?
Total Female Population of Port Huron is 14,757.
What is the Ratio of Males per 100 Females in Port Huron?
There are 95.71 Males per 100 Females in Port Huron.
What is the Ratio of Females per 100 Males in Port Huron?
There are 104.48 Females per 100 Males in Port Huron.
What is the Median Population Age in Port Huron?
Median Population Age in Port Huron is 39.0 Years.
What is the Average Family Size in Port Huron
Average Family Size in Port Huron is 2.9 People.
What is the Average Household Size in Port Huron
Average Household Size in Port Huron is 2.3 People.
How Large is the Labor Force in Port Huron?
There are 13,783 People in the Labor Forcein in Port Huron.
What is the Percentage of People in the Labor Force in Port Huron?
58.9% of People are in the Labor Force in Port Huron.
What is the Unemployment Rate in Port Huron?
Unemployment Rate in Port Huron is 9.3%.