Iron Mountain, MI Map & Demographics
Iron Mountain Map
Iron Mountain Overview
$32,578
PER CAPITA INCOME
$65,587
AVG FAMILY INCOME
$53,215
AVG HOUSEHOLD INCOME
35.9%
WAGE / INCOME GAP [ % ]
64.1¢/ $1
WAGE / INCOME GAP [ $ ]
$5,631
FAMILY INCOME DEFICIT
0.45
INEQUALITY / GINI INDEX
7,522
TOTAL POPULATION
4,029
MALE POPULATION
3,493
FEMALE POPULATION
115.34
MALES / 100 FEMALES
86.70
FEMALES / 100 MALES
42.7
MEDIAN AGE
2.7
AVG FAMILY SIZE
2.2
AVG HOUSEHOLD SIZE
3,540
LABOR FORCE [ PEOPLE ]
57.7%
PERCENT IN LABOR FORCE
4.7%
UNEMPLOYMENT RATE
Iron Mountain Zip Codes
Iron Mountain Area Codes
Income in Iron Mountain
Income Overview in Iron Mountain
Per Capita Income in Iron Mountain is $32,578, while median incomes of families and households are $65,587 and $53,215 respectively.
| Characteristic | Number | Measure |
| Per Capita Income | 7,522 | $32,578 |
| Median Family Income | 2,107 | $65,587 |
| Mean Family Income | 2,107 | $86,585 |
| Median Household Income | 3,393 | $53,215 |
| Mean Household Income | 3,393 | $71,615 |
| Income Deficit | 2,107 | $5,631 |
| Wage / Income Gap (%) | 7,522 | 35.91% |
| Wage / Income Gap ($) | 7,522 | 64.09¢ per $1 |
| Gini / Inequality Index | 7,522 | 0.45 |
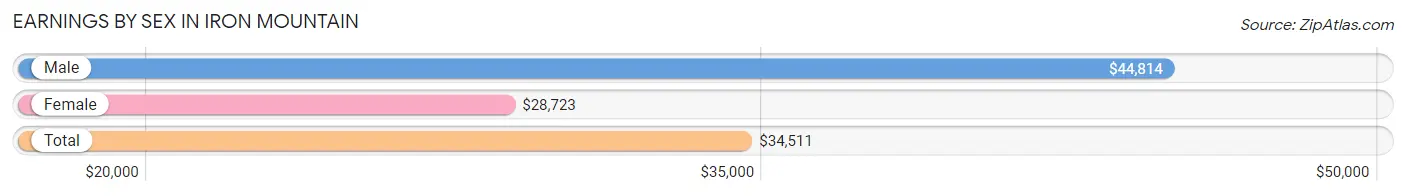
Earnings by Sex in Iron Mountain
Average Earnings in Iron Mountain are $34,511, $44,814 for men and $28,723 for women, a difference of 35.9%.
| Sex | Number | Average Earnings |
| Male | 2,217 (57.7%) | $44,814 |
| Female | 1,624 (42.3%) | $28,723 |
| Total | 3,841 (100.0%) | $34,511 |
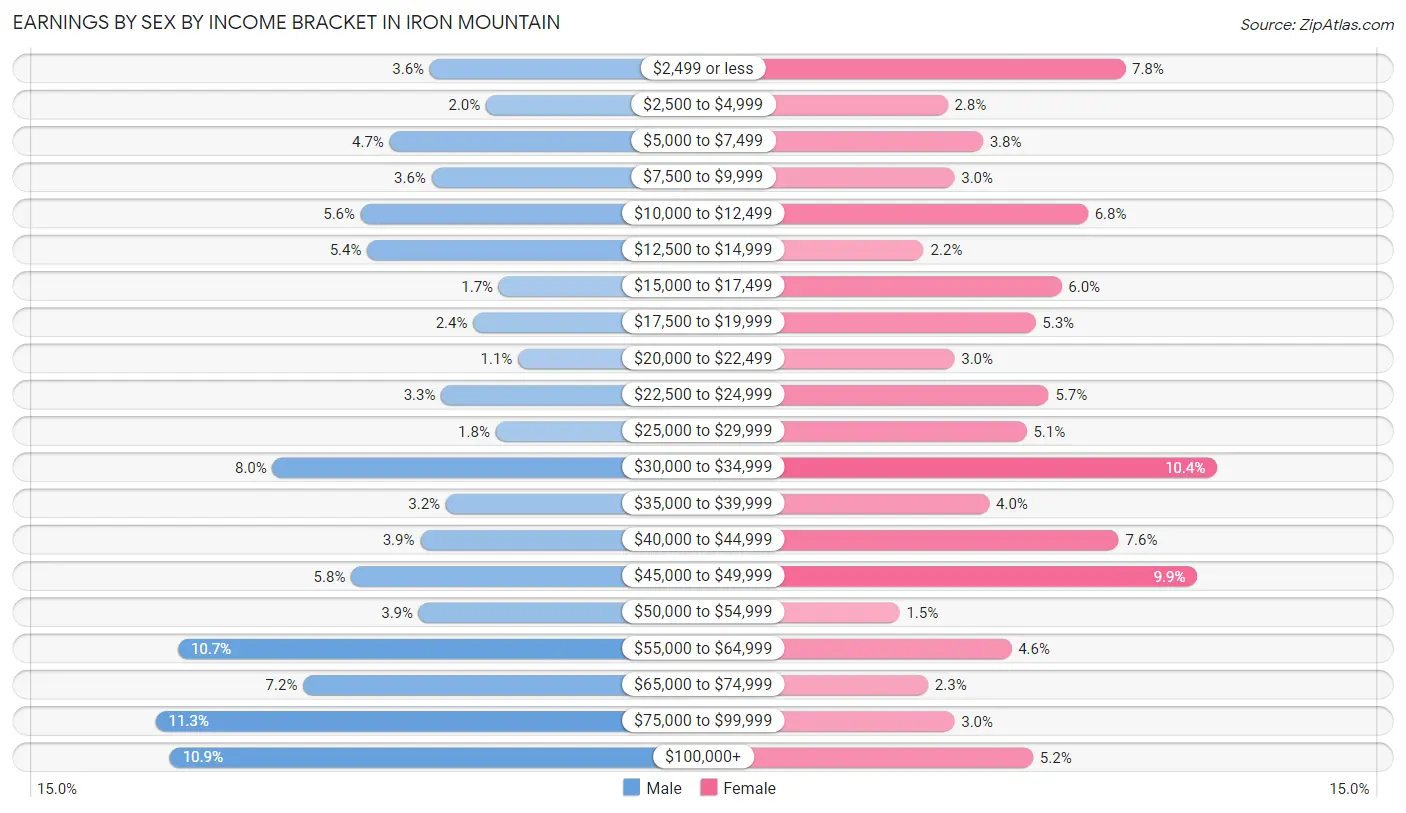
Earnings by Sex by Income Bracket in Iron Mountain
The most common earnings brackets in Iron Mountain are $75,000 to $99,999 for men (251 | 11.3%) and $30,000 to $34,999 for women (169 | 10.4%).
| Income | Male | Female |
| $2,499 or less | 80 (3.6%) | 127 (7.8%) |
| $2,500 to $4,999 | 45 (2.0%) | 46 (2.8%) |
| $5,000 to $7,499 | 105 (4.7%) | 62 (3.8%) |
| $7,500 to $9,999 | 79 (3.6%) | 49 (3.0%) |
| $10,000 to $12,499 | 123 (5.6%) | 110 (6.8%) |
| $12,500 to $14,999 | 119 (5.4%) | 35 (2.2%) |
| $15,000 to $17,499 | 37 (1.7%) | 98 (6.0%) |
| $17,500 to $19,999 | 53 (2.4%) | 86 (5.3%) |
| $20,000 to $22,499 | 25 (1.1%) | 49 (3.0%) |
| $22,500 to $24,999 | 73 (3.3%) | 92 (5.7%) |
| $25,000 to $29,999 | 39 (1.8%) | 82 (5.1%) |
| $30,000 to $34,999 | 178 (8.0%) | 169 (10.4%) |
| $35,000 to $39,999 | 70 (3.2%) | 65 (4.0%) |
| $40,000 to $44,999 | 86 (3.9%) | 124 (7.6%) |
| $45,000 to $49,999 | 129 (5.8%) | 160 (9.9%) |
| $50,000 to $54,999 | 87 (3.9%) | 24 (1.5%) |
| $55,000 to $64,999 | 237 (10.7%) | 75 (4.6%) |
| $65,000 to $74,999 | 159 (7.2%) | 37 (2.3%) |
| $75,000 to $99,999 | 251 (11.3%) | 49 (3.0%) |
| $100,000+ | 242 (10.9%) | 85 (5.2%) |
| Total | 2,217 (100.0%) | 1,624 (100.0%) |
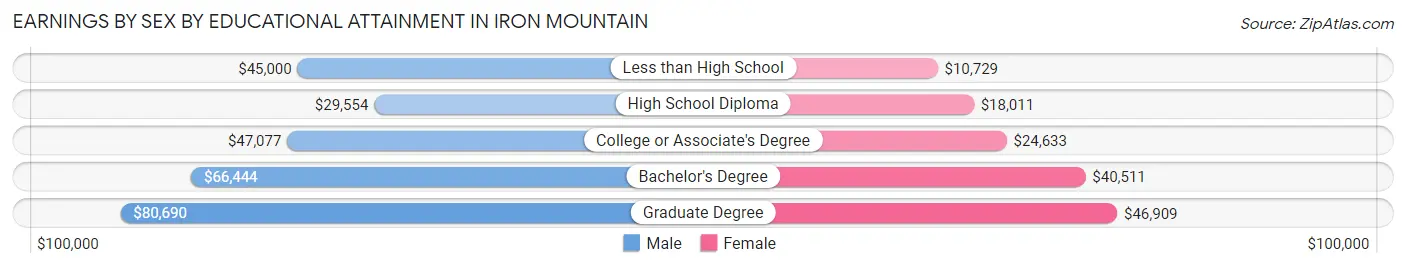
Earnings by Sex by Educational Attainment in Iron Mountain
Average earnings in Iron Mountain are $47,917 for men and $31,492 for women, a difference of 34.3%. Men with an educational attainment of graduate degree enjoy the highest average annual earnings of $80,690, while those with high school diploma education earn the least with $29,554. Women with an educational attainment of graduate degree earn the most with the average annual earnings of $46,909, while those with less than high school education have the smallest earnings of $10,729.
| Educational Attainment | Male Income | Female Income |
| Less than High School | $45,000 | $10,729 |
| High School Diploma | $29,554 | $18,011 |
| College or Associate's Degree | $47,077 | $24,633 |
| Bachelor's Degree | $66,444 | $40,511 |
| Graduate Degree | $80,690 | $46,909 |
| Total | $47,917 | $31,492 |
Family Income in Iron Mountain
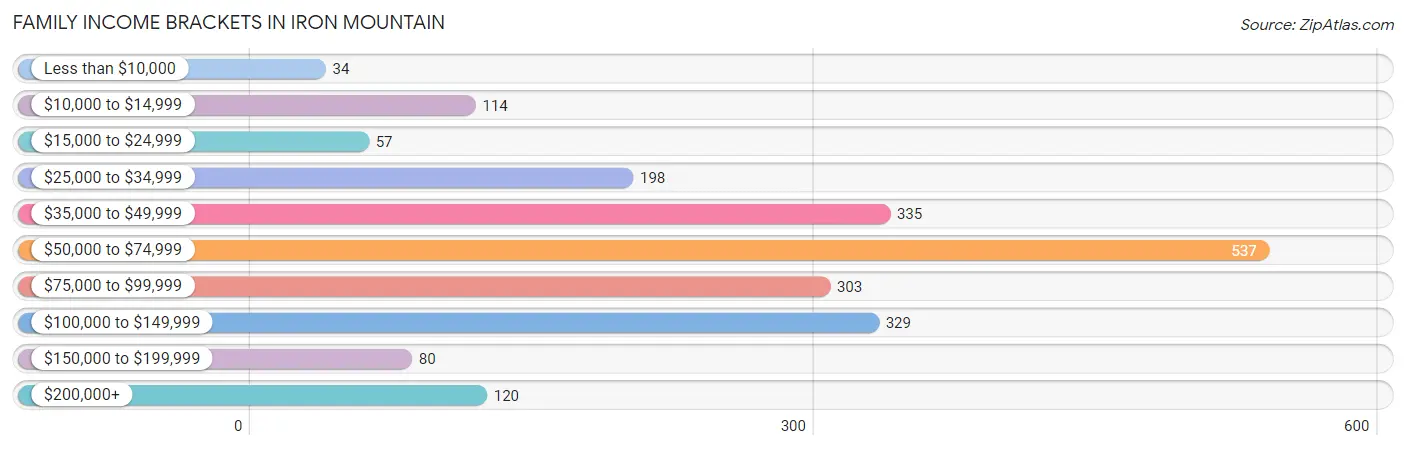
Family Income Brackets in Iron Mountain
According to the Iron Mountain family income data, there are 537 families falling into the $50,000 to $74,999 income range, which is the most common income bracket and makes up 25.5% of all families. Conversely, the less than $10,000 income bracket is the least frequent group with only 34 families (1.6%) belonging to this category.
| Income Bracket | # Families | % Families |
| Less than $10,000 | 34 | 1.6% |
| $10,000 to $14,999 | 114 | 5.4% |
| $15,000 to $24,999 | 57 | 2.7% |
| $25,000 to $34,999 | 198 | 9.4% |
| $35,000 to $49,999 | 335 | 15.9% |
| $50,000 to $74,999 | 537 | 25.5% |
| $75,000 to $99,999 | 303 | 14.4% |
| $100,000 to $149,999 | 329 | 15.6% |
| $150,000 to $199,999 | 80 | 3.8% |
| $200,000+ | 120 | 5.7% |
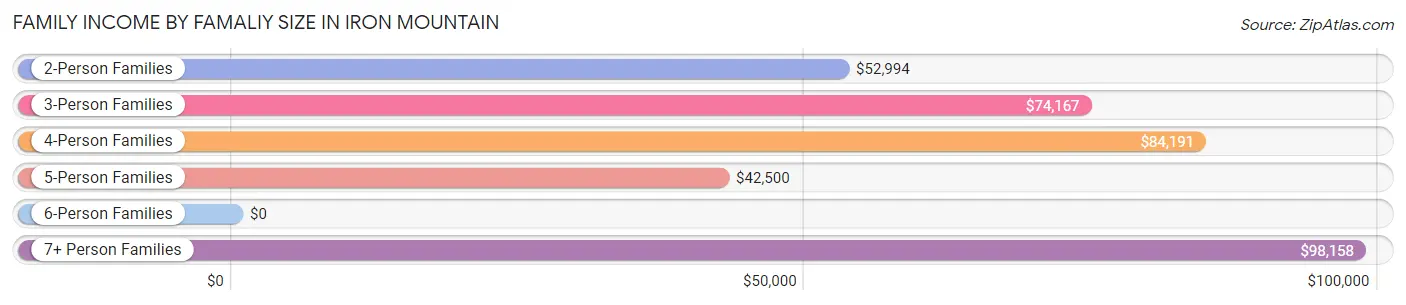
Family Income by Famaliy Size in Iron Mountain
7+ person families (40 | 1.9%) account for the highest median family income in Iron Mountain with $98,158 per family, while 2-person families (1,230 | 58.4%) have the highest median income of $26,497 per family member.
| Income Bracket | # Families | Median Income |
| 2-Person Families | 1,230 (58.4%) | $52,994 |
| 3-Person Families | 452 (21.4%) | $74,167 |
| 4-Person Families | 247 (11.7%) | $84,191 |
| 5-Person Families | 124 (5.9%) | $42,500 |
| 6-Person Families | 14 (0.7%) | $0 |
| 7+ Person Families | 40 (1.9%) | $98,158 |
| Total | 2,107 (100.0%) | $65,587 |
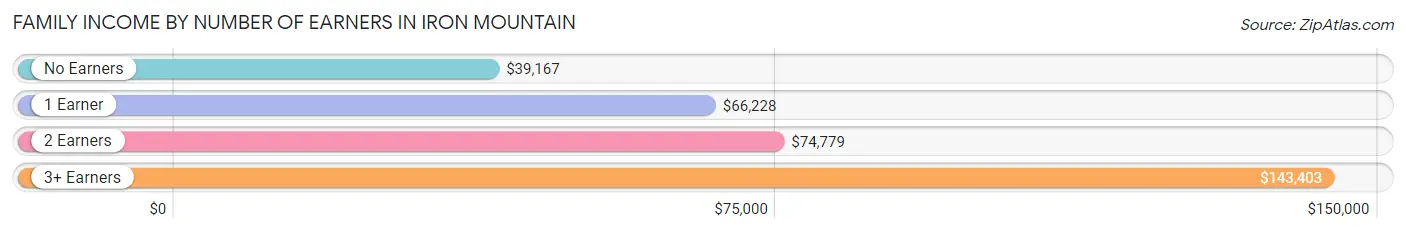
Family Income by Number of Earners in Iron Mountain
The median family income in Iron Mountain is $65,587, with families comprising 3+ earners (183) having the highest median family income of $143,403, while families with no earners (566) have the lowest median family income of $39,167, accounting for 8.7% and 26.9% of families, respectively.
| Number of Earners | # Families | Median Income |
| No Earners | 566 (26.9%) | $39,167 |
| 1 Earner | 550 (26.1%) | $66,228 |
| 2 Earners | 808 (38.4%) | $74,779 |
| 3+ Earners | 183 (8.7%) | $143,403 |
| Total | 2,107 (100.0%) | $65,587 |
Household Income in Iron Mountain
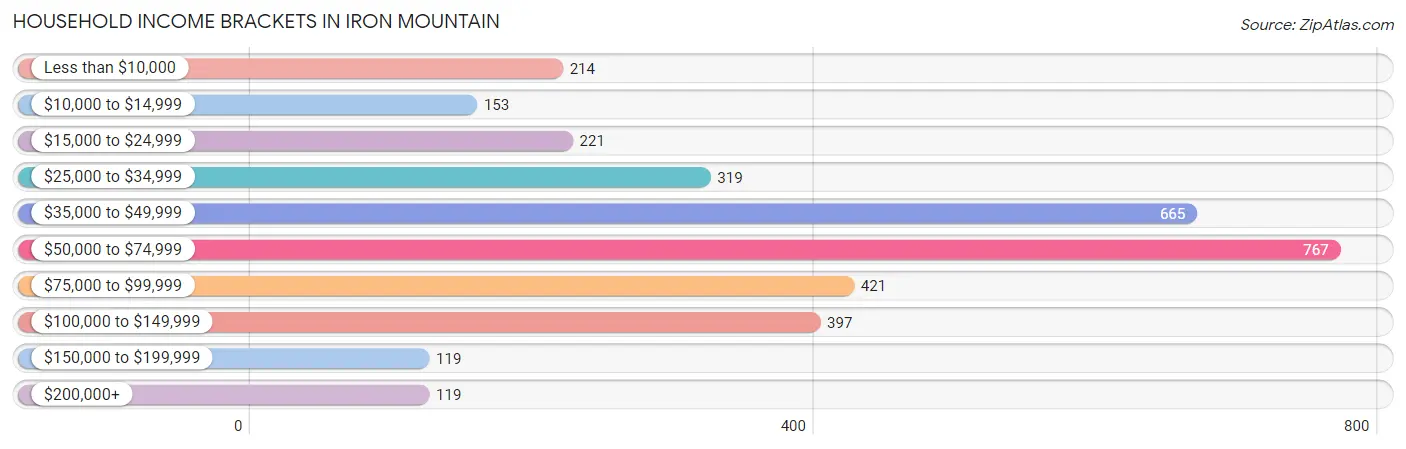
Household Income Brackets in Iron Mountain
With 767 households falling in the category, the $50,000 to $74,999 income range is the most frequent in Iron Mountain, accounting for 22.6% of all households. In contrast, only 119 households (3.5%) fall into the $150,000 to $199,999 income bracket, making it the least populous group.
| Income Bracket | # Households | % Households |
| Less than $10,000 | 214 | 6.3% |
| $10,000 to $14,999 | 153 | 4.5% |
| $15,000 to $24,999 | 221 | 6.5% |
| $25,000 to $34,999 | 319 | 9.4% |
| $35,000 to $49,999 | 665 | 19.6% |
| $50,000 to $74,999 | 767 | 22.6% |
| $75,000 to $99,999 | 421 | 12.4% |
| $100,000 to $149,999 | 397 | 11.7% |
| $150,000 to $199,999 | 119 | 3.5% |
| $200,000+ | 119 | 3.5% |
Household Income by Householder Age in Iron Mountain
The median household income in Iron Mountain is $53,215, with the highest median household income of $68,427 found in the 45 to 64 years age bracket for the primary householder. A total of 1,259 households (37.1%) fall into this category. Meanwhile, the 15 to 24 years age bracket for the primary householder has the lowest median household income of $0, with 37 households (1.1%) in this group.
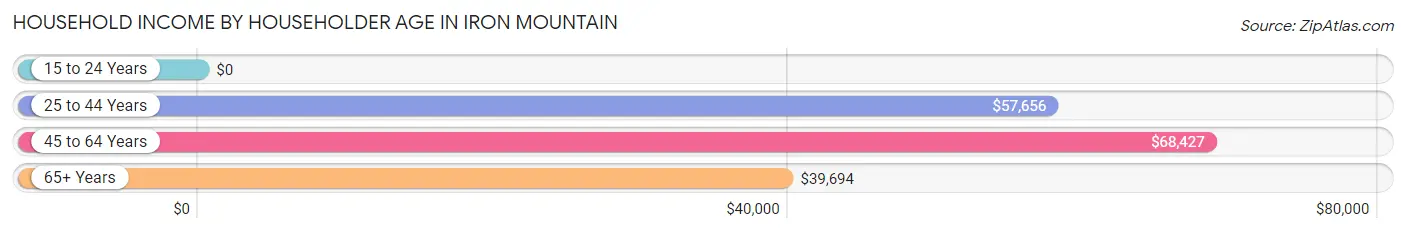
| Income Bracket | # Households | Median Income |
| 15 to 24 Years | 37 (1.1%) | $0 |
| 25 to 44 Years | 1,101 (32.5%) | $57,656 |
| 45 to 64 Years | 1,259 (37.1%) | $68,427 |
| 65+ Years | 996 (29.3%) | $39,694 |
| Total | 3,393 (100.0%) | $53,215 |
Poverty in Iron Mountain
Income Below Poverty by Sex and Age in Iron Mountain
With 7.8% poverty level for males and 13.9% for females among the residents of Iron Mountain, 5 year old males and 16 and 17 year old females are the most vulnerable to poverty, with 20 males (17.9%) and 30 females (41.7%) in their respective age groups living below the poverty level.
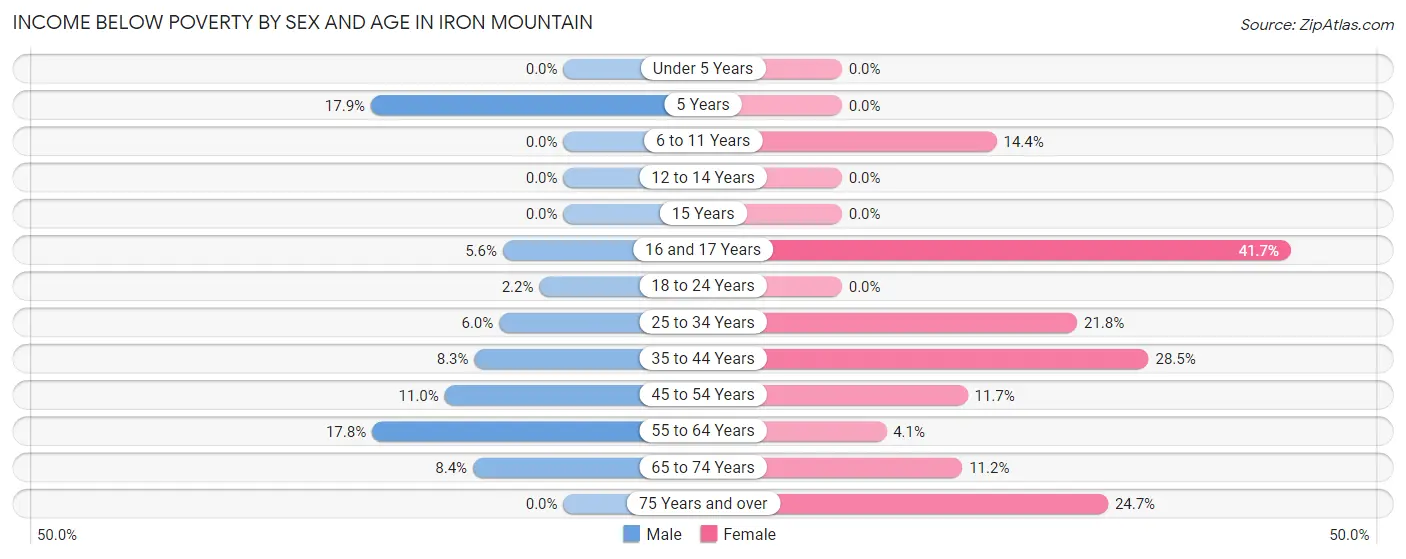
| Age Bracket | Male | Female |
| Under 5 Years | 0 (0.0%) | 0 (0.0%) |
| 5 Years | 20 (17.9%) | 0 (0.0%) |
| 6 to 11 Years | 0 (0.0%) | 57 (14.4%) |
| 12 to 14 Years | 0 (0.0%) | 0 (0.0%) |
| 15 Years | 0 (0.0%) | 0 (0.0%) |
| 16 and 17 Years | 5 (5.6%) | 30 (41.7%) |
| 18 to 24 Years | 4 (2.2%) | 0 (0.0%) |
| 25 to 34 Years | 40 (6.0%) | 74 (21.8%) |
| 35 to 44 Years | 40 (8.3%) | 115 (28.5%) |
| 45 to 54 Years | 56 (11.0%) | 51 (11.7%) |
| 55 to 64 Years | 103 (17.8%) | 20 (4.1%) |
| 65 to 74 Years | 36 (8.4%) | 51 (11.2%) |
| 75 Years and over | 0 (0.0%) | 83 (24.7%) |
| Total | 304 (7.8%) | 481 (13.9%) |
Income Above Poverty by Sex and Age in Iron Mountain
According to the poverty statistics in Iron Mountain, males aged under 5 years and females aged under 5 years are the age groups that are most secure financially, with 100.0% of males and 100.0% of females in these age groups living above the poverty line.
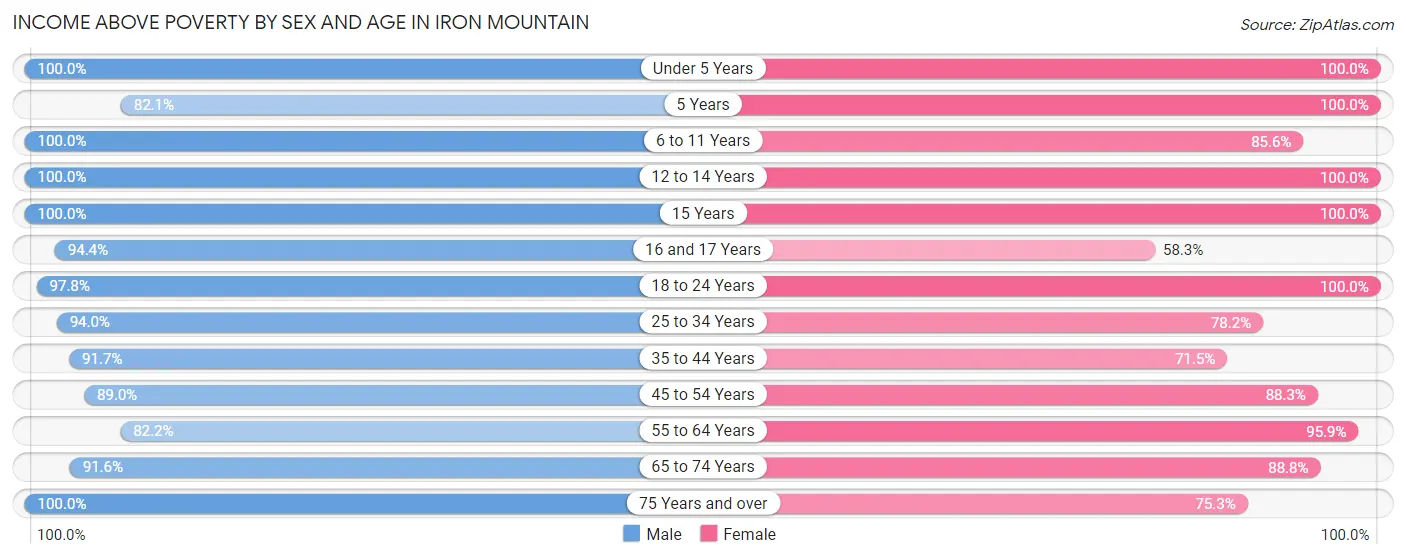
| Age Bracket | Male | Female |
| Under 5 Years | 244 (100.0%) | 185 (100.0%) |
| 5 Years | 92 (82.1%) | 15 (100.0%) |
| 6 to 11 Years | 233 (100.0%) | 340 (85.6%) |
| 12 to 14 Years | 72 (100.0%) | 35 (100.0%) |
| 15 Years | 28 (100.0%) | 47 (100.0%) |
| 16 and 17 Years | 84 (94.4%) | 42 (58.3%) |
| 18 to 24 Years | 175 (97.8%) | 257 (100.0%) |
| 25 to 34 Years | 631 (94.0%) | 265 (78.2%) |
| 35 to 44 Years | 444 (91.7%) | 289 (71.5%) |
| 45 to 54 Years | 452 (89.0%) | 386 (88.3%) |
| 55 to 64 Years | 477 (82.2%) | 466 (95.9%) |
| 65 to 74 Years | 393 (91.6%) | 405 (88.8%) |
| 75 Years and over | 267 (100.0%) | 253 (75.3%) |
| Total | 3,592 (92.2%) | 2,985 (86.1%) |
Income Below Poverty Among Married-Couple Families in Iron Mountain
The poverty statistics for married-couple families in Iron Mountain show that 4.2% or 65 of the total 1,549 families live below the poverty line. Families with 1 or 2 children have the highest poverty rate of 11.7%, comprising of 44 families. On the other hand, families with 3 or 4 children have the lowest poverty rate of 0.0%, which includes 0 families.
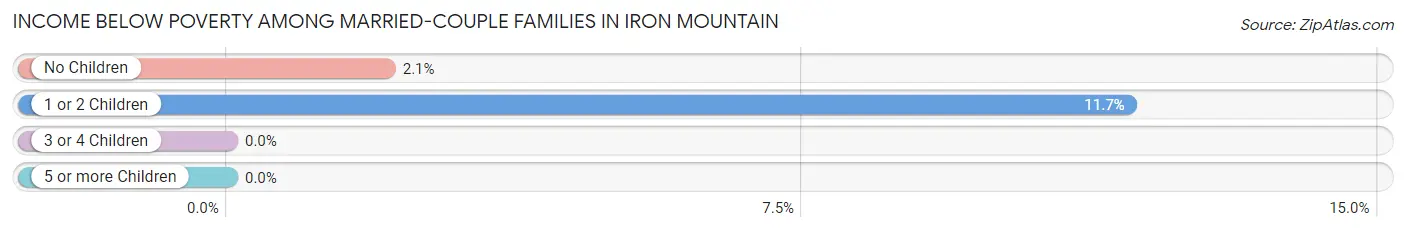
| Children | Above Poverty | Below Poverty |
| No Children | 999 (97.9%) | 21 (2.1%) |
| 1 or 2 Children | 331 (88.3%) | 44 (11.7%) |
| 3 or 4 Children | 114 (100.0%) | 0 (0.0%) |
| 5 or more Children | 40 (100.0%) | 0 (0.0%) |
| Total | 1,484 (95.8%) | 65 (4.2%) |
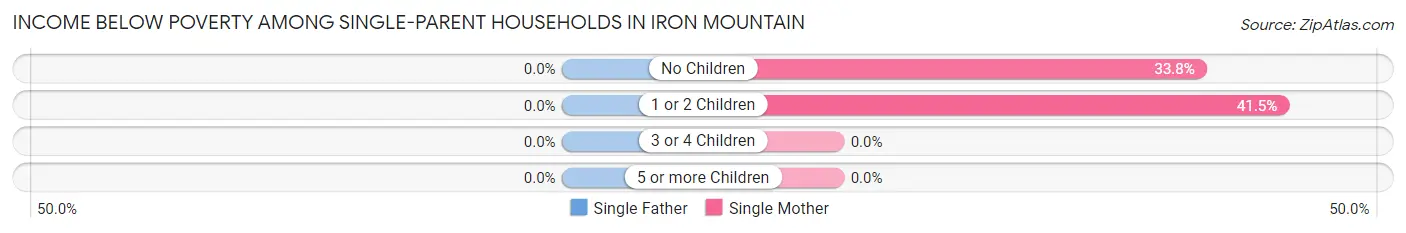
Income Below Poverty Among Single-Parent Households in Iron Mountain
| Children | Single Father | Single Mother |
| No Children | 0 (0.0%) | 74 (33.8%) |
| 1 or 2 Children | 0 (0.0%) | 56 (41.5%) |
| 3 or 4 Children | 0 (0.0%) | 0 (0.0%) |
| 5 or more Children | 0 (0.0%) | 0 (0.0%) |
| Total | 0 (0.0%) | 130 (34.9%) |
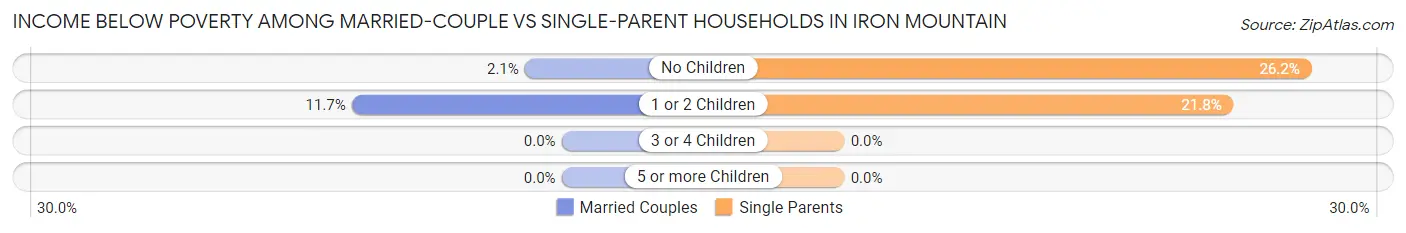
Income Below Poverty Among Married-Couple vs Single-Parent Households in Iron Mountain
The poverty data for Iron Mountain shows that 65 of the married-couple family households (4.2%) and 130 of the single-parent households (23.3%) are living below the poverty level. Within the married-couple family households, those with 1 or 2 children have the highest poverty rate, with 44 households (11.7%) falling below the poverty line. Among the single-parent households, those with no children have the highest poverty rate, with 74 household (26.2%) living below poverty.
| Children | Married-Couple Families | Single-Parent Households |
| No Children | 21 (2.1%) | 74 (26.2%) |
| 1 or 2 Children | 44 (11.7%) | 56 (21.8%) |
| 3 or 4 Children | 0 (0.0%) | 0 (0.0%) |
| 5 or more Children | 0 (0.0%) | 0 (0.0%) |
| Total | 65 (4.2%) | 130 (23.3%) |
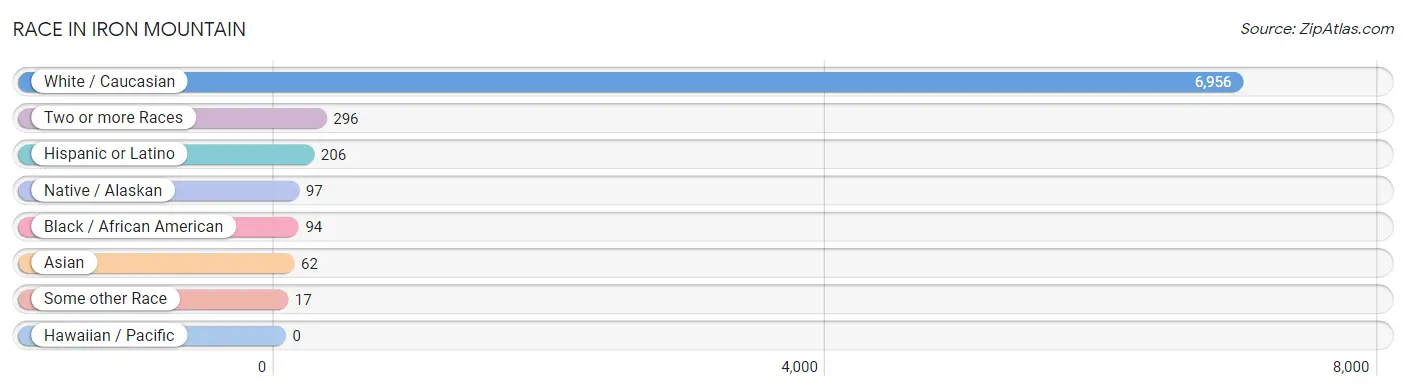
Race in Iron Mountain
The most populous races in Iron Mountain are White / Caucasian (6,956 | 92.5%), Two or more Races (296 | 3.9%), and Hispanic or Latino (206 | 2.7%).
| Race | # Population | % Population |
| Asian | 62 | 0.8% |
| Black / African American | 94 | 1.3% |
| Hawaiian / Pacific | 0 | 0.0% |
| Hispanic or Latino | 206 | 2.7% |
| Native / Alaskan | 97 | 1.3% |
| White / Caucasian | 6,956 | 92.5% |
| Two or more Races | 296 | 3.9% |
| Some other Race | 17 | 0.2% |
| Total | 7,522 | 100.0% |
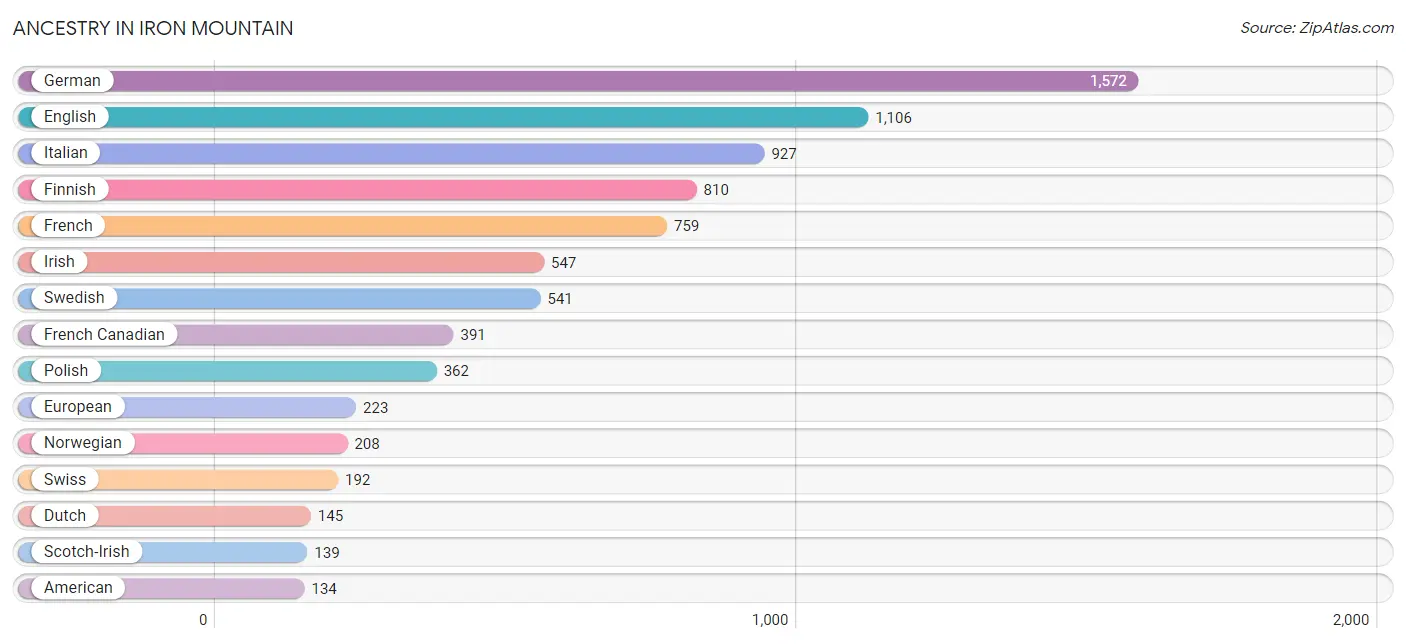
Ancestry in Iron Mountain
The most populous ancestries reported in Iron Mountain are German (1,572 | 20.9%), English (1,106 | 14.7%), Italian (927 | 12.3%), Finnish (810 | 10.8%), and French (759 | 10.1%), together accounting for 68.8% of all Iron Mountain residents.
| Ancestry | # Population | % Population |
| American | 134 | 1.8% |
| Arab | 20 | 0.3% |
| Austrian | 41 | 0.5% |
| Belgian | 45 | 0.6% |
| Burmese | 10 | 0.1% |
| Canadian | 44 | 0.6% |
| Central American | 7 | 0.1% |
| Cherokee | 42 | 0.6% |
| Chippewa | 55 | 0.7% |
| Costa Rican | 7 | 0.1% |
| Croatian | 44 | 0.6% |
| Czech | 6 | 0.1% |
| Czechoslovakian | 11 | 0.2% |
| Danish | 36 | 0.5% |
| Dutch | 145 | 1.9% |
| Eastern European | 50 | 0.7% |
| Ecuadorian | 29 | 0.4% |
| English | 1,106 | 14.7% |
| European | 223 | 3.0% |
| Finnish | 810 | 10.8% |
| French | 759 | 10.1% |
| French Canadian | 391 | 5.2% |
| German | 1,572 | 20.9% |
| Greek | 16 | 0.2% |
| Indian (Asian) | 9 | 0.1% |
| Irish | 547 | 7.3% |
| Italian | 927 | 12.3% |
| Korean | 14 | 0.2% |
| Lebanese | 20 | 0.3% |
| Lithuanian | 86 | 1.1% |
| Mexican | 85 | 1.1% |
| Northern European | 33 | 0.4% |
| Norwegian | 208 | 2.8% |
| Polish | 362 | 4.8% |
| Puerto Rican | 4 | 0.1% |
| Russian | 28 | 0.4% |
| Scandinavian | 81 | 1.1% |
| Scotch-Irish | 139 | 1.8% |
| Scottish | 66 | 0.9% |
| South American | 39 | 0.5% |
| South American Indian | 29 | 0.4% |
| Spaniard | 45 | 0.6% |
| Spanish | 23 | 0.3% |
| Swedish | 541 | 7.2% |
| Swiss | 192 | 2.5% |
| Thai | 33 | 0.4% |
| Ukrainian | 5 | 0.1% |
| Venezuelan | 10 | 0.1% |
| Welsh | 12 | 0.2% | View All 49 Rows |
Immigrants in Iron Mountain
The most numerous immigrant groups reported in Iron Mountain came from Asia (62 | 0.8%), India (33 | 0.4%), South Central Asia (33 | 0.4%), Europe (24 | 0.3%), and Philippines (19 | 0.3%), together accounting for 2.3% of all Iron Mountain residents.
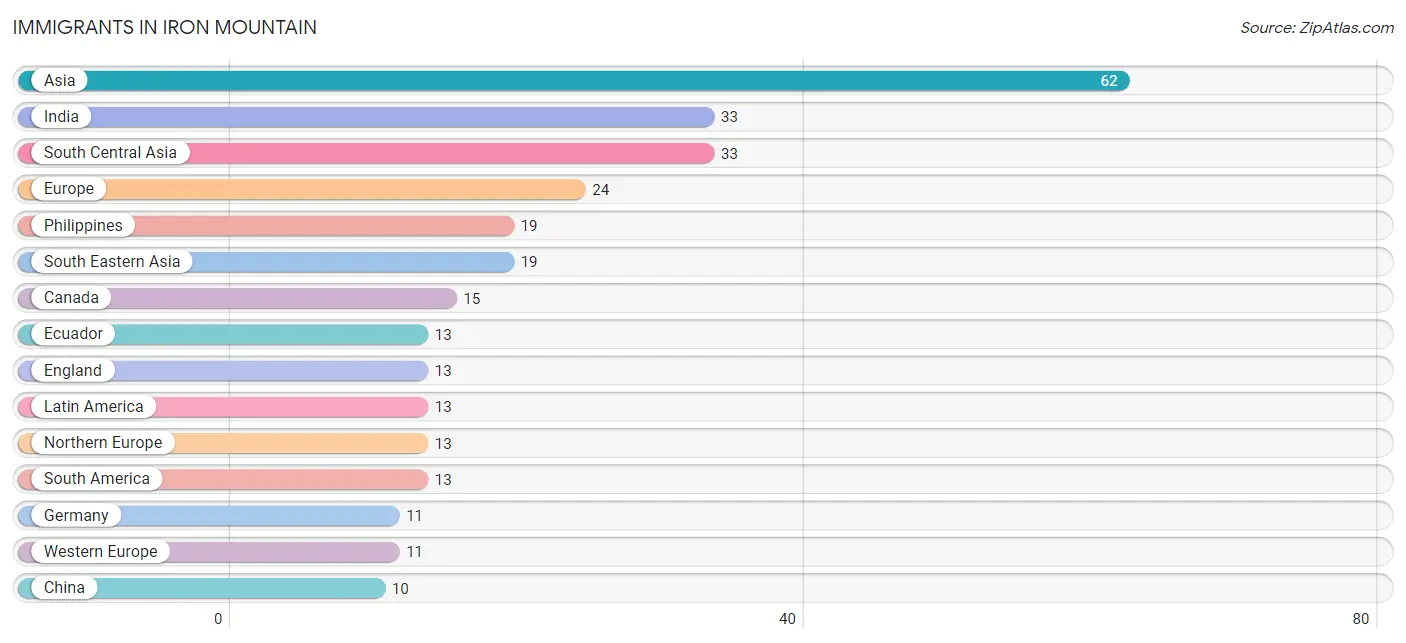
| Immigration Origin | # Population | % Population |
| Asia | 62 | 0.8% |
| Canada | 15 | 0.2% |
| China | 10 | 0.1% |
| Eastern Asia | 10 | 0.1% |
| Ecuador | 13 | 0.2% |
| England | 13 | 0.2% |
| Europe | 24 | 0.3% |
| Germany | 11 | 0.2% |
| India | 33 | 0.4% |
| Latin America | 13 | 0.2% |
| Northern Europe | 13 | 0.2% |
| Philippines | 19 | 0.3% |
| South America | 13 | 0.2% |
| South Central Asia | 33 | 0.4% |
| South Eastern Asia | 19 | 0.3% |
| Western Europe | 11 | 0.2% | View All 16 Rows |
Sex and Age in Iron Mountain
Sex and Age in Iron Mountain
The most populous age groups in Iron Mountain are 25 to 29 Years (378 | 9.4%) for men and 65 to 69 Years (312 | 8.9%) for women.
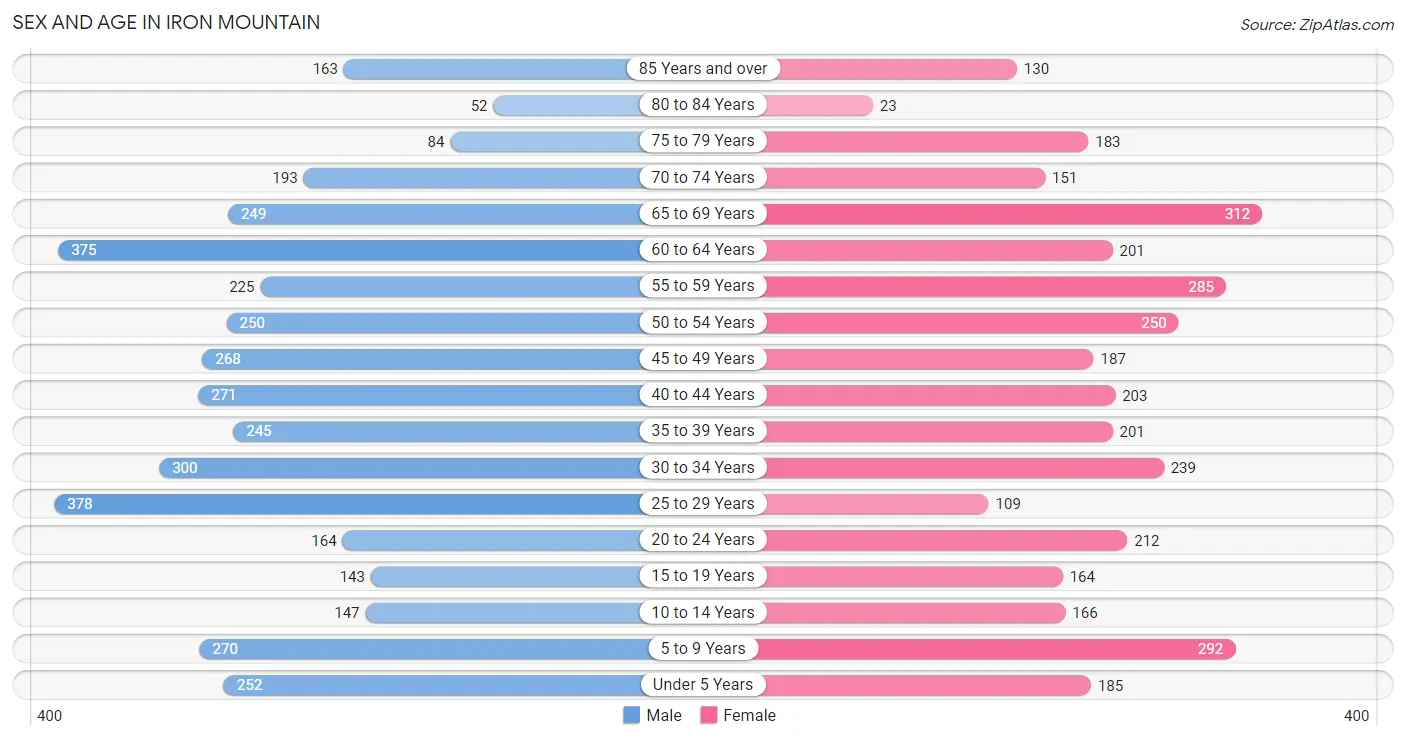
| Age Bracket | Male | Female |
| Under 5 Years | 252 (6.2%) | 185 (5.3%) |
| 5 to 9 Years | 270 (6.7%) | 292 (8.4%) |
| 10 to 14 Years | 147 (3.6%) | 166 (4.8%) |
| 15 to 19 Years | 143 (3.5%) | 164 (4.7%) |
| 20 to 24 Years | 164 (4.1%) | 212 (6.1%) |
| 25 to 29 Years | 378 (9.4%) | 109 (3.1%) |
| 30 to 34 Years | 300 (7.4%) | 239 (6.8%) |
| 35 to 39 Years | 245 (6.1%) | 201 (5.8%) |
| 40 to 44 Years | 271 (6.7%) | 203 (5.8%) |
| 45 to 49 Years | 268 (6.7%) | 187 (5.3%) |
| 50 to 54 Years | 250 (6.2%) | 250 (7.2%) |
| 55 to 59 Years | 225 (5.6%) | 285 (8.2%) |
| 60 to 64 Years | 375 (9.3%) | 201 (5.8%) |
| 65 to 69 Years | 249 (6.2%) | 312 (8.9%) |
| 70 to 74 Years | 193 (4.8%) | 151 (4.3%) |
| 75 to 79 Years | 84 (2.1%) | 183 (5.2%) |
| 80 to 84 Years | 52 (1.3%) | 23 (0.7%) |
| 85 Years and over | 163 (4.1%) | 130 (3.7%) |
| Total | 4,029 (100.0%) | 3,493 (100.0%) |
Families and Households in Iron Mountain
Median Family Size in Iron Mountain
The median family size in Iron Mountain is 2.74 persons per family, with married-couple families (1,549 | 73.5%) accounting for the largest median family size of 2.93 persons per family. On the other hand, single female/mother families (372 | 17.7%) represent the smallest median family size with 2.18 persons per family.
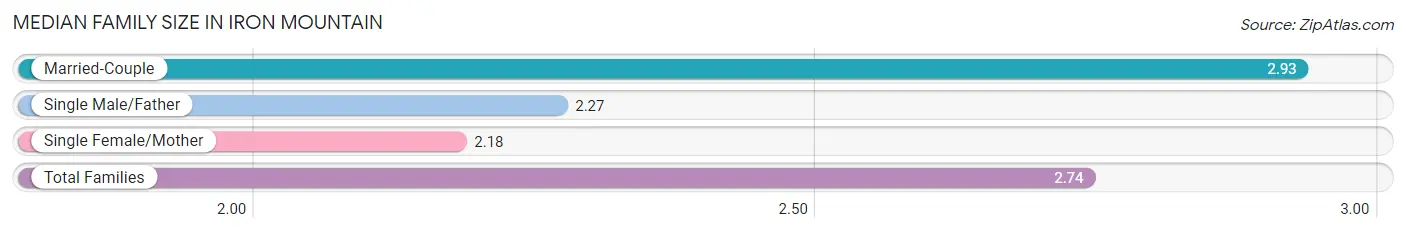
| Family Type | # Families | Family Size |
| Married-Couple | 1,549 (73.5%) | 2.93 |
| Single Male/Father | 186 (8.8%) | 2.27 |
| Single Female/Mother | 372 (17.7%) | 2.18 |
| Total Families | 2,107 (100.0%) | 2.74 |
Median Household Size in Iron Mountain
The median household size in Iron Mountain is 2.17 persons per household, with married-couple households (1,549 | 45.7%) accounting for the largest median household size of 2.93 persons per household. non-family households (1,286 | 37.9%) represent the smallest median household size with 1.14 persons per household.
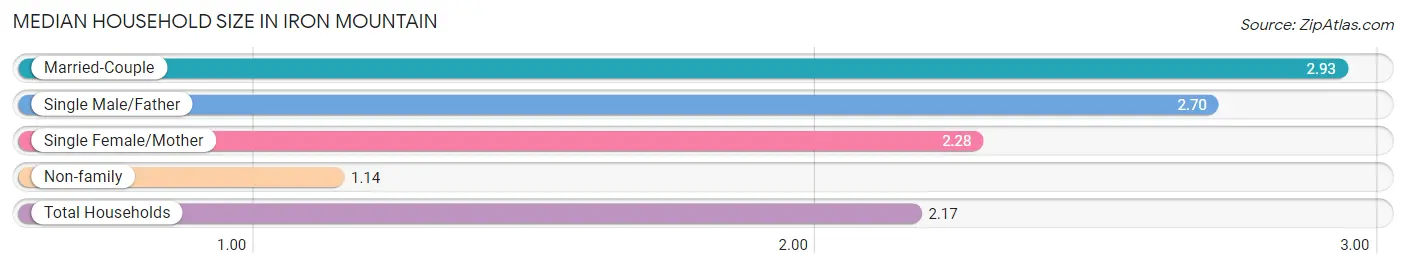
| Household Type | # Households | Household Size |
| Married-Couple | 1,549 (45.7%) | 2.93 |
| Single Male/Father | 186 (5.5%) | 2.70 |
| Single Female/Mother | 372 (11.0%) | 2.28 |
| Non-family | 1,286 (37.9%) | 1.14 |
| Total Households | 3,393 (100.0%) | 2.17 |
Household Size by Marriage Status in Iron Mountain
Out of a total of 3,393 households in Iron Mountain, 2,107 (62.1%) are family households, while 1,286 (37.9%) are nonfamily households. The most numerous type of family households are 2-person households, comprising 1,196, and the most common type of nonfamily households are 1-person households, comprising 1,119.
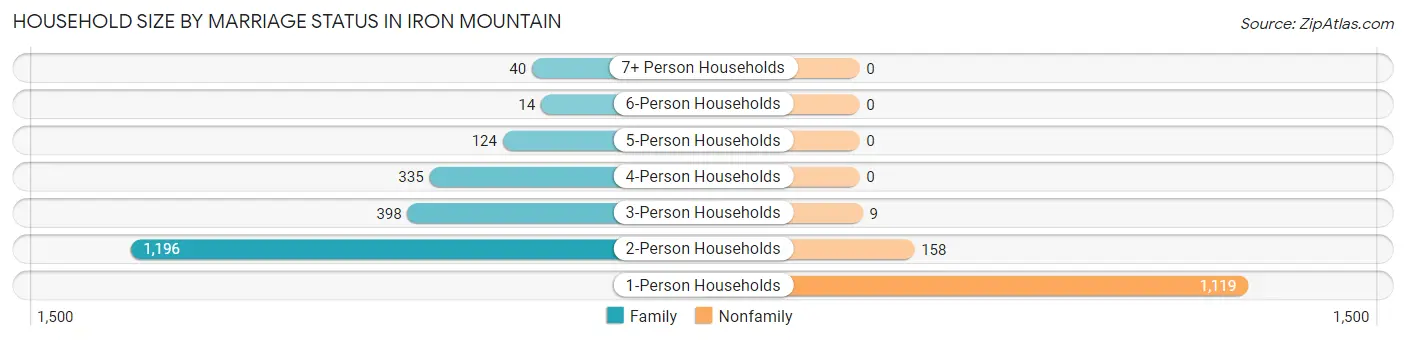
| Household Size | Family Households | Nonfamily Households |
| 1-Person Households | - | 1,119 (33.0%) |
| 2-Person Households | 1,196 (35.2%) | 158 (4.7%) |
| 3-Person Households | 398 (11.7%) | 9 (0.3%) |
| 4-Person Households | 335 (9.9%) | 0 (0.0%) |
| 5-Person Households | 124 (3.6%) | 0 (0.0%) |
| 6-Person Households | 14 (0.4%) | 0 (0.0%) |
| 7+ Person Households | 40 (1.2%) | 0 (0.0%) |
| Total | 2,107 (62.1%) | 1,286 (37.9%) |
Female Fertility in Iron Mountain
Fertility by Age in Iron Mountain
Average fertility rate in Iron Mountain is 118.0 births per 1,000 women. Women in the age bracket of 20 to 34 years have the highest fertility rate with 255.0 births per 1,000 women. Women in the age bracket of 20 to 34 years acount for 89.9% of all women with births.
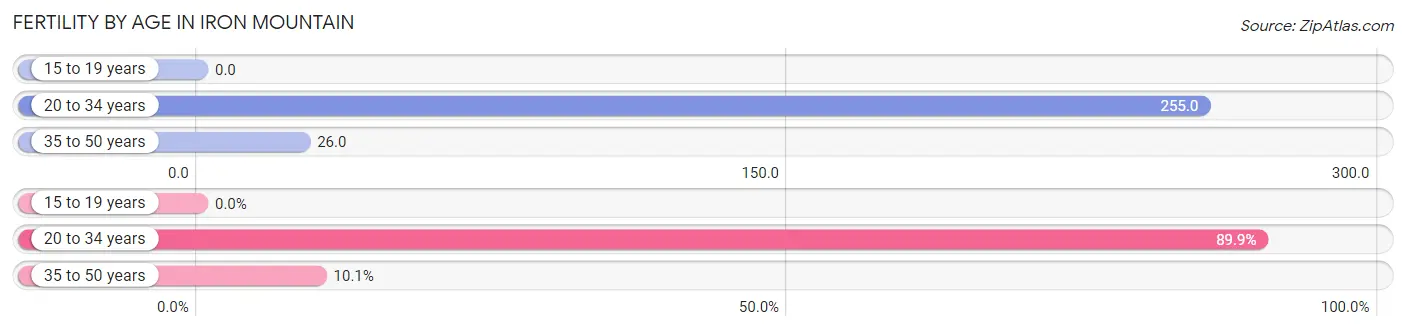
| Age Bracket | Women with Births | Births / 1,000 Women |
| 15 to 19 years | 0 (0.0%) | 0.0 |
| 20 to 34 years | 143 (89.9%) | 255.0 |
| 35 to 50 years | 16 (10.1%) | 26.0 |
| Total | 159 (100.0%) | 118.0 |
Fertility by Age by Marriage Status in Iron Mountain
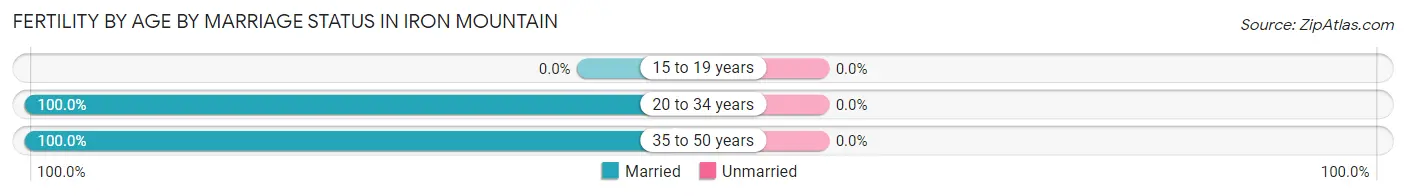
| Age Bracket | Married | Unmarried |
| 15 to 19 years | 0 (0.0%) | 0 (0.0%) |
| 20 to 34 years | 143 (100.0%) | 0 (0.0%) |
| 35 to 50 years | 16 (100.0%) | 0 (0.0%) |
| Total | 159 (100.0%) | 0 (0.0%) |
Fertility by Education in Iron Mountain
Average fertility rate in Iron Mountain is 118.0 births per 1,000 women. Women with the education attainment of graduate degree have the highest fertility rate of 289.0 births per 1,000 women, while women with the education attainment of high school diploma have the lowest fertility at 64.0 births per 1,000 women. Women with the education attainment of college or associate's degree represent 59.1% of all women with births.
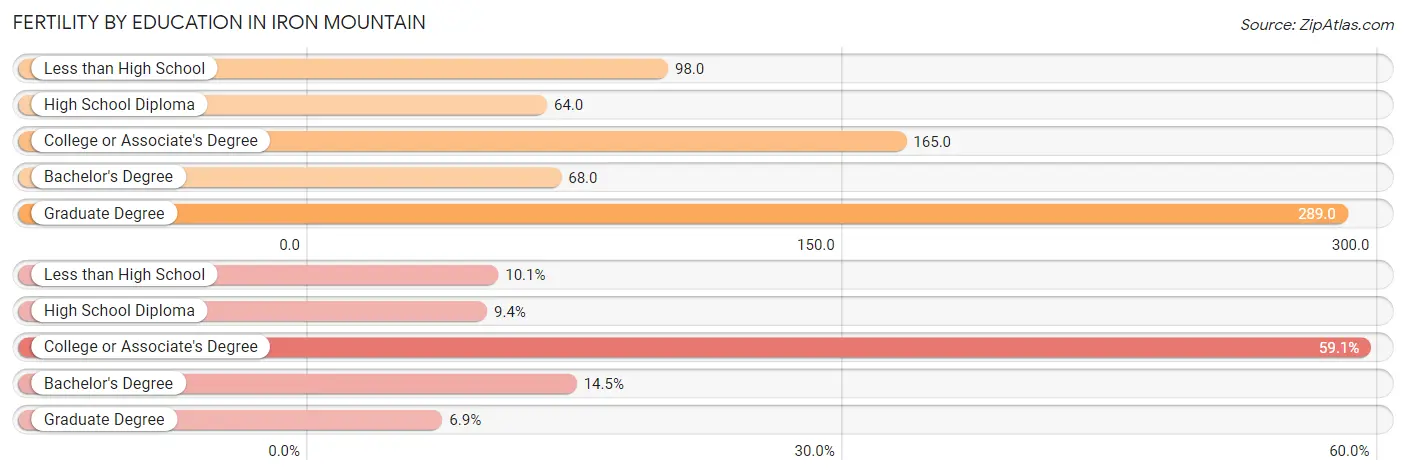
| Educational Attainment | Women with Births | Births / 1,000 Women |
| Less than High School | 16 (10.1%) | 98.0 |
| High School Diploma | 15 (9.4%) | 64.0 |
| College or Associate's Degree | 94 (59.1%) | 165.0 |
| Bachelor's Degree | 23 (14.5%) | 68.0 |
| Graduate Degree | 11 (6.9%) | 289.0 |
| Total | 159 (100.0%) | 118.0 |
Fertility by Education by Marriage Status in Iron Mountain
| Educational Attainment | Married | Unmarried |
| Less than High School | 16 (100.0%) | 0 (0.0%) |
| High School Diploma | 15 (100.0%) | 0 (0.0%) |
| College or Associate's Degree | 94 (100.0%) | 0 (0.0%) |
| Bachelor's Degree | 23 (100.0%) | 0 (0.0%) |
| Graduate Degree | 11 (100.0%) | 0 (0.0%) |
| Total | 159 (100.0%) | 0 (0.0%) |
Employment Characteristics in Iron Mountain
Employment by Class of Employer in Iron Mountain
Among the 3,309 employed individuals in Iron Mountain, private company employees (2,463 | 74.4%), local government employees (266 | 8.0%), and not-for-profit organizations (232 | 7.0%) make up the most common classes of employment.
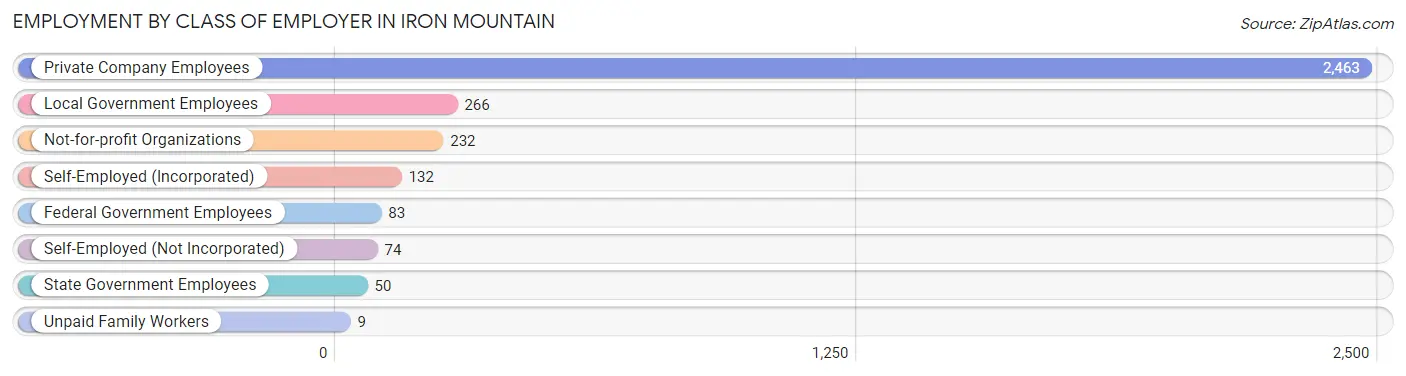
| Employer Class | # Employees | % Employees |
| Private Company Employees | 2,463 | 74.4% |
| Self-Employed (Incorporated) | 132 | 4.0% |
| Self-Employed (Not Incorporated) | 74 | 2.2% |
| Not-for-profit Organizations | 232 | 7.0% |
| Local Government Employees | 266 | 8.0% |
| State Government Employees | 50 | 1.5% |
| Federal Government Employees | 83 | 2.5% |
| Unpaid Family Workers | 9 | 0.3% |
| Total | 3,309 | 100.0% |
Employment Status by Age in Iron Mountain
According to the labor force statistics for Iron Mountain, out of the total population over 16 years of age (6,135), 57.7% or 3,540 individuals are in the labor force, with 4.7% or 166 of them unemployed. The age group with the highest labor force participation rate is 20 to 24 years, with 85.4% or 321 individuals in the labor force. Within the labor force, the 16 to 19 years age range has the highest percentage of unemployed individuals, with 18.3% or 13 of them being unemployed.
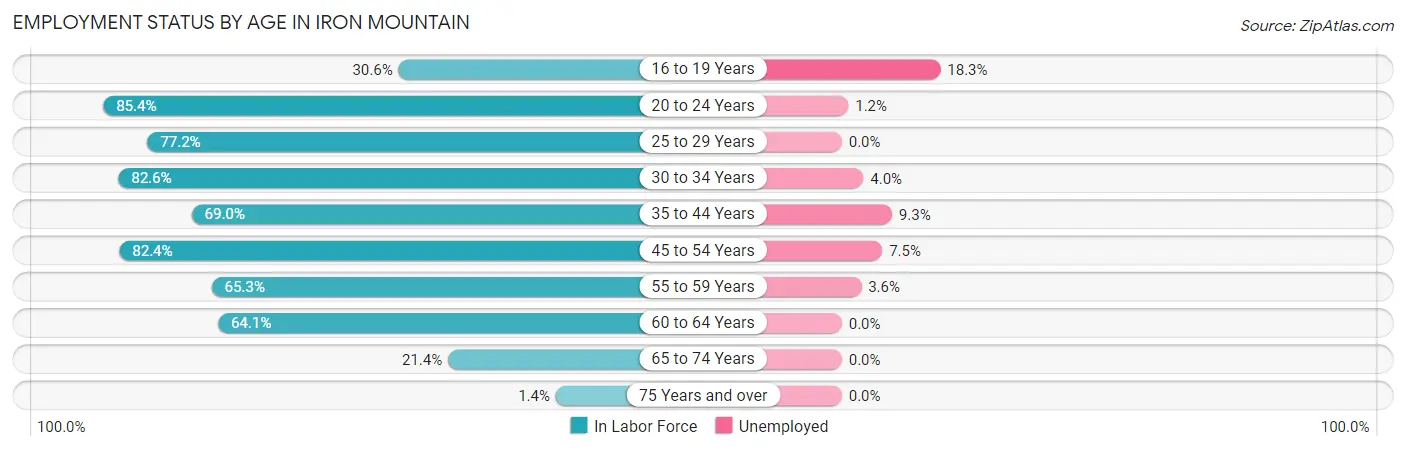
| Age Bracket | In Labor Force | Unemployed |
| 16 to 19 Years | 71 (30.6%) | 13 (18.3%) |
| 20 to 24 Years | 321 (85.4%) | 4 (1.2%) |
| 25 to 29 Years | 376 (77.2%) | 0 (0.0%) |
| 30 to 34 Years | 445 (82.6%) | 18 (4.0%) |
| 35 to 44 Years | 635 (69.0%) | 59 (9.3%) |
| 45 to 54 Years | 787 (82.4%) | 59 (7.5%) |
| 55 to 59 Years | 333 (65.3%) | 12 (3.6%) |
| 60 to 64 Years | 369 (64.1%) | 0 (0.0%) |
| 65 to 74 Years | 194 (21.4%) | 0 (0.0%) |
| 75 Years and over | 9 (1.4%) | 0 (0.0%) |
| Total | 3,540 (57.7%) | 166 (4.7%) |
Employment Status by Educational Attainment in Iron Mountain
According to labor force statistics for Iron Mountain, 73.9% of individuals (2,946) out of the total population between 25 and 64 years of age (3,987) are in the labor force, with 5.0% or 147 of them being unemployed. The group with the highest labor force participation rate are those with the educational attainment of bachelor's degree or higher, with 84.7% or 945 individuals in the labor force. Within the labor force, individuals with college / associate degree education have the highest percentage of unemployment, with 8.0% or 99 of them being unemployed.
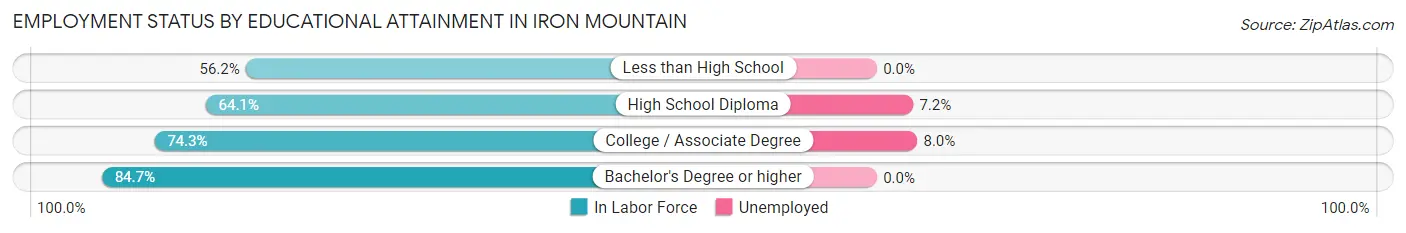
| Educational Attainment | In Labor Force | Unemployed |
| Less than High School | 68 (56.2%) | 0 (0.0%) |
| High School Diploma | 694 (64.1%) | 78 (7.2%) |
| College / Associate Degree | 1,239 (74.3%) | 133 (8.0%) |
| Bachelor's Degree or higher | 945 (84.7%) | 0 (0.0%) |
| Total | 2,946 (73.9%) | 199 (5.0%) |
Employment Occupations by Sex in Iron Mountain
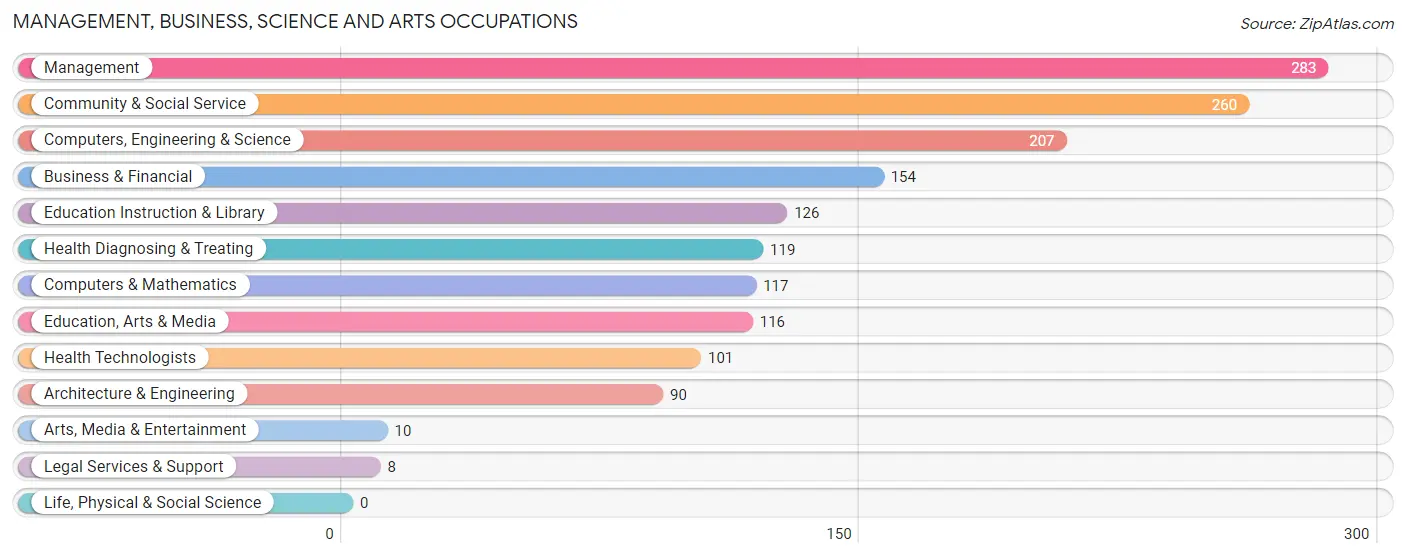
Management, Business, Science and Arts Occupations
The most common Management, Business, Science and Arts occupations in Iron Mountain are Management (283 | 8.4%), Community & Social Service (260 | 7.7%), Computers, Engineering & Science (207 | 6.1%), Business & Financial (154 | 4.6%), and Education Instruction & Library (126 | 3.7%).
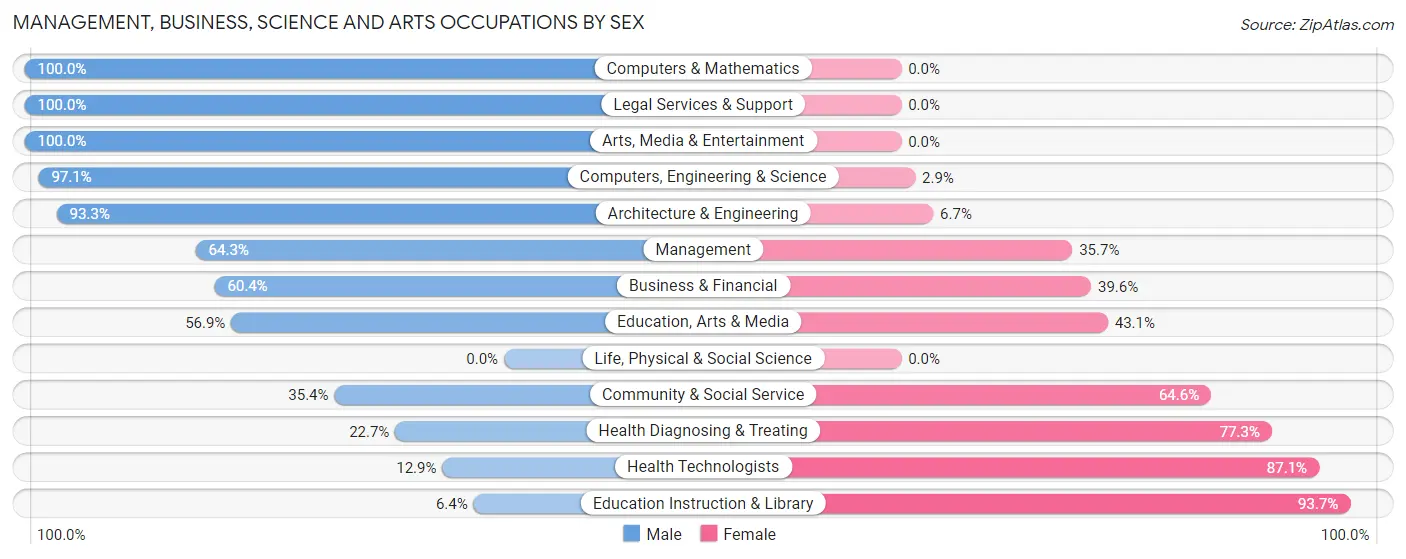
Management, Business, Science and Arts Occupations by Sex
Within the Management, Business, Science and Arts occupations in Iron Mountain, the most male-oriented occupations are Computers & Mathematics (100.0%), Legal Services & Support (100.0%), and Arts, Media & Entertainment (100.0%), while the most female-oriented occupations are Education Instruction & Library (93.6%), Health Technologists (87.1%), and Health Diagnosing & Treating (77.3%).
| Occupation | Male | Female |
| Management | 182 (64.3%) | 101 (35.7%) |
| Business & Financial | 93 (60.4%) | 61 (39.6%) |
| Computers, Engineering & Science | 201 (97.1%) | 6 (2.9%) |
| Computers & Mathematics | 117 (100.0%) | 0 (0.0%) |
| Architecture & Engineering | 84 (93.3%) | 6 (6.7%) |
| Life, Physical & Social Science | 0 (0.0%) | 0 (0.0%) |
| Community & Social Service | 92 (35.4%) | 168 (64.6%) |
| Education, Arts & Media | 66 (56.9%) | 50 (43.1%) |
| Legal Services & Support | 8 (100.0%) | 0 (0.0%) |
| Education Instruction & Library | 8 (6.4%) | 118 (93.6%) |
| Arts, Media & Entertainment | 10 (100.0%) | 0 (0.0%) |
| Health Diagnosing & Treating | 27 (22.7%) | 92 (77.3%) |
| Health Technologists | 13 (12.9%) | 88 (87.1%) |
| Total (Category) | 595 (58.2%) | 428 (41.8%) |
| Total (Overall) | 1,972 (58.6%) | 1,395 (41.4%) |
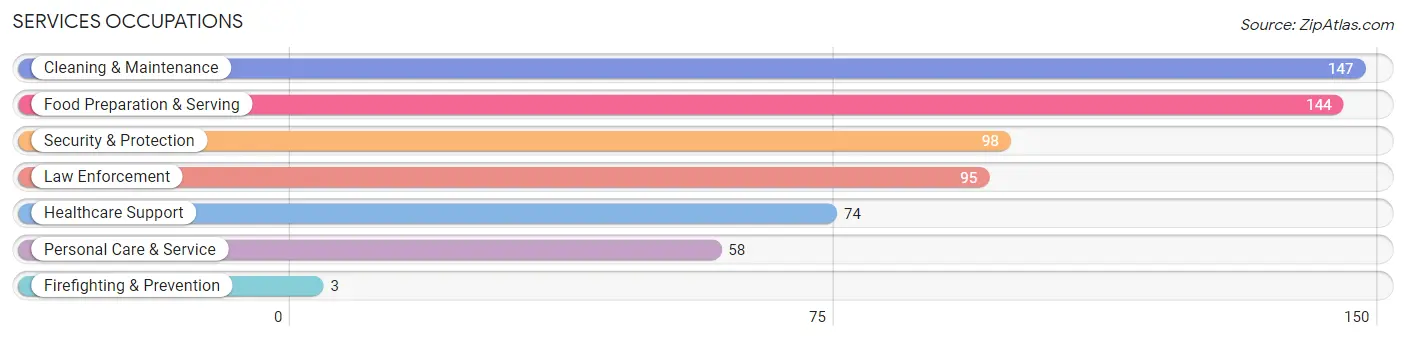
Services Occupations
The most common Services occupations in Iron Mountain are Cleaning & Maintenance (147 | 4.4%), Food Preparation & Serving (144 | 4.3%), Security & Protection (98 | 2.9%), Law Enforcement (95 | 2.8%), and Healthcare Support (74 | 2.2%).
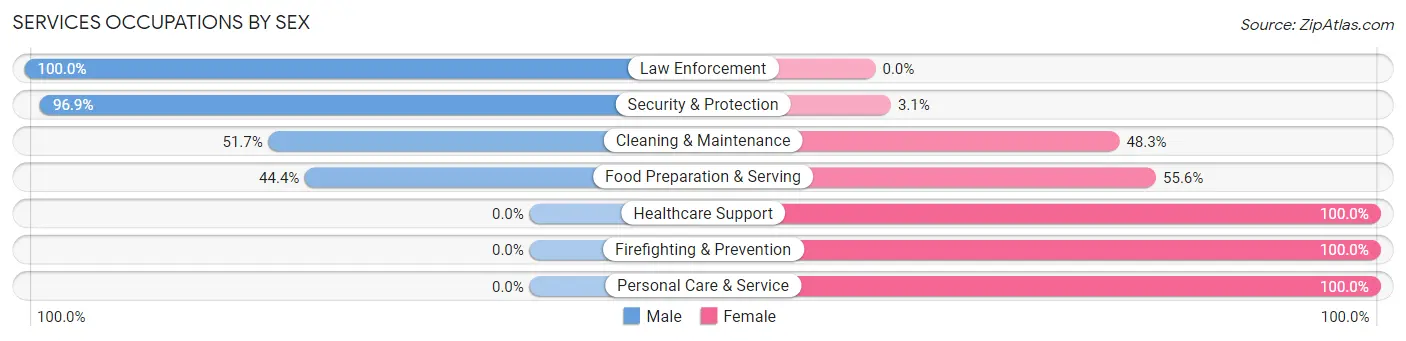
Services Occupations by Sex
Within the Services occupations in Iron Mountain, the most male-oriented occupations are Law Enforcement (100.0%), Security & Protection (96.9%), and Cleaning & Maintenance (51.7%), while the most female-oriented occupations are Healthcare Support (100.0%), Firefighting & Prevention (100.0%), and Personal Care & Service (100.0%).
| Occupation | Male | Female |
| Healthcare Support | 0 (0.0%) | 74 (100.0%) |
| Security & Protection | 95 (96.9%) | 3 (3.1%) |
| Firefighting & Prevention | 0 (0.0%) | 3 (100.0%) |
| Law Enforcement | 95 (100.0%) | 0 (0.0%) |
| Food Preparation & Serving | 64 (44.4%) | 80 (55.6%) |
| Cleaning & Maintenance | 76 (51.7%) | 71 (48.3%) |
| Personal Care & Service | 0 (0.0%) | 58 (100.0%) |
| Total (Category) | 235 (45.1%) | 286 (54.9%) |
| Total (Overall) | 1,972 (58.6%) | 1,395 (41.4%) |
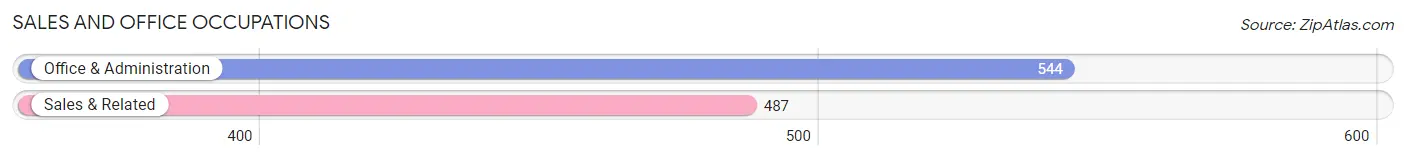
Sales and Office Occupations
The most common Sales and Office occupations in Iron Mountain are Office & Administration (544 | 16.2%), and Sales & Related (487 | 14.5%).
Sales and Office Occupations by Sex
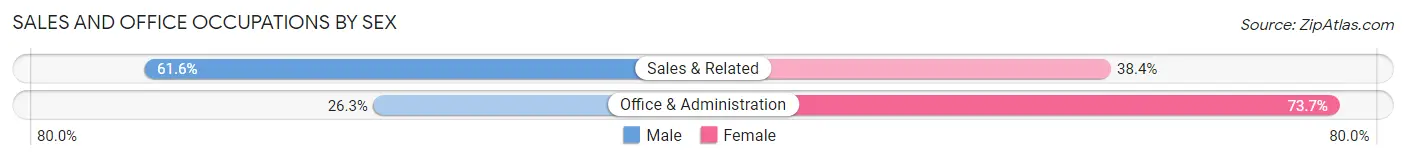
| Occupation | Male | Female |
| Sales & Related | 300 (61.6%) | 187 (38.4%) |
| Office & Administration | 143 (26.3%) | 401 (73.7%) |
| Total (Category) | 443 (43.0%) | 588 (57.0%) |
| Total (Overall) | 1,972 (58.6%) | 1,395 (41.4%) |
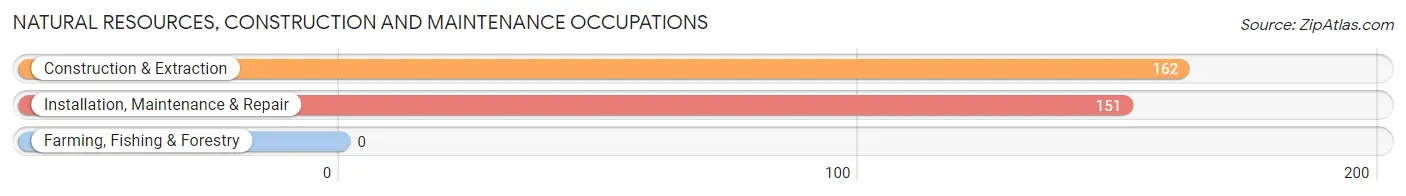
Natural Resources, Construction and Maintenance Occupations
The most common Natural Resources, Construction and Maintenance occupations in Iron Mountain are Construction & Extraction (162 | 4.8%), and Installation, Maintenance & Repair (151 | 4.5%).
Natural Resources, Construction and Maintenance Occupations by Sex
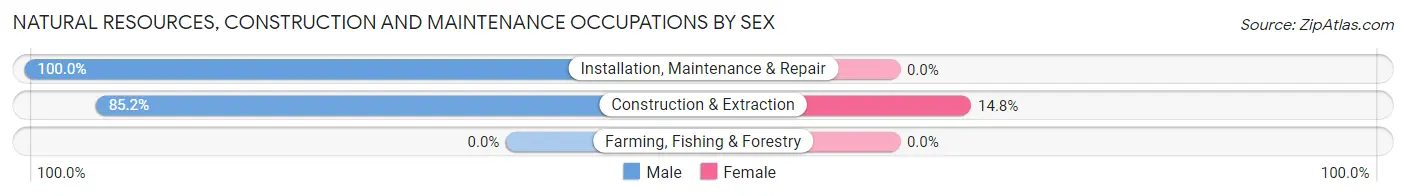
| Occupation | Male | Female |
| Farming, Fishing & Forestry | 0 (0.0%) | 0 (0.0%) |
| Construction & Extraction | 138 (85.2%) | 24 (14.8%) |
| Installation, Maintenance & Repair | 151 (100.0%) | 0 (0.0%) |
| Total (Category) | 289 (92.3%) | 24 (7.7%) |
| Total (Overall) | 1,972 (58.6%) | 1,395 (41.4%) |
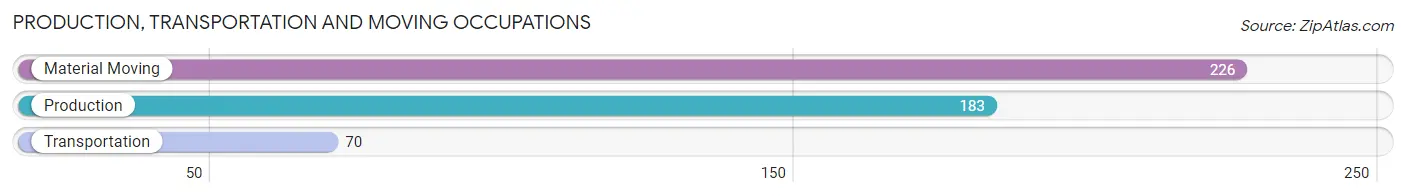
Production, Transportation and Moving Occupations
The most common Production, Transportation and Moving occupations in Iron Mountain are Material Moving (226 | 6.7%), Production (183 | 5.4%), and Transportation (70 | 2.1%).
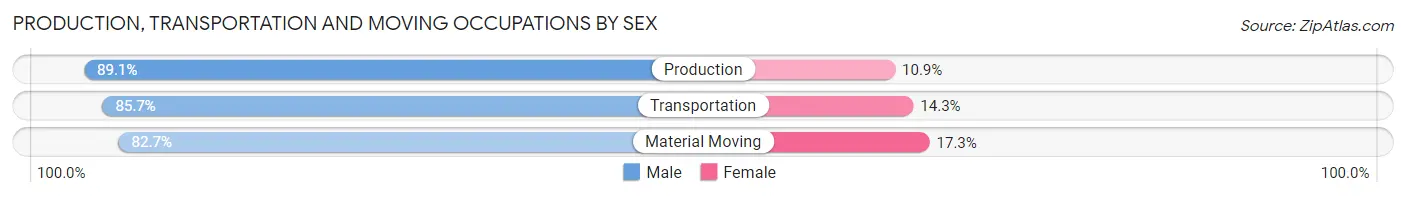
Production, Transportation and Moving Occupations by Sex
| Occupation | Male | Female |
| Production | 163 (89.1%) | 20 (10.9%) |
| Transportation | 60 (85.7%) | 10 (14.3%) |
| Material Moving | 187 (82.7%) | 39 (17.3%) |
| Total (Category) | 410 (85.6%) | 69 (14.4%) |
| Total (Overall) | 1,972 (58.6%) | 1,395 (41.4%) |
Employment Industries by Sex in Iron Mountain
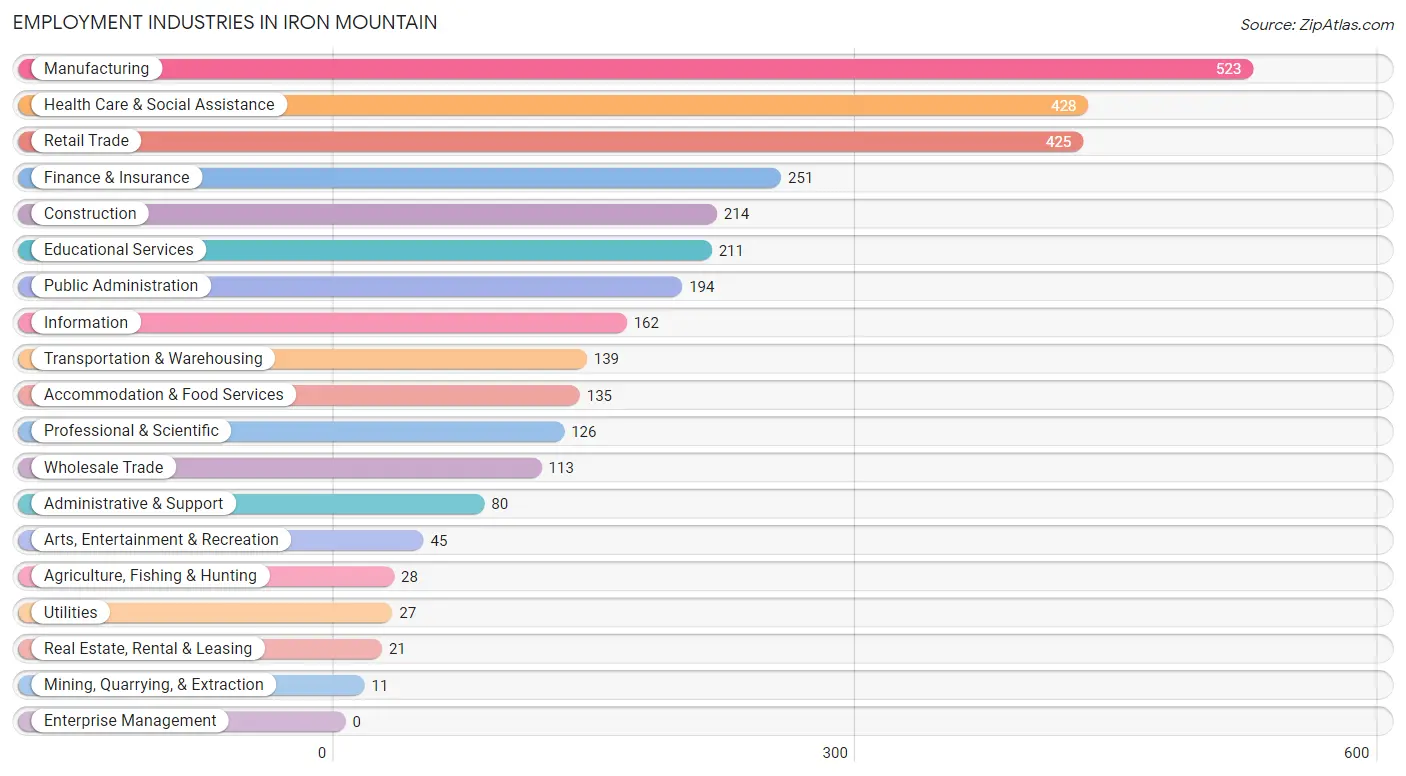
Employment Industries in Iron Mountain
The major employment industries in Iron Mountain include Manufacturing (523 | 15.5%), Health Care & Social Assistance (428 | 12.7%), Retail Trade (425 | 12.6%), Finance & Insurance (251 | 7.4%), and Construction (214 | 6.4%).
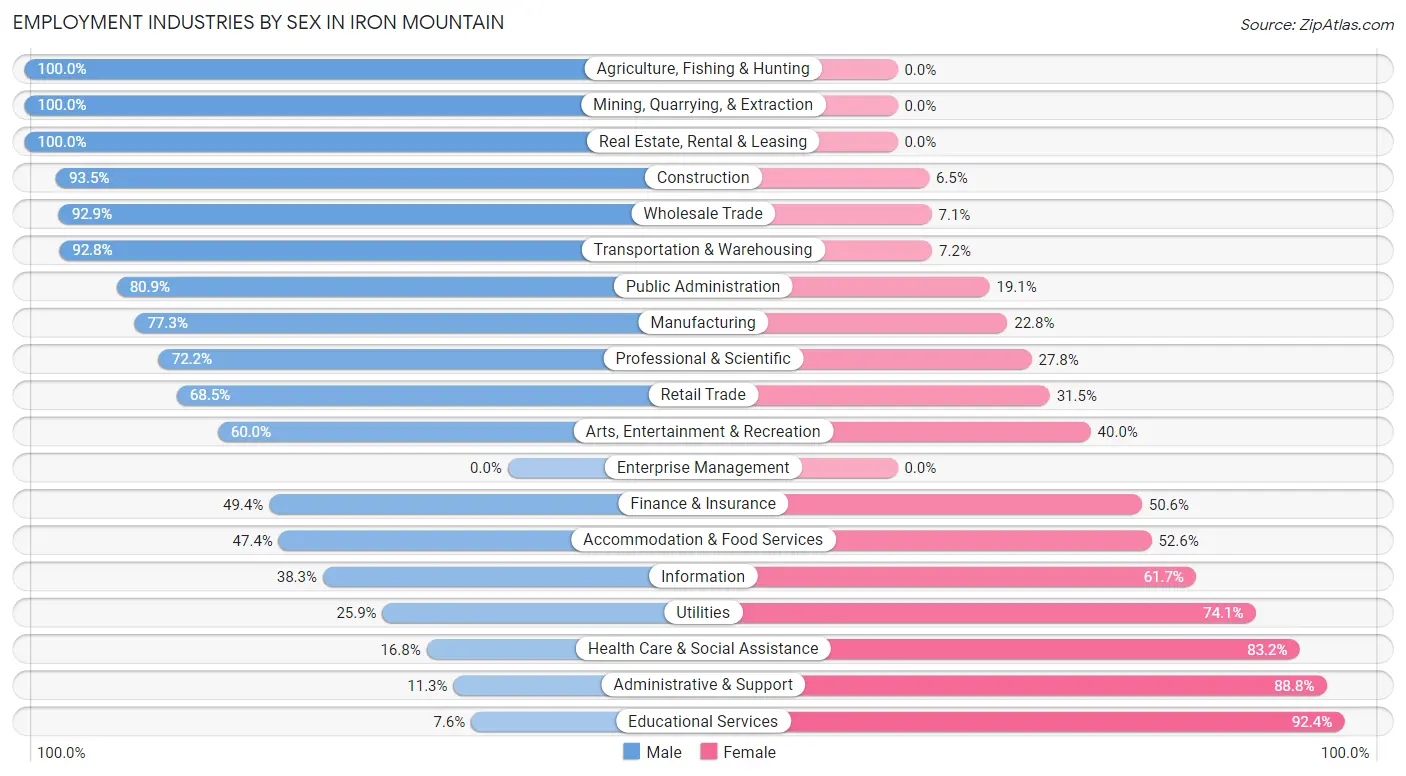
Employment Industries by Sex in Iron Mountain
The Iron Mountain industries that see more men than women are Agriculture, Fishing & Hunting (100.0%), Mining, Quarrying, & Extraction (100.0%), and Real Estate, Rental & Leasing (100.0%), whereas the industries that tend to have a higher number of women are Educational Services (92.4%), Administrative & Support (88.7%), and Health Care & Social Assistance (83.2%).
| Industry | Male | Female |
| Agriculture, Fishing & Hunting | 28 (100.0%) | 0 (0.0%) |
| Mining, Quarrying, & Extraction | 11 (100.0%) | 0 (0.0%) |
| Construction | 200 (93.5%) | 14 (6.5%) |
| Manufacturing | 404 (77.2%) | 119 (22.8%) |
| Wholesale Trade | 105 (92.9%) | 8 (7.1%) |
| Retail Trade | 291 (68.5%) | 134 (31.5%) |
| Transportation & Warehousing | 129 (92.8%) | 10 (7.2%) |
| Utilities | 7 (25.9%) | 20 (74.1%) |
| Information | 62 (38.3%) | 100 (61.7%) |
| Finance & Insurance | 124 (49.4%) | 127 (50.6%) |
| Real Estate, Rental & Leasing | 21 (100.0%) | 0 (0.0%) |
| Professional & Scientific | 91 (72.2%) | 35 (27.8%) |
| Enterprise Management | 0 (0.0%) | 0 (0.0%) |
| Administrative & Support | 9 (11.3%) | 71 (88.7%) |
| Educational Services | 16 (7.6%) | 195 (92.4%) |
| Health Care & Social Assistance | 72 (16.8%) | 356 (83.2%) |
| Arts, Entertainment & Recreation | 27 (60.0%) | 18 (40.0%) |
| Accommodation & Food Services | 64 (47.4%) | 71 (52.6%) |
| Public Administration | 157 (80.9%) | 37 (19.1%) |
| Total | 1,972 (58.6%) | 1,395 (41.4%) |
Education in Iron Mountain
School Enrollment in Iron Mountain
The most common levels of schooling among the 1,510 students in Iron Mountain are elementary school (399 | 26.4%), high school (270 | 17.9%), and college / undergraduate (245 | 16.2%).
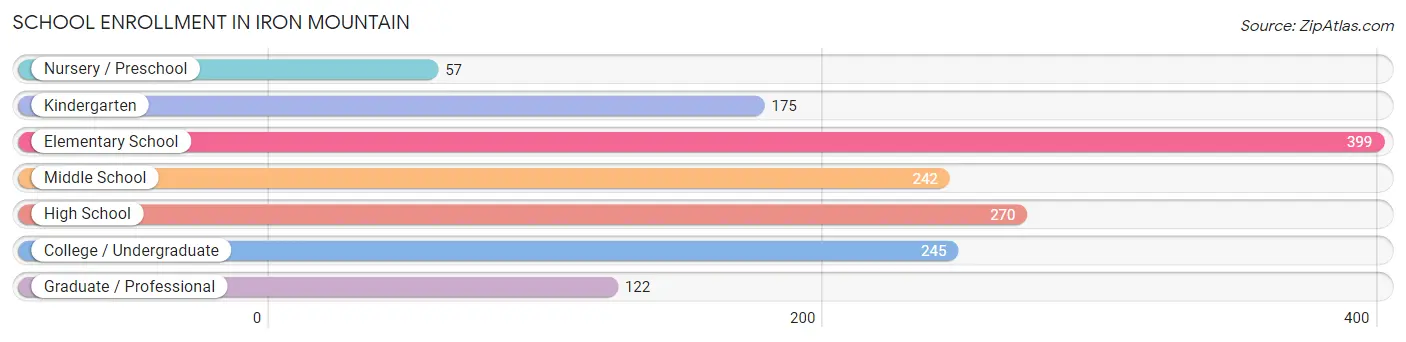
| School Level | # Students | % Students |
| Nursery / Preschool | 57 | 3.8% |
| Kindergarten | 175 | 11.6% |
| Elementary School | 399 | 26.4% |
| Middle School | 242 | 16.0% |
| High School | 270 | 17.9% |
| College / Undergraduate | 245 | 16.2% |
| Graduate / Professional | 122 | 8.1% |
| Total | 1,510 | 100.0% |
School Enrollment by Age by Funding Source in Iron Mountain
Out of a total of 1,510 students who are enrolled in schools in Iron Mountain, 290 (19.2%) attend a private institution, while the remaining 1,220 (80.8%) are enrolled in public schools. The age group of 3 to 4 year olds has the highest likelihood of being enrolled in private schools, with 9 (100.0% in the age bracket) enrolled. Conversely, the age group of 15 to 17 year olds has the lowest likelihood of being enrolled in a private school, with 219 (93.6% in the age bracket) attending a public institution.
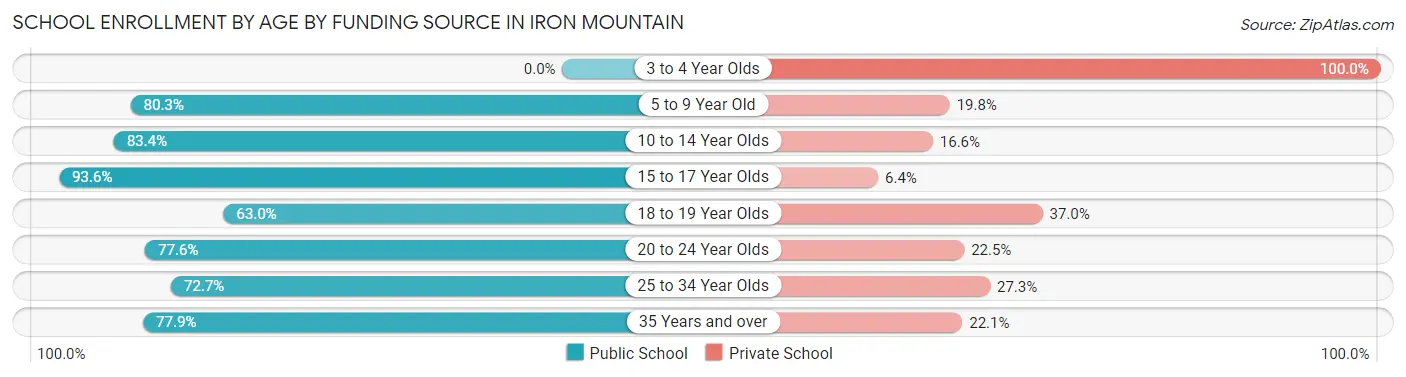
| Age Bracket | Public School | Private School |
| 3 to 4 Year Olds | 0 (0.0%) | 9 (100.0%) |
| 5 to 9 Year Old | 451 (80.2%) | 111 (19.8%) |
| 10 to 14 Year Olds | 261 (83.4%) | 52 (16.6%) |
| 15 to 17 Year Olds | 219 (93.6%) | 15 (6.4%) |
| 18 to 19 Year Olds | 34 (63.0%) | 20 (37.0%) |
| 20 to 24 Year Olds | 76 (77.5%) | 22 (22.5%) |
| 25 to 34 Year Olds | 112 (72.7%) | 42 (27.3%) |
| 35 Years and over | 67 (77.9%) | 19 (22.1%) |
| Total | 1,220 (80.8%) | 290 (19.2%) |
Educational Attainment by Field of Study in Iron Mountain
Education (298 | 19.4%), engineering (221 | 14.3%), science & technology (212 | 13.8%), arts & humanities (203 | 13.2%), and business (194 | 12.6%) are the most common fields of study among 1,540 individuals in Iron Mountain who have obtained a bachelor's degree or higher.
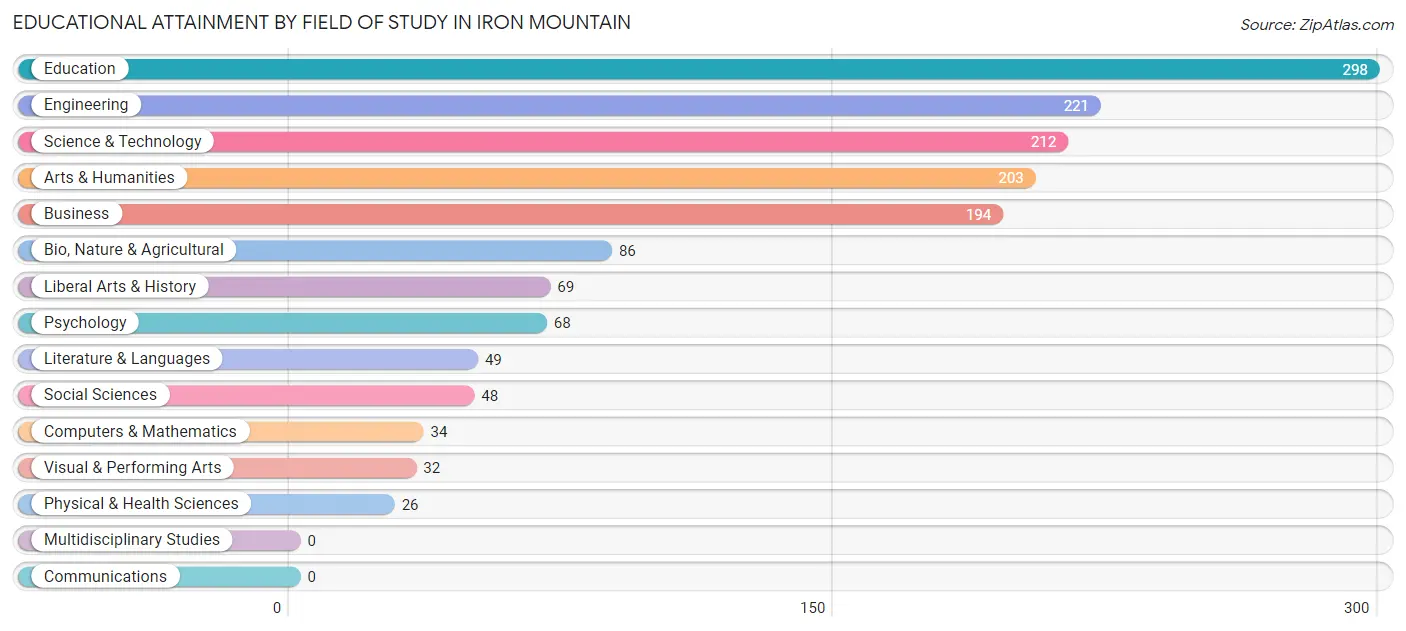
| Field of Study | # Graduates | % Graduates |
| Computers & Mathematics | 34 | 2.2% |
| Bio, Nature & Agricultural | 86 | 5.6% |
| Physical & Health Sciences | 26 | 1.7% |
| Psychology | 68 | 4.4% |
| Social Sciences | 48 | 3.1% |
| Engineering | 221 | 14.3% |
| Multidisciplinary Studies | 0 | 0.0% |
| Science & Technology | 212 | 13.8% |
| Business | 194 | 12.6% |
| Education | 298 | 19.4% |
| Literature & Languages | 49 | 3.2% |
| Liberal Arts & History | 69 | 4.5% |
| Visual & Performing Arts | 32 | 2.1% |
| Communications | 0 | 0.0% |
| Arts & Humanities | 203 | 13.2% |
| Total | 1,540 | 100.0% |
Transportation & Commute in Iron Mountain
Vehicle Availability by Sex in Iron Mountain
The most prevalent vehicle ownership categories in Iron Mountain are males with 2 vehicles (832, accounting for 43.7%) and females with 2 vehicles (699, making up 59.8%).
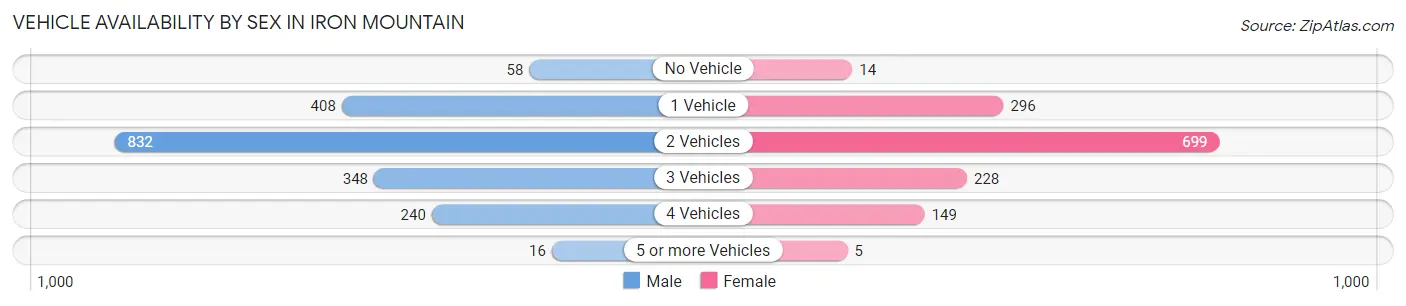
| Vehicles Available | Male | Female |
| No Vehicle | 58 (3.0%) | 14 (1.0%) |
| 1 Vehicle | 408 (21.4%) | 296 (21.3%) |
| 2 Vehicles | 832 (43.7%) | 699 (50.2%) |
| 3 Vehicles | 348 (18.3%) | 228 (16.4%) |
| 4 Vehicles | 240 (12.6%) | 149 (10.7%) |
| 5 or more Vehicles | 16 (0.8%) | 5 (0.4%) |
| Total | 1,902 (100.0%) | 1,391 (100.0%) |
Commute Time in Iron Mountain
The most frequently occuring commute durations in Iron Mountain are 5 to 9 minutes (1,214 commuters, 41.7%), 10 to 14 minutes (696 commuters, 23.9%), and less than 5 minutes (273 commuters, 9.4%).
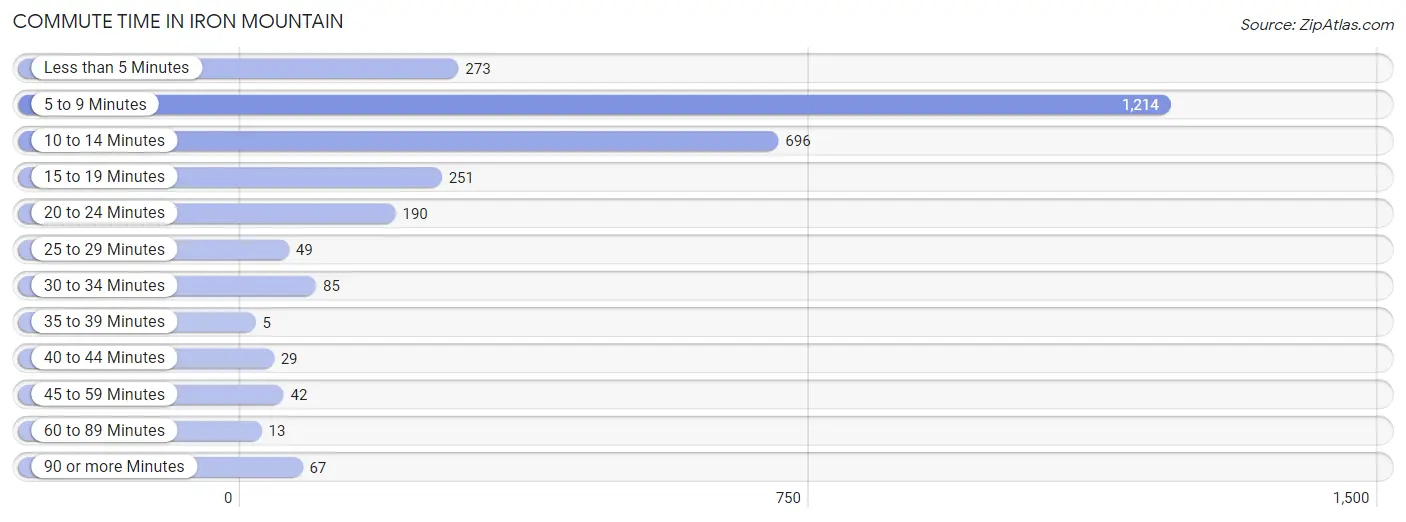
| Commute Time | # Commuters | % Commuters |
| Less than 5 Minutes | 273 | 9.4% |
| 5 to 9 Minutes | 1,214 | 41.7% |
| 10 to 14 Minutes | 696 | 23.9% |
| 15 to 19 Minutes | 251 | 8.6% |
| 20 to 24 Minutes | 190 | 6.5% |
| 25 to 29 Minutes | 49 | 1.7% |
| 30 to 34 Minutes | 85 | 2.9% |
| 35 to 39 Minutes | 5 | 0.2% |
| 40 to 44 Minutes | 29 | 1.0% |
| 45 to 59 Minutes | 42 | 1.4% |
| 60 to 89 Minutes | 13 | 0.4% |
| 90 or more Minutes | 67 | 2.3% |
Commute Time by Sex in Iron Mountain
The most common commute times in Iron Mountain are 5 to 9 minutes (677 commuters, 39.9%) for males and 5 to 9 minutes (537 commuters, 44.2%) for females.
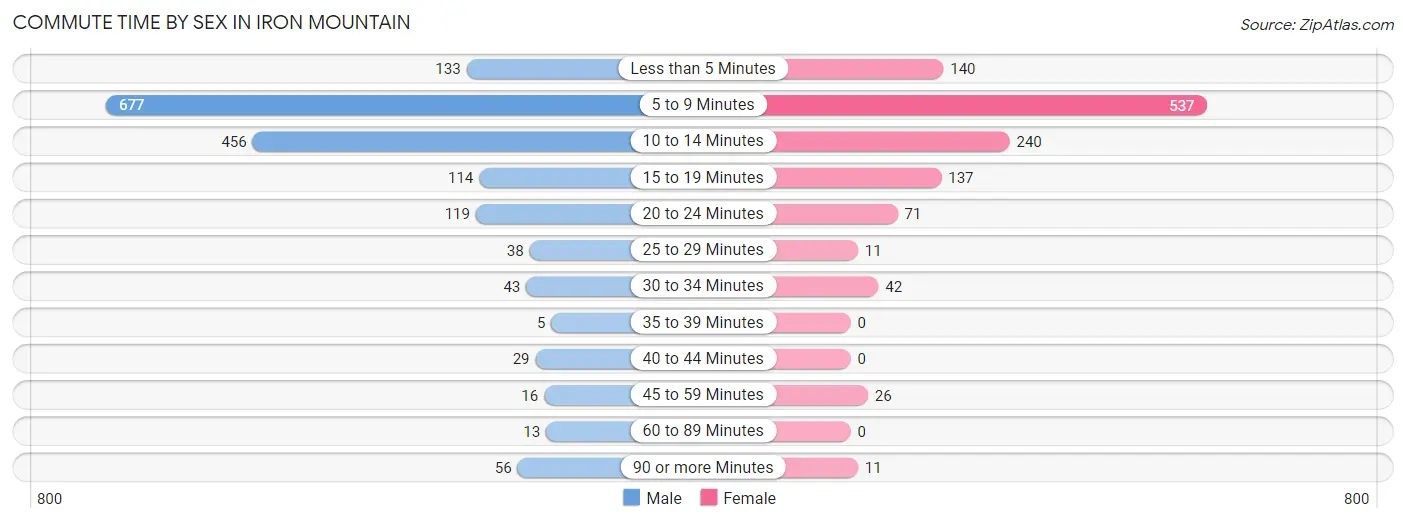
| Commute Time | Male | Female |
| Less than 5 Minutes | 133 (7.8%) | 140 (11.5%) |
| 5 to 9 Minutes | 677 (39.9%) | 537 (44.2%) |
| 10 to 14 Minutes | 456 (26.8%) | 240 (19.8%) |
| 15 to 19 Minutes | 114 (6.7%) | 137 (11.3%) |
| 20 to 24 Minutes | 119 (7.0%) | 71 (5.8%) |
| 25 to 29 Minutes | 38 (2.2%) | 11 (0.9%) |
| 30 to 34 Minutes | 43 (2.5%) | 42 (3.5%) |
| 35 to 39 Minutes | 5 (0.3%) | 0 (0.0%) |
| 40 to 44 Minutes | 29 (1.7%) | 0 (0.0%) |
| 45 to 59 Minutes | 16 (0.9%) | 26 (2.1%) |
| 60 to 89 Minutes | 13 (0.8%) | 0 (0.0%) |
| 90 or more Minutes | 56 (3.3%) | 11 (0.9%) |
Time of Departure to Work by Sex in Iron Mountain
The most frequent times of departure to work in Iron Mountain are 7:30 AM to 7:59 AM (268, 15.8%) for males and 7:30 AM to 7:59 AM (319, 26.3%) for females.
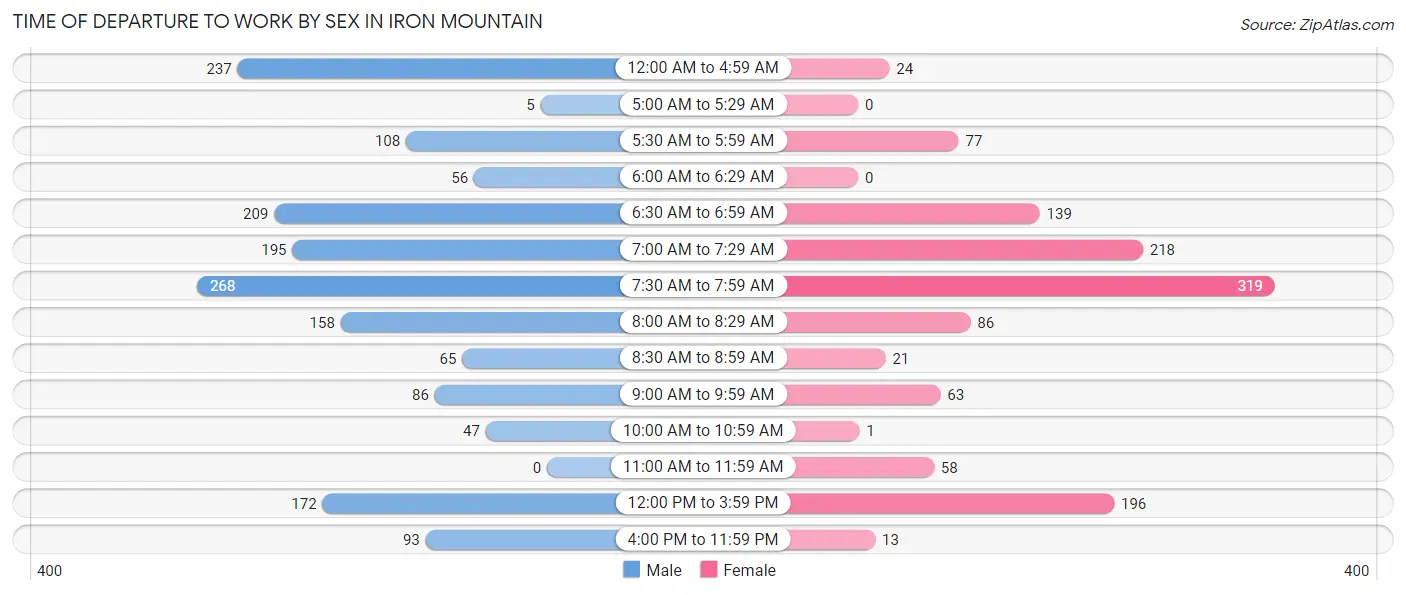
| Time of Departure | Male | Female |
| 12:00 AM to 4:59 AM | 237 (14.0%) | 24 (2.0%) |
| 5:00 AM to 5:29 AM | 5 (0.3%) | 0 (0.0%) |
| 5:30 AM to 5:59 AM | 108 (6.4%) | 77 (6.3%) |
| 6:00 AM to 6:29 AM | 56 (3.3%) | 0 (0.0%) |
| 6:30 AM to 6:59 AM | 209 (12.3%) | 139 (11.4%) |
| 7:00 AM to 7:29 AM | 195 (11.5%) | 218 (17.9%) |
| 7:30 AM to 7:59 AM | 268 (15.8%) | 319 (26.3%) |
| 8:00 AM to 8:29 AM | 158 (9.3%) | 86 (7.1%) |
| 8:30 AM to 8:59 AM | 65 (3.8%) | 21 (1.7%) |
| 9:00 AM to 9:59 AM | 86 (5.1%) | 63 (5.2%) |
| 10:00 AM to 10:59 AM | 47 (2.8%) | 1 (0.1%) |
| 11:00 AM to 11:59 AM | 0 (0.0%) | 58 (4.8%) |
| 12:00 PM to 3:59 PM | 172 (10.1%) | 196 (16.1%) |
| 4:00 PM to 11:59 PM | 93 (5.5%) | 13 (1.1%) |
| Total | 1,699 (100.0%) | 1,215 (100.0%) |
Housing Occupancy in Iron Mountain
Occupancy by Ownership in Iron Mountain
Of the total 3,393 dwellings in Iron Mountain, owner-occupied units account for 2,575 (75.9%), while renter-occupied units make up 818 (24.1%).
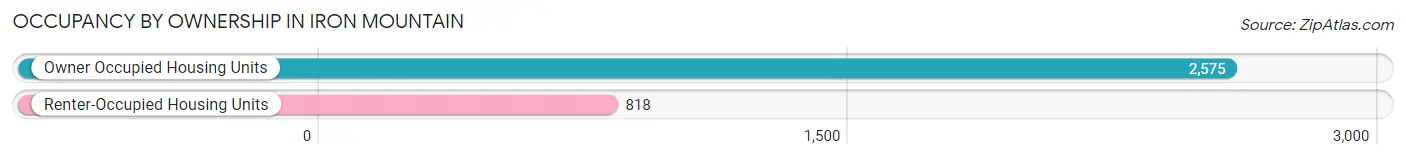
| Occupancy | # Housing Units | % Housing Units |
| Owner Occupied Housing Units | 2,575 | 75.9% |
| Renter-Occupied Housing Units | 818 | 24.1% |
| Total Occupied Housing Units | 3,393 | 100.0% |
Occupancy by Household Size in Iron Mountain
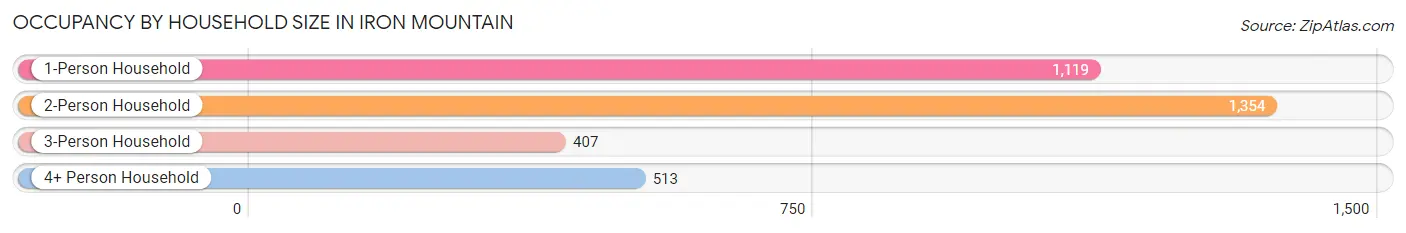
| Household Size | # Housing Units | % Housing Units |
| 1-Person Household | 1,119 | 33.0% |
| 2-Person Household | 1,354 | 39.9% |
| 3-Person Household | 407 | 12.0% |
| 4+ Person Household | 513 | 15.1% |
| Total Housing Units | 3,393 | 100.0% |
Occupancy by Ownership by Household Size in Iron Mountain
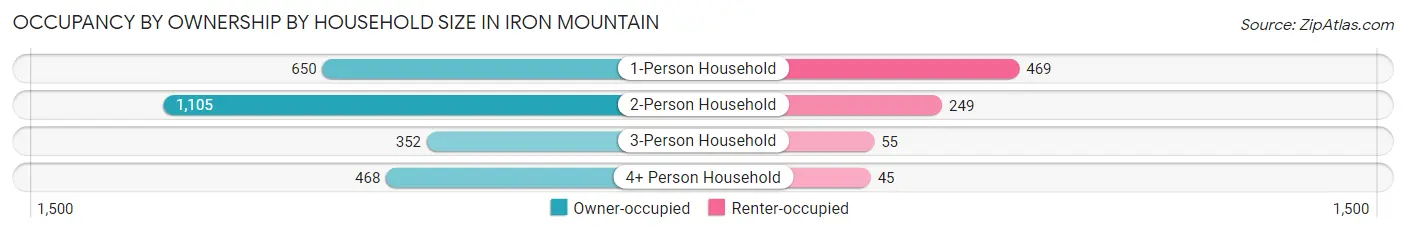
| Household Size | Owner-occupied | Renter-occupied |
| 1-Person Household | 650 (58.1%) | 469 (41.9%) |
| 2-Person Household | 1,105 (81.6%) | 249 (18.4%) |
| 3-Person Household | 352 (86.5%) | 55 (13.5%) |
| 4+ Person Household | 468 (91.2%) | 45 (8.8%) |
| Total Housing Units | 2,575 (75.9%) | 818 (24.1%) |
Occupancy by Educational Attainment in Iron Mountain
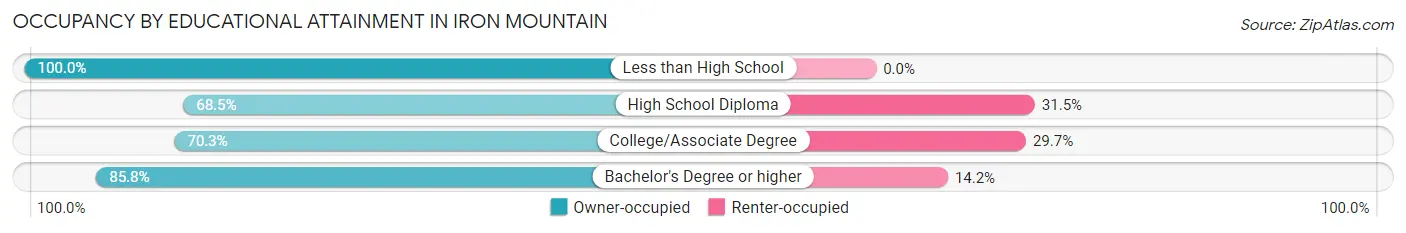
| Household Size | Owner-occupied | Renter-occupied |
| Less than High School | 174 (100.0%) | 0 (0.0%) |
| High School Diploma | 551 (68.5%) | 253 (31.5%) |
| College/Associate Degree | 1,006 (70.3%) | 425 (29.7%) |
| Bachelor's Degree or higher | 844 (85.8%) | 140 (14.2%) |
Occupancy by Age of Householder in Iron Mountain
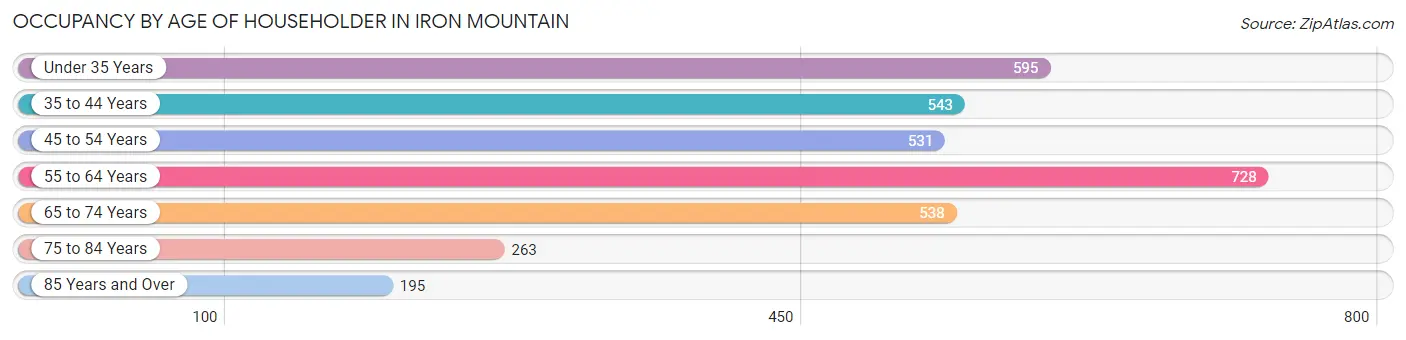
| Age Bracket | # Households | % Households |
| Under 35 Years | 595 | 17.5% |
| 35 to 44 Years | 543 | 16.0% |
| 45 to 54 Years | 531 | 15.7% |
| 55 to 64 Years | 728 | 21.5% |
| 65 to 74 Years | 538 | 15.9% |
| 75 to 84 Years | 263 | 7.7% |
| 85 Years and Over | 195 | 5.8% |
| Total | 3,393 | 100.0% |
Housing Finances in Iron Mountain
Median Income by Occupancy in Iron Mountain
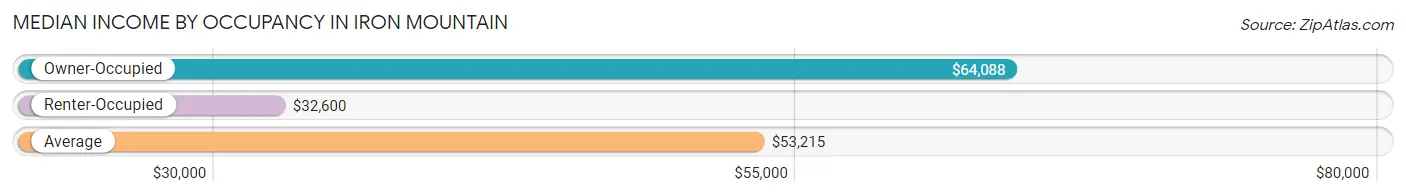
| Occupancy Type | # Households | Median Income |
| Owner-Occupied | 2,575 (75.9%) | $64,088 |
| Renter-Occupied | 818 (24.1%) | $32,600 |
| Average | 3,393 (100.0%) | $53,215 |
Occupancy by Householder Income Bracket in Iron Mountain
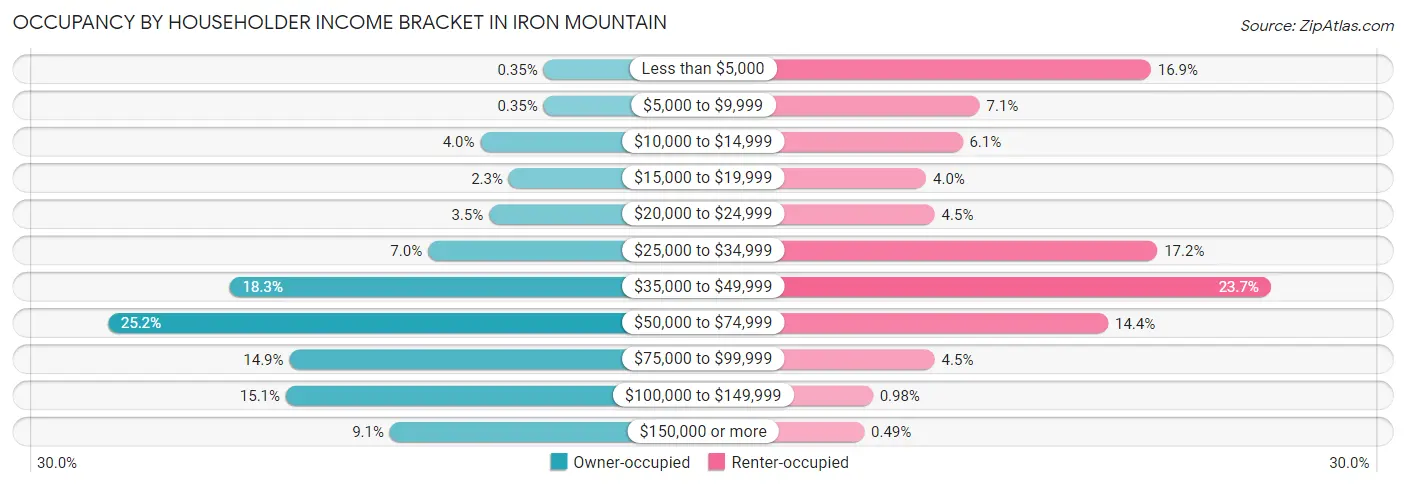
| Income Bracket | Owner-occupied | Renter-occupied |
| Less than $5,000 | 9 (0.4%) | 138 (16.9%) |
| $5,000 to $9,999 | 9 (0.4%) | 58 (7.1%) |
| $10,000 to $14,999 | 102 (4.0%) | 50 (6.1%) |
| $15,000 to $19,999 | 60 (2.3%) | 33 (4.0%) |
| $20,000 to $24,999 | 89 (3.5%) | 37 (4.5%) |
| $25,000 to $34,999 | 179 (7.0%) | 141 (17.2%) |
| $35,000 to $49,999 | 471 (18.3%) | 194 (23.7%) |
| $50,000 to $74,999 | 650 (25.2%) | 118 (14.4%) |
| $75,000 to $99,999 | 383 (14.9%) | 37 (4.5%) |
| $100,000 to $149,999 | 388 (15.1%) | 8 (1.0%) |
| $150,000 or more | 235 (9.1%) | 4 (0.5%) |
| Total | 2,575 (100.0%) | 818 (100.0%) |
Monthly Housing Cost Tiers in Iron Mountain
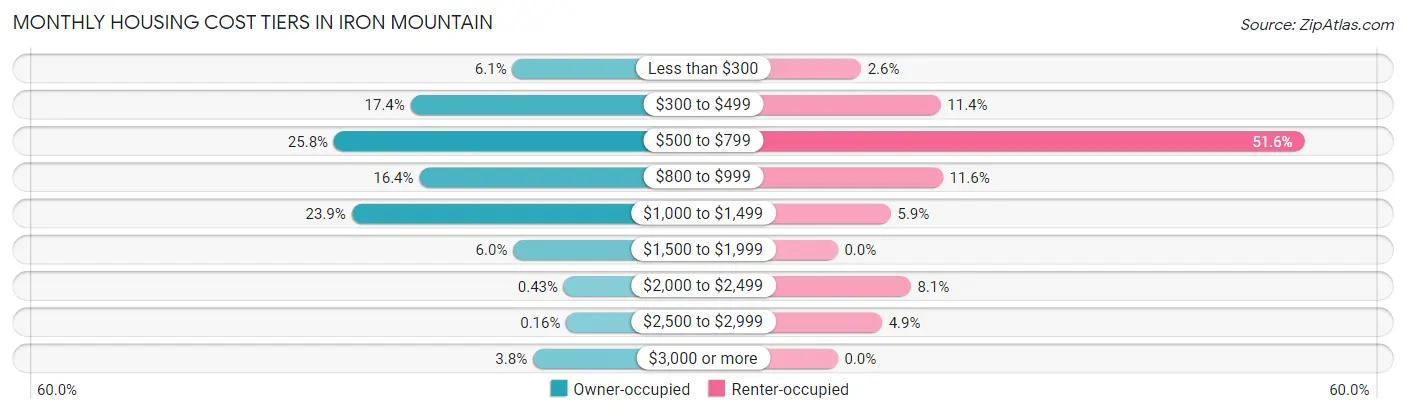
| Monthly Cost | Owner-occupied | Renter-occupied |
| Less than $300 | 157 (6.1%) | 21 (2.6%) |
| $300 to $499 | 447 (17.4%) | 93 (11.4%) |
| $500 to $799 | 665 (25.8%) | 422 (51.6%) |
| $800 to $999 | 422 (16.4%) | 95 (11.6%) |
| $1,000 to $1,499 | 615 (23.9%) | 48 (5.9%) |
| $1,500 to $1,999 | 155 (6.0%) | 0 (0.0%) |
| $2,000 to $2,499 | 11 (0.4%) | 66 (8.1%) |
| $2,500 to $2,999 | 4 (0.2%) | 40 (4.9%) |
| $3,000 or more | 99 (3.8%) | 0 (0.0%) |
| Total | 2,575 (100.0%) | 818 (100.0%) |
Physical Housing Characteristics in Iron Mountain
Housing Structures in Iron Mountain
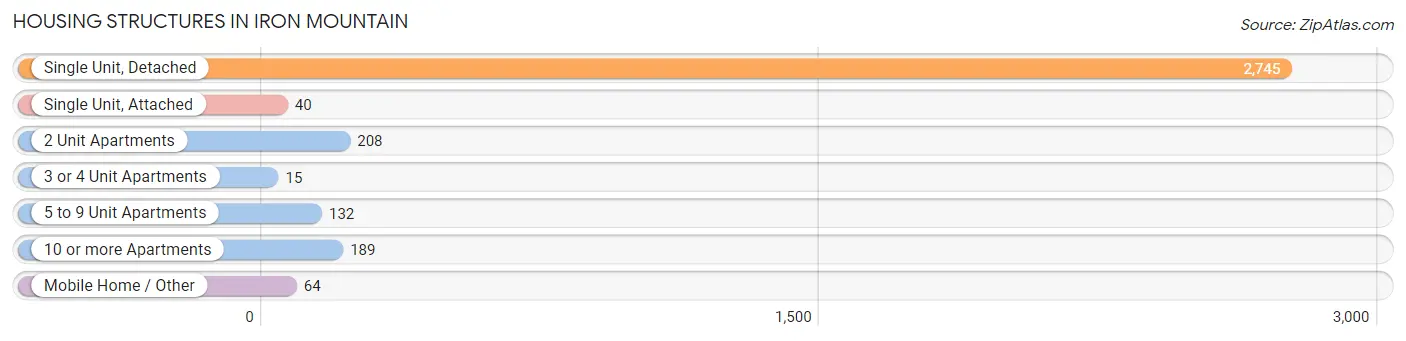
| Structure Type | # Housing Units | % Housing Units |
| Single Unit, Detached | 2,745 | 80.9% |
| Single Unit, Attached | 40 | 1.2% |
| 2 Unit Apartments | 208 | 6.1% |
| 3 or 4 Unit Apartments | 15 | 0.4% |
| 5 to 9 Unit Apartments | 132 | 3.9% |
| 10 or more Apartments | 189 | 5.6% |
| Mobile Home / Other | 64 | 1.9% |
| Total | 3,393 | 100.0% |
Housing Structures by Occupancy in Iron Mountain
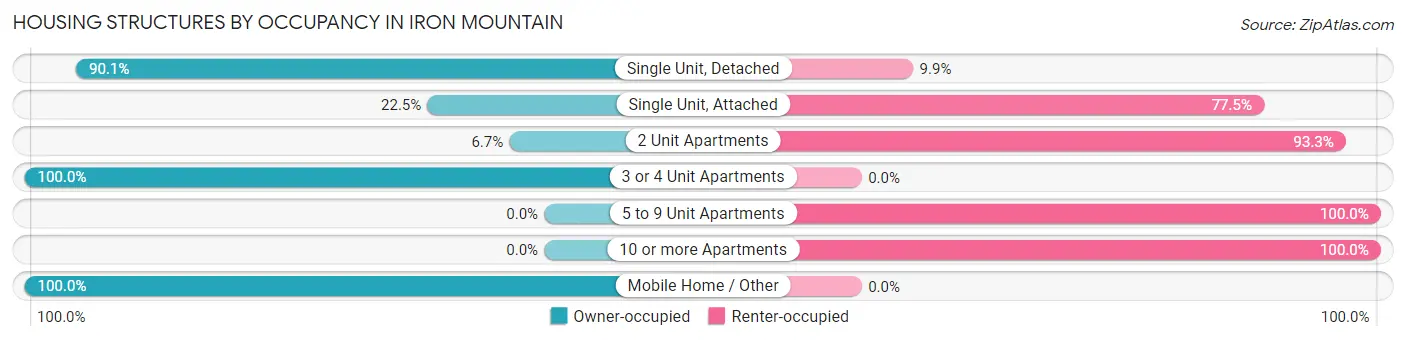
| Structure Type | Owner-occupied | Renter-occupied |
| Single Unit, Detached | 2,473 (90.1%) | 272 (9.9%) |
| Single Unit, Attached | 9 (22.5%) | 31 (77.5%) |
| 2 Unit Apartments | 14 (6.7%) | 194 (93.3%) |
| 3 or 4 Unit Apartments | 15 (100.0%) | 0 (0.0%) |
| 5 to 9 Unit Apartments | 0 (0.0%) | 132 (100.0%) |
| 10 or more Apartments | 0 (0.0%) | 189 (100.0%) |
| Mobile Home / Other | 64 (100.0%) | 0 (0.0%) |
| Total | 2,575 (75.9%) | 818 (24.1%) |
Housing Structures by Number of Rooms in Iron Mountain
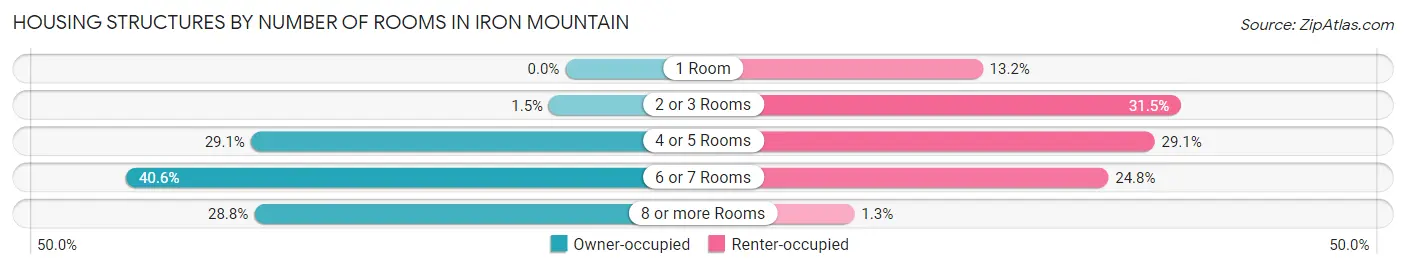
| Number of Rooms | Owner-occupied | Renter-occupied |
| 1 Room | 0 (0.0%) | 108 (13.2%) |
| 2 or 3 Rooms | 39 (1.5%) | 258 (31.5%) |
| 4 or 5 Rooms | 749 (29.1%) | 238 (29.1%) |
| 6 or 7 Rooms | 1,046 (40.6%) | 203 (24.8%) |
| 8 or more Rooms | 741 (28.8%) | 11 (1.3%) |
| Total | 2,575 (100.0%) | 818 (100.0%) |
Housing Structure by Heating Type in Iron Mountain
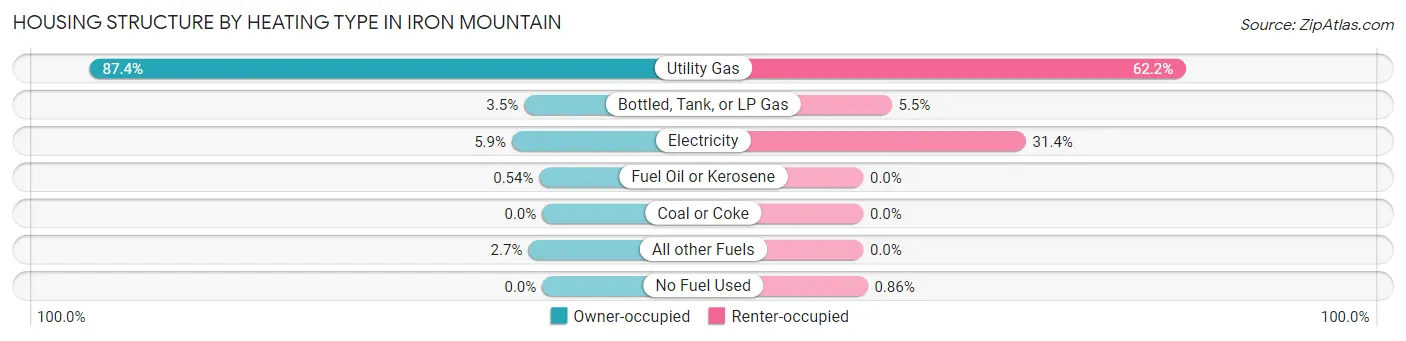
| Heating Type | Owner-occupied | Renter-occupied |
| Utility Gas | 2,251 (87.4%) | 509 (62.2%) |
| Bottled, Tank, or LP Gas | 90 (3.5%) | 45 (5.5%) |
| Electricity | 151 (5.9%) | 257 (31.4%) |
| Fuel Oil or Kerosene | 14 (0.5%) | 0 (0.0%) |
| Coal or Coke | 0 (0.0%) | 0 (0.0%) |
| All other Fuels | 69 (2.7%) | 0 (0.0%) |
| No Fuel Used | 0 (0.0%) | 7 (0.9%) |
| Total | 2,575 (100.0%) | 818 (100.0%) |
Household Vehicle Usage in Iron Mountain
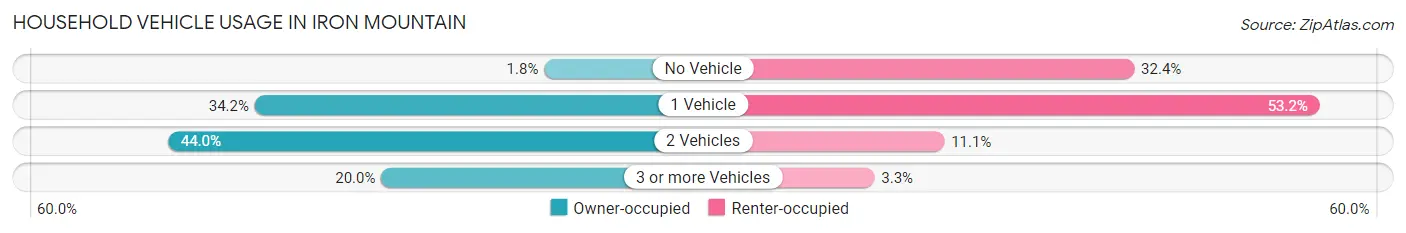
| Vehicles per Household | Owner-occupied | Renter-occupied |
| No Vehicle | 46 (1.8%) | 265 (32.4%) |
| 1 Vehicle | 881 (34.2%) | 435 (53.2%) |
| 2 Vehicles | 1,132 (44.0%) | 91 (11.1%) |
| 3 or more Vehicles | 516 (20.0%) | 27 (3.3%) |
| Total | 2,575 (100.0%) | 818 (100.0%) |
Real Estate & Mortgages in Iron Mountain
Real Estate and Mortgage Overview in Iron Mountain
| Characteristic | Without Mortgage | With Mortgage |
| Housing Units | 1,084 | 1,491 |
| Median Property Value | $98,100 | $119,500 |
| Median Household Income | $50,833 | $150 |
| Monthly Housing Costs | $479 | $99 |
| Real Estate Taxes | $1,833 | $17 |
Property Value by Mortgage Status in Iron Mountain
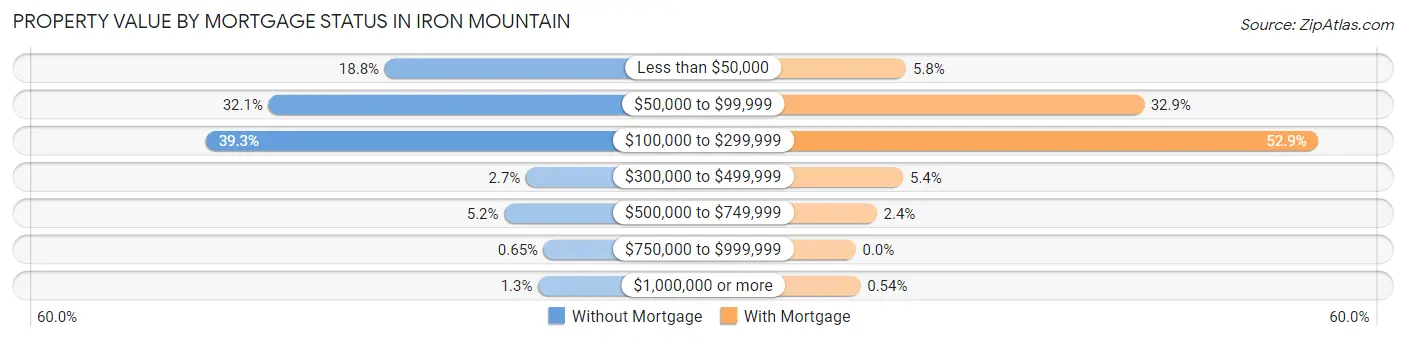
| Property Value | Without Mortgage | With Mortgage |
| Less than $50,000 | 204 (18.8%) | 86 (5.8%) |
| $50,000 to $99,999 | 348 (32.1%) | 491 (32.9%) |
| $100,000 to $299,999 | 426 (39.3%) | 789 (52.9%) |
| $300,000 to $499,999 | 29 (2.7%) | 81 (5.4%) |
| $500,000 to $749,999 | 56 (5.2%) | 36 (2.4%) |
| $750,000 to $999,999 | 7 (0.6%) | 0 (0.0%) |
| $1,000,000 or more | 14 (1.3%) | 8 (0.5%) |
| Total | 1,084 (100.0%) | 1,491 (100.0%) |
Household Income by Mortgage Status in Iron Mountain
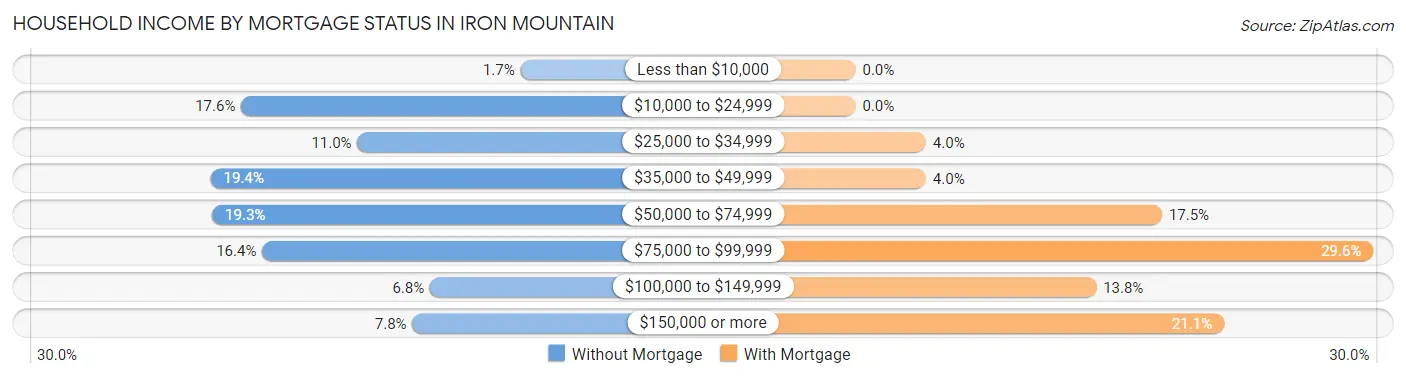
| Household Income | Without Mortgage | With Mortgage |
| Less than $10,000 | 18 (1.7%) | 0 (0.0%) |
| $10,000 to $24,999 | 191 (17.6%) | 0 (0.0%) |
| $25,000 to $34,999 | 119 (11.0%) | 60 (4.0%) |
| $35,000 to $49,999 | 210 (19.4%) | 60 (4.0%) |
| $50,000 to $74,999 | 209 (19.3%) | 261 (17.5%) |
| $75,000 to $99,999 | 178 (16.4%) | 441 (29.6%) |
| $100,000 to $149,999 | 74 (6.8%) | 205 (13.8%) |
| $150,000 or more | 85 (7.8%) | 314 (21.1%) |
| Total | 1,084 (100.0%) | 1,491 (100.0%) |
Property Value to Household Income Ratio in Iron Mountain
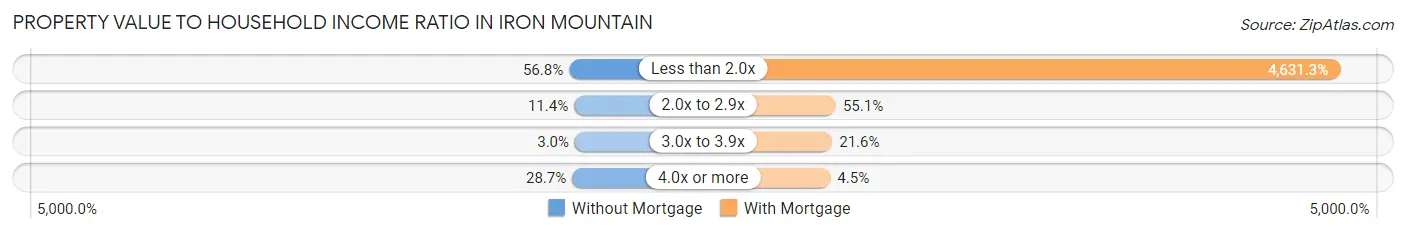
| Value-to-Income Ratio | Without Mortgage | With Mortgage |
| Less than 2.0x | 616 (56.8%) | 69,053 (4,631.3%) |
| 2.0x to 2.9x | 124 (11.4%) | 821 (55.1%) |
| 3.0x to 3.9x | 33 (3.0%) | 322 (21.6%) |
| 4.0x or more | 311 (28.7%) | 67 (4.5%) |
| Total | 1,084 (100.0%) | 1,491 (100.0%) |
Real Estate Taxes by Mortgage Status in Iron Mountain
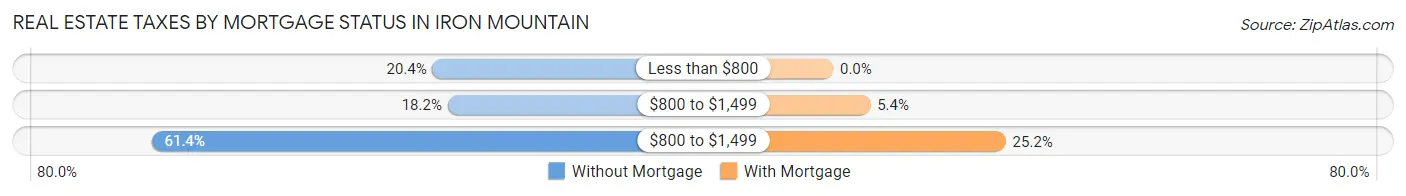
| Property Taxes | Without Mortgage | With Mortgage |
| Less than $800 | 221 (20.4%) | 0 (0.0%) |
| $800 to $1,499 | 197 (18.2%) | 81 (5.4%) |
| $800 to $1,499 | 666 (61.4%) | 376 (25.2%) |
| Total | 1,084 (100.0%) | 1,491 (100.0%) |
Health & Disability in Iron Mountain
Health Insurance Coverage by Age in Iron Mountain
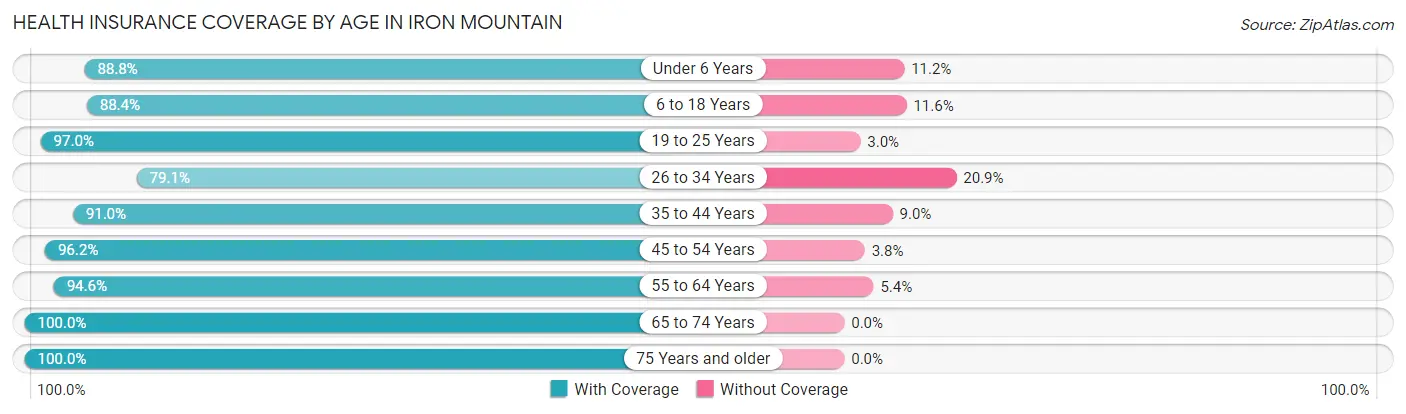
| Age Bracket | With Coverage | Without Coverage |
| Under 6 Years | 501 (88.8%) | 63 (11.2%) |
| 6 to 18 Years | 892 (88.4%) | 117 (11.6%) |
| 19 to 25 Years | 549 (97.0%) | 17 (3.0%) |
| 26 to 34 Years | 670 (79.1%) | 177 (20.9%) |
| 35 to 44 Years | 808 (91.0%) | 80 (9.0%) |
| 45 to 54 Years | 909 (96.2%) | 36 (3.8%) |
| 55 to 64 Years | 1,008 (94.6%) | 58 (5.4%) |
| 65 to 74 Years | 885 (100.0%) | 0 (0.0%) |
| 75 Years and older | 603 (100.0%) | 0 (0.0%) |
| Total | 6,825 (92.6%) | 548 (7.4%) |
Health Insurance Coverage by Citizenship Status in Iron Mountain
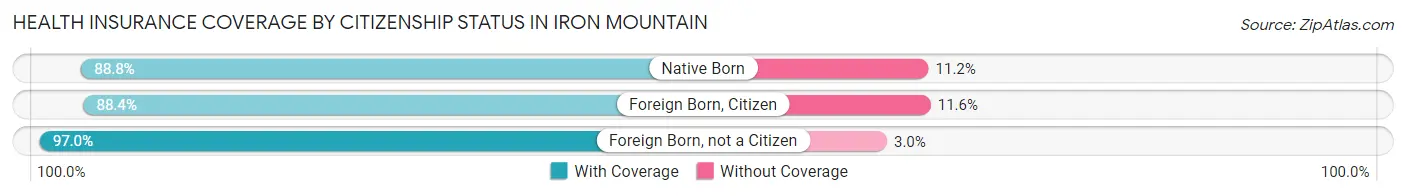
| Citizenship Status | With Coverage | Without Coverage |
| Native Born | 501 (88.8%) | 63 (11.2%) |
| Foreign Born, Citizen | 892 (88.4%) | 117 (11.6%) |
| Foreign Born, not a Citizen | 549 (97.0%) | 17 (3.0%) |
Health Insurance Coverage by Household Income in Iron Mountain
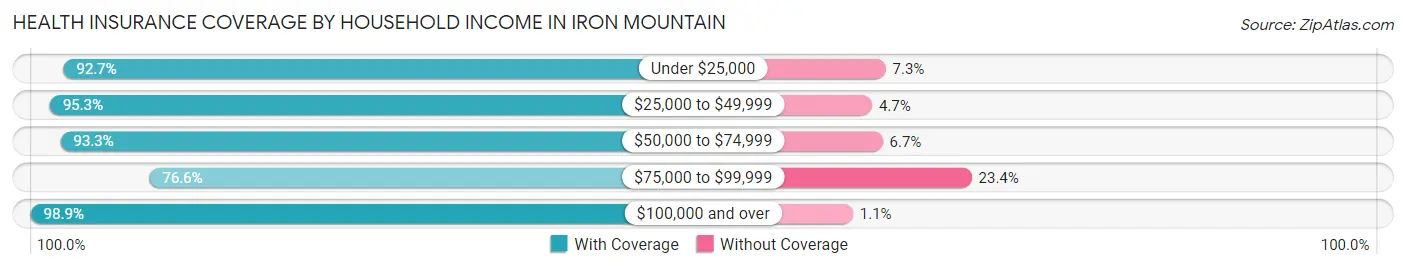
| Household Income | With Coverage | Without Coverage |
| Under $25,000 | 803 (92.7%) | 63 (7.3%) |
| $25,000 to $49,999 | 1,757 (95.3%) | 87 (4.7%) |
| $50,000 to $74,999 | 1,571 (93.3%) | 113 (6.7%) |
| $75,000 to $99,999 | 852 (76.6%) | 260 (23.4%) |
| $100,000 and over | 1,824 (98.9%) | 21 (1.1%) |
Public vs Private Health Insurance Coverage by Age in Iron Mountain
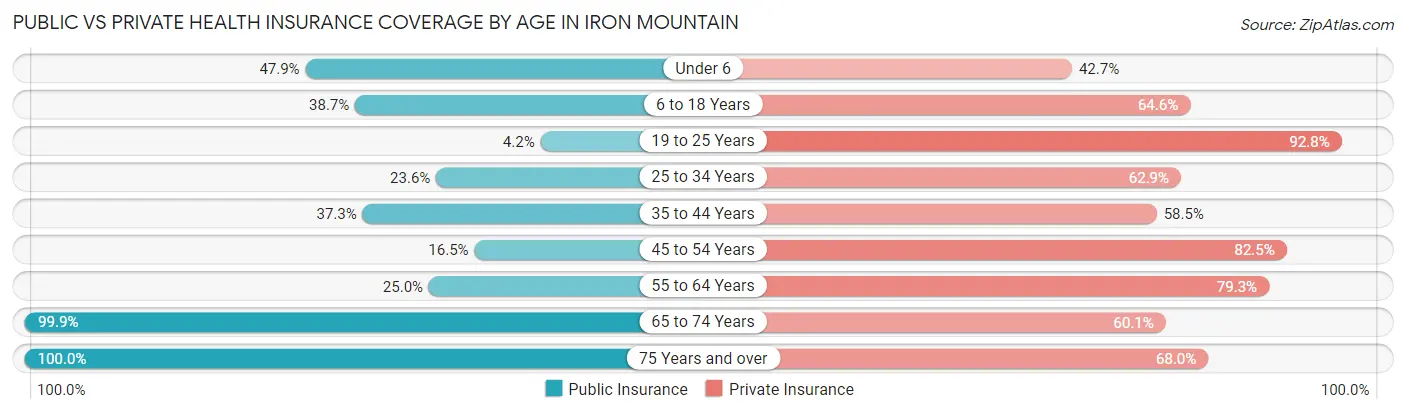
| Age Bracket | Public Insurance | Private Insurance |
| Under 6 | 270 (47.9%) | 241 (42.7%) |
| 6 to 18 Years | 390 (38.7%) | 652 (64.6%) |
| 19 to 25 Years | 24 (4.2%) | 525 (92.8%) |
| 25 to 34 Years | 200 (23.6%) | 533 (62.9%) |
| 35 to 44 Years | 331 (37.3%) | 519 (58.5%) |
| 45 to 54 Years | 156 (16.5%) | 780 (82.5%) |
| 55 to 64 Years | 266 (24.9%) | 845 (79.3%) |
| 65 to 74 Years | 884 (99.9%) | 532 (60.1%) |
| 75 Years and over | 603 (100.0%) | 410 (68.0%) |
| Total | 3,124 (42.4%) | 5,037 (68.3%) |
Disability Status by Sex by Age in Iron Mountain
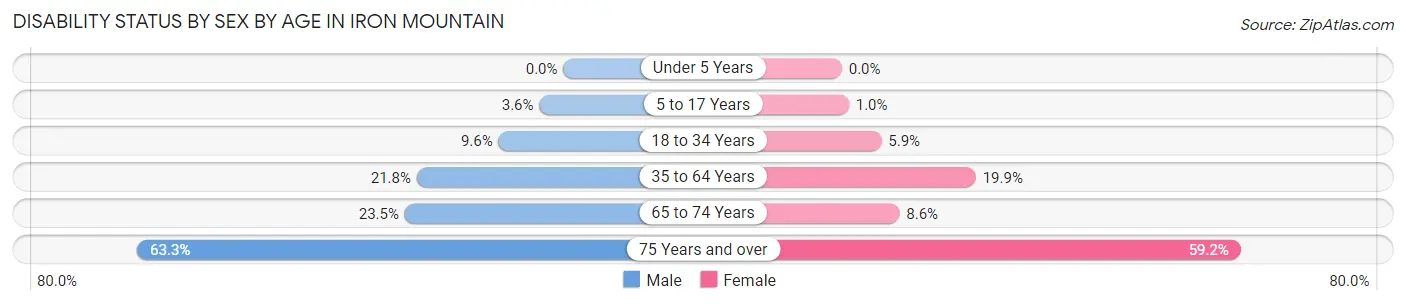
| Age Bracket | Male | Female |
| Under 5 Years | 0 (0.0%) | 0 (0.0%) |
| 5 to 17 Years | 19 (3.6%) | 6 (1.0%) |
| 18 to 34 Years | 81 (9.6%) | 35 (5.9%) |
| 35 to 64 Years | 342 (21.8%) | 264 (19.9%) |
| 65 to 74 Years | 101 (23.5%) | 39 (8.6%) |
| 75 Years and over | 169 (63.3%) | 199 (59.2%) |
Disability Class by Sex by Age in Iron Mountain
Disability Class: Hearing Difficulty
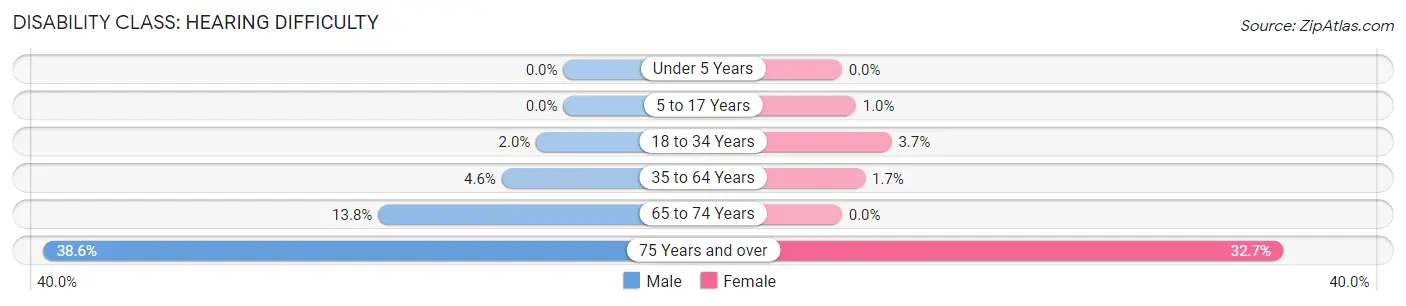
| Age Bracket | Male | Female |
| Under 5 Years | 0 (0.0%) | 0 (0.0%) |
| 5 to 17 Years | 0 (0.0%) | 6 (1.0%) |
| 18 to 34 Years | 17 (2.0%) | 22 (3.7%) |
| 35 to 64 Years | 72 (4.6%) | 23 (1.7%) |
| 65 to 74 Years | 59 (13.8%) | 0 (0.0%) |
| 75 Years and over | 103 (38.6%) | 110 (32.7%) |
Disability Class: Vision Difficulty
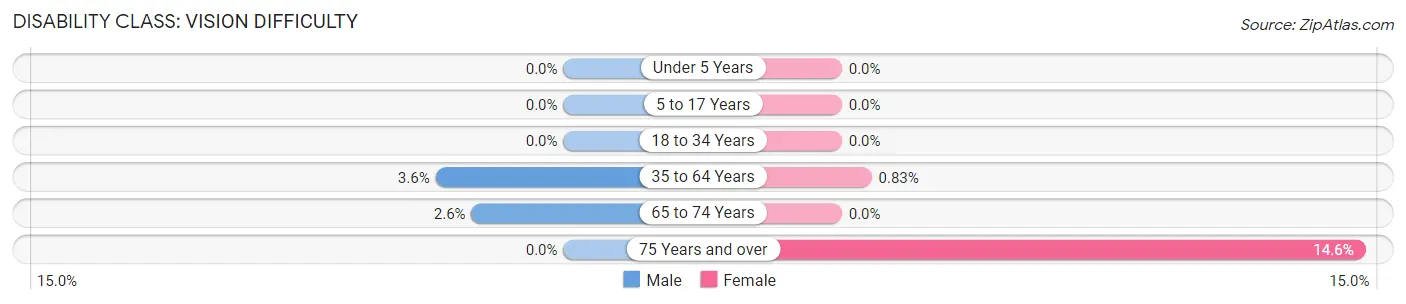
| Age Bracket | Male | Female |
| Under 5 Years | 0 (0.0%) | 0 (0.0%) |
| 5 to 17 Years | 0 (0.0%) | 0 (0.0%) |
| 18 to 34 Years | 0 (0.0%) | 0 (0.0%) |
| 35 to 64 Years | 56 (3.6%) | 11 (0.8%) |
| 65 to 74 Years | 11 (2.6%) | 0 (0.0%) |
| 75 Years and over | 0 (0.0%) | 49 (14.6%) |
Disability Class: Cognitive Difficulty
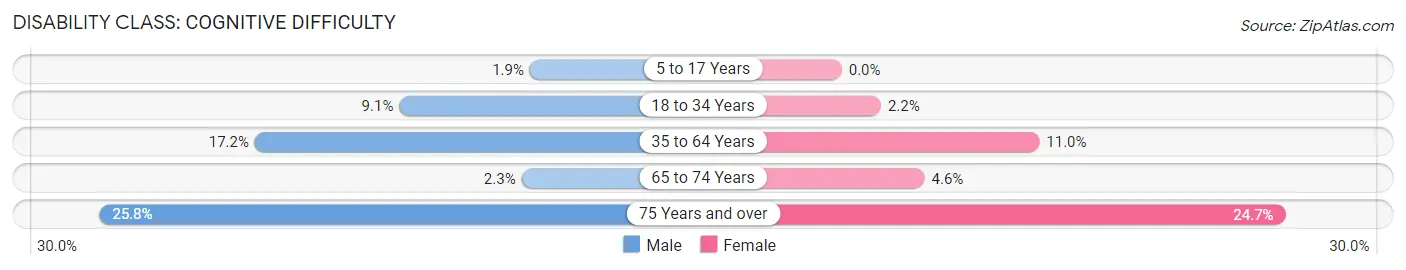
| Age Bracket | Male | Female |
| 5 to 17 Years | 10 (1.9%) | 0 (0.0%) |
| 18 to 34 Years | 77 (9.1%) | 13 (2.2%) |
| 35 to 64 Years | 270 (17.2%) | 146 (11.0%) |
| 65 to 74 Years | 10 (2.3%) | 21 (4.6%) |
| 75 Years and over | 69 (25.8%) | 83 (24.7%) |
Disability Class: Ambulatory Difficulty
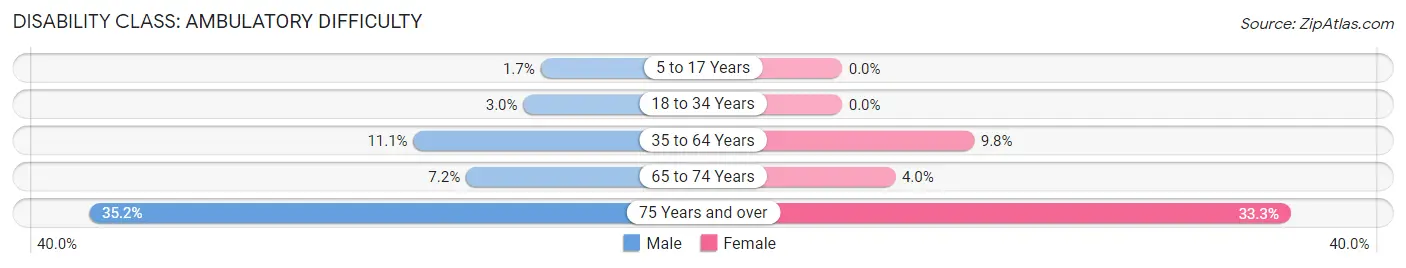
| Age Bracket | Male | Female |
| 5 to 17 Years | 9 (1.7%) | 0 (0.0%) |
| 18 to 34 Years | 25 (3.0%) | 0 (0.0%) |
| 35 to 64 Years | 175 (11.1%) | 130 (9.8%) |
| 65 to 74 Years | 31 (7.2%) | 18 (4.0%) |
| 75 Years and over | 94 (35.2%) | 112 (33.3%) |
Disability Class: Self-Care Difficulty
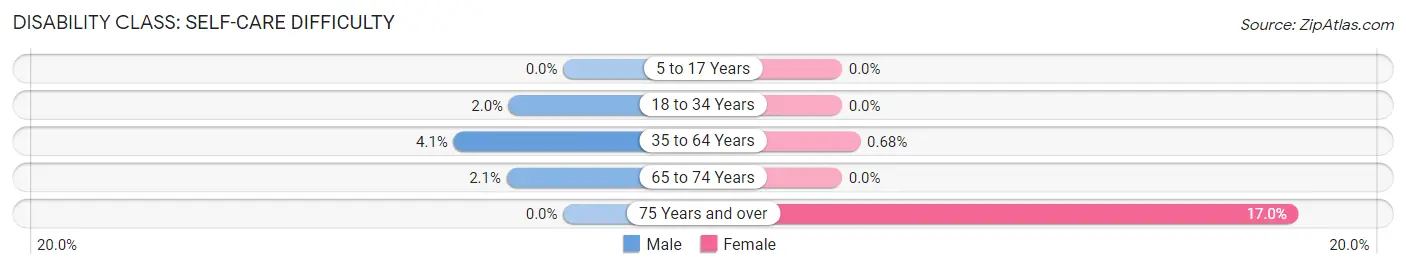
| Age Bracket | Male | Female |
| 5 to 17 Years | 0 (0.0%) | 0 (0.0%) |
| 18 to 34 Years | 17 (2.0%) | 0 (0.0%) |
| 35 to 64 Years | 64 (4.1%) | 9 (0.7%) |
| 65 to 74 Years | 9 (2.1%) | 0 (0.0%) |
| 75 Years and over | 0 (0.0%) | 57 (17.0%) |
Technology Access in Iron Mountain
Computing Device Access in Iron Mountain
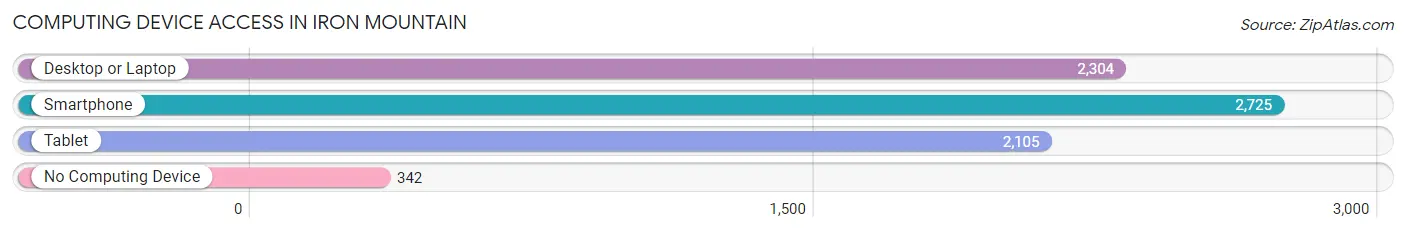
| Device Type | # Households | % Households |
| Desktop or Laptop | 2,304 | 67.9% |
| Smartphone | 2,725 | 80.3% |
| Tablet | 2,105 | 62.0% |
| No Computing Device | 342 | 10.1% |
| Total | 3,393 | 100.0% |
Internet Access in Iron Mountain
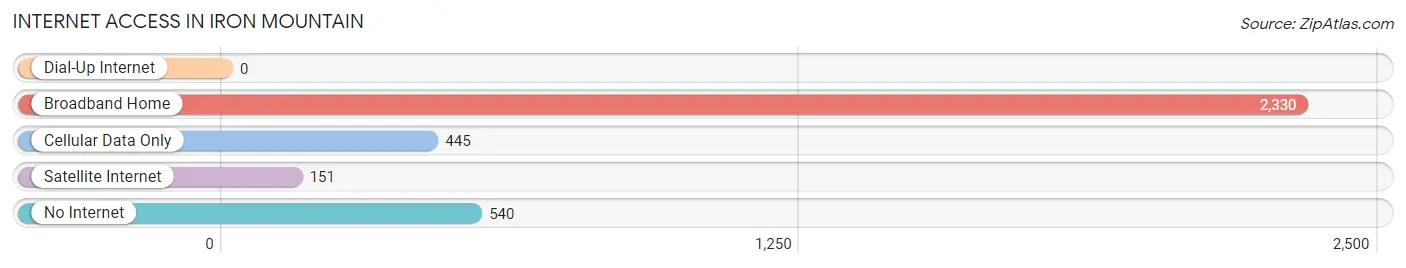
| Internet Type | # Households | % Households |
| Dial-Up Internet | 0 | 0.0% |
| Broadband Home | 2,330 | 68.7% |
| Cellular Data Only | 445 | 13.1% |
| Satellite Internet | 151 | 4.4% |
| No Internet | 540 | 15.9% |
| Total | 3,393 | 100.0% |
Iron Mountain Summary
Iron Mountain, Michigan is a small city located in the Upper Peninsula of Michigan. It is the county seat of Dickinson County and is situated on the Menominee River, which forms the border between Michigan and Wisconsin. The city is located in the central part of the Upper Peninsula, about 25 miles south of the Wisconsin border and about 50 miles west of Lake Michigan. The city has a population of about 7,500 people and is the largest city in the Upper Peninsula.
History
Iron Mountain was first settled in 1879 by a group of miners who were looking for iron ore. The city was named after the nearby Iron Mountain, which was the source of the ore. The city was incorporated in 1887 and quickly grew to become the largest city in the Upper Peninsula. The city was a major center for the iron ore mining industry and was home to several large iron ore processing plants.
In the early 1900s, the city was a major center for the lumber industry. The city was home to several large sawmills and lumber companies. The city also had a large paper mill, which was the largest employer in the city.
The city was also home to several large manufacturing companies, including a steel mill, a foundry, and a machine shop. The city was also home to several large retail stores, including a department store and a grocery store.
Geography
Iron Mountain is located in the central part of the Upper Peninsula of Michigan. The city is situated on the Menominee River, which forms the border between Michigan and Wisconsin. The city is located about 25 miles south of the Wisconsin border and about 50 miles west of Lake Michigan.
The city is located in a hilly area and is surrounded by forests. The city is located in a valley and is surrounded by several hills and mountains. The city is located in a temperate climate and has four distinct seasons.
Economy
Iron Mountain’s economy is largely based on the mining and lumber industries. The city is home to several large iron ore processing plants and several large sawmills and lumber companies. The city also has a large paper mill, which is the largest employer in the city.
The city is also home to several large manufacturing companies, including a steel mill, a foundry, and a machine shop. The city is also home to several large retail stores, including a department store and a grocery store.
Demographics
As of the 2010 census, the population of Iron Mountain was 7,521. The city has a population that is predominantly white, with about 95% of the population being white. The city also has a small Hispanic population, with about 2% of the population being Hispanic. The city also has a small African American population, with about 1% of the population being African American.
The median household income in Iron Mountain is $37,000, which is slightly lower than the national median of $50,000. The median home value in Iron Mountain is $90,000, which is slightly lower than the national median of $200,000. The city has a poverty rate of about 17%, which is slightly higher than the national average of 14%.
Common Questions
What is Per Capita Income in Iron Mountain?
Per Capita income in Iron Mountain is $32,578.
What is the Median Family Income in Iron Mountain?
Median Family Income in Iron Mountain is $65,587.
What is the Median Household income in Iron Mountain?
Median Household Income in Iron Mountain is $53,215.
What is Income or Wage Gap in Iron Mountain?
Income or Wage Gap in Iron Mountain is 35.9%.
Women in Iron Mountain earn 64.1 cents for every dollar earned by a man.
What is Family Income Deficit in Iron Mountain?
Family Income Deficit in Iron Mountain is $5,631.
Families that are below poverty line in Iron Mountain earn $5,631 less on average than the poverty threshold level.
What is Inequality or Gini Index in Iron Mountain?
Inequality or Gini Index in Iron Mountain is 0.45.
What is the Total Population of Iron Mountain?
Total Population of Iron Mountain is 7,522.
What is the Total Male Population of Iron Mountain?
Total Male Population of Iron Mountain is 4,029.
What is the Total Female Population of Iron Mountain?
Total Female Population of Iron Mountain is 3,493.
What is the Ratio of Males per 100 Females in Iron Mountain?
There are 115.34 Males per 100 Females in Iron Mountain.
What is the Ratio of Females per 100 Males in Iron Mountain?
There are 86.70 Females per 100 Males in Iron Mountain.
What is the Median Population Age in Iron Mountain?
Median Population Age in Iron Mountain is 42.7 Years.
What is the Average Family Size in Iron Mountain
Average Family Size in Iron Mountain is 2.7 People.
What is the Average Household Size in Iron Mountain
Average Household Size in Iron Mountain is 2.2 People.
How Large is the Labor Force in Iron Mountain?
There are 3,540 People in the Labor Forcein in Iron Mountain.
What is the Percentage of People in the Labor Force in Iron Mountain?
57.7% of People are in the Labor Force in Iron Mountain.
What is the Unemployment Rate in Iron Mountain?
Unemployment Rate in Iron Mountain is 4.7%.