Holt, MI Map & Demographics
Holt Map
Holt Overview
$40,862
PER CAPITA INCOME
$99,660
AVG FAMILY INCOME
$83,722
AVG HOUSEHOLD INCOME
25.5%
WAGE / INCOME GAP [ % ]
74.5¢/ $1
WAGE / INCOME GAP [ $ ]
$8,525
FAMILY INCOME DEFICIT
0.41
INEQUALITY / GINI INDEX
25,374
TOTAL POPULATION
12,259
MALE POPULATION
13,115
FEMALE POPULATION
93.47
MALES / 100 FEMALES
106.98
FEMALES / 100 MALES
38.1
MEDIAN AGE
3.0
AVG FAMILY SIZE
2.4
AVG HOUSEHOLD SIZE
14,043
LABOR FORCE [ PEOPLE ]
69.2%
PERCENT IN LABOR FORCE
5.5%
UNEMPLOYMENT RATE
Holt Zip Codes
Holt Area Codes
Income in Holt
Income Overview in Holt
Per Capita Income in Holt is $40,862, while median incomes of families and households are $99,660 and $83,722 respectively.
| Characteristic | Number | Measure |
| Per Capita Income | 25,374 | $40,862 |
| Median Family Income | 6,563 | $99,660 |
| Mean Family Income | 6,563 | $114,863 |
| Median Household Income | 10,409 | $83,722 |
| Mean Household Income | 10,409 | $97,240 |
| Income Deficit | 6,563 | $8,525 |
| Wage / Income Gap (%) | 25,374 | 25.48% |
| Wage / Income Gap ($) | 25,374 | 74.52¢ per $1 |
| Gini / Inequality Index | 25,374 | 0.41 |
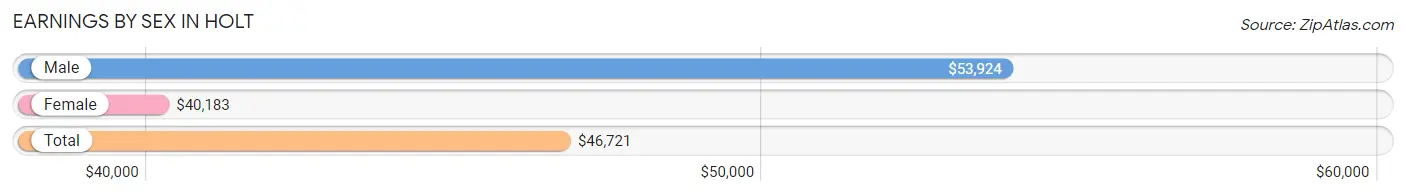
Earnings by Sex in Holt
Average Earnings in Holt are $46,721, $53,924 for men and $40,183 for women, a difference of 25.5%.
| Sex | Number | Average Earnings |
| Male | 7,509 (51.9%) | $53,924 |
| Female | 6,946 (48.0%) | $40,183 |
| Total | 14,455 (100.0%) | $46,721 |
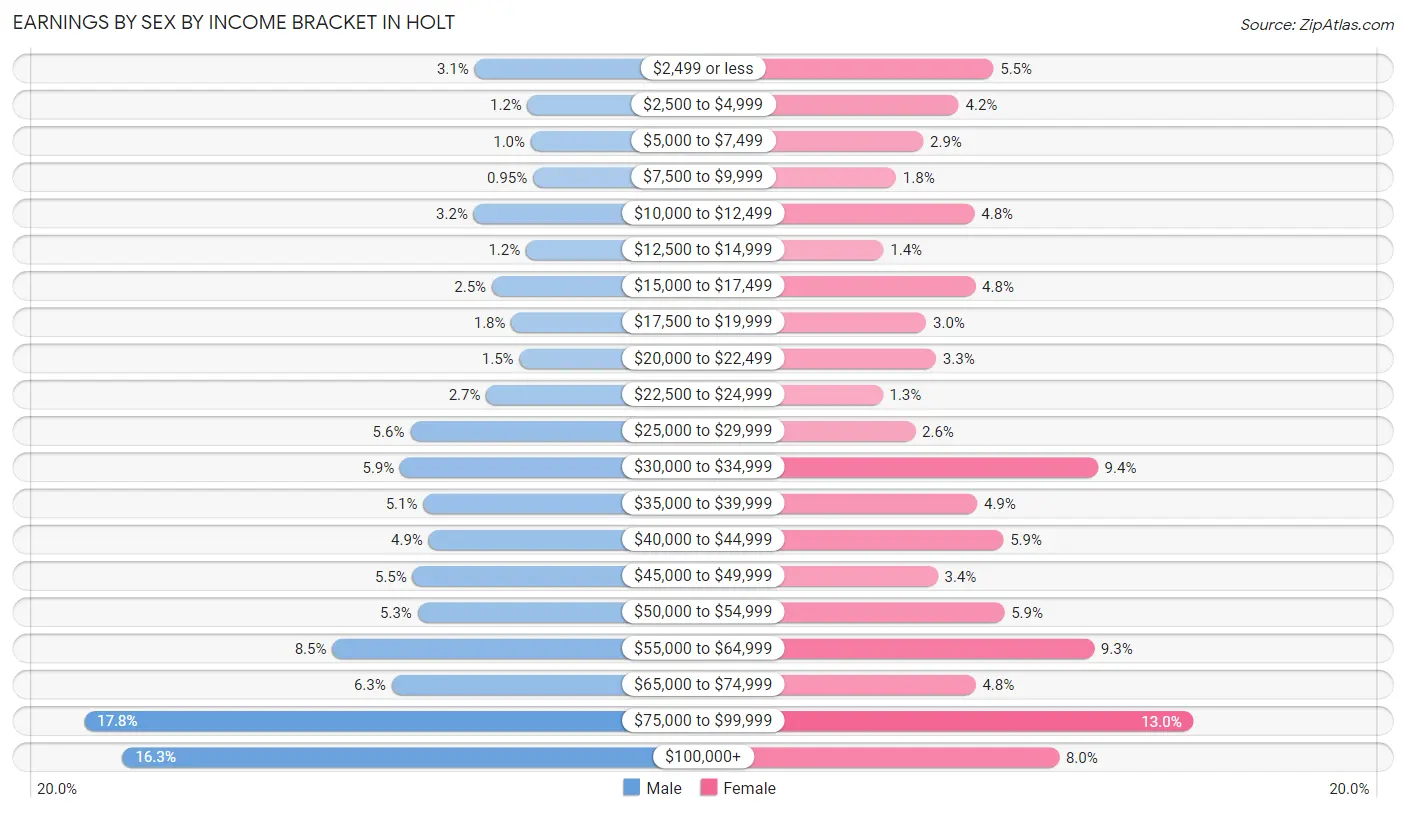
Earnings by Sex by Income Bracket in Holt
The most common earnings brackets in Holt are $75,000 to $99,999 for men (1,334 | 17.8%) and $75,000 to $99,999 for women (902 | 13.0%).
| Income | Male | Female |
| $2,499 or less | 236 (3.1%) | 381 (5.5%) |
| $2,500 to $4,999 | 86 (1.1%) | 291 (4.2%) |
| $5,000 to $7,499 | 77 (1.0%) | 199 (2.9%) |
| $7,500 to $9,999 | 71 (0.9%) | 128 (1.8%) |
| $10,000 to $12,499 | 238 (3.2%) | 332 (4.8%) |
| $12,500 to $14,999 | 91 (1.2%) | 95 (1.4%) |
| $15,000 to $17,499 | 187 (2.5%) | 334 (4.8%) |
| $17,500 to $19,999 | 132 (1.8%) | 206 (3.0%) |
| $20,000 to $22,499 | 110 (1.5%) | 232 (3.3%) |
| $22,500 to $24,999 | 203 (2.7%) | 93 (1.3%) |
| $25,000 to $29,999 | 417 (5.6%) | 178 (2.6%) |
| $30,000 to $34,999 | 445 (5.9%) | 653 (9.4%) |
| $35,000 to $39,999 | 380 (5.1%) | 339 (4.9%) |
| $40,000 to $44,999 | 365 (4.9%) | 407 (5.9%) |
| $45,000 to $49,999 | 410 (5.5%) | 236 (3.4%) |
| $50,000 to $54,999 | 396 (5.3%) | 410 (5.9%) |
| $55,000 to $64,999 | 636 (8.5%) | 643 (9.3%) |
| $65,000 to $74,999 | 469 (6.2%) | 335 (4.8%) |
| $75,000 to $99,999 | 1,334 (17.8%) | 902 (13.0%) |
| $100,000+ | 1,226 (16.3%) | 552 (8.0%) |
| Total | 7,509 (100.0%) | 6,946 (100.0%) |
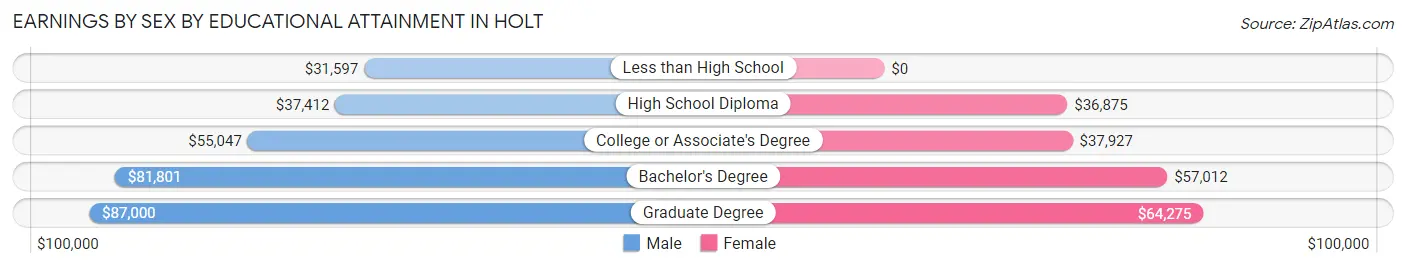
Earnings by Sex by Educational Attainment in Holt
Average earnings in Holt are $58,758 for men and $47,115 for women, a difference of 19.8%. Men with an educational attainment of graduate degree enjoy the highest average annual earnings of $87,000, while those with less than high school education earn the least with $31,597. Women with an educational attainment of graduate degree earn the most with the average annual earnings of $64,275, while those with high school diploma education have the smallest earnings of $36,875.
| Educational Attainment | Male Income | Female Income |
| Less than High School | $31,597 | $0 |
| High School Diploma | $37,412 | $36,875 |
| College or Associate's Degree | $55,047 | $37,927 |
| Bachelor's Degree | $81,801 | $57,012 |
| Graduate Degree | $87,000 | $64,275 |
| Total | $58,758 | $47,115 |
Family Income in Holt
Family Income Brackets in Holt
According to the Holt family income data, there are 1,733 families falling into the $100,000 to $149,999 income range, which is the most common income bracket and makes up 26.4% of all families. Conversely, the $10,000 to $14,999 income bracket is the least frequent group with only 53 families (0.8%) belonging to this category.
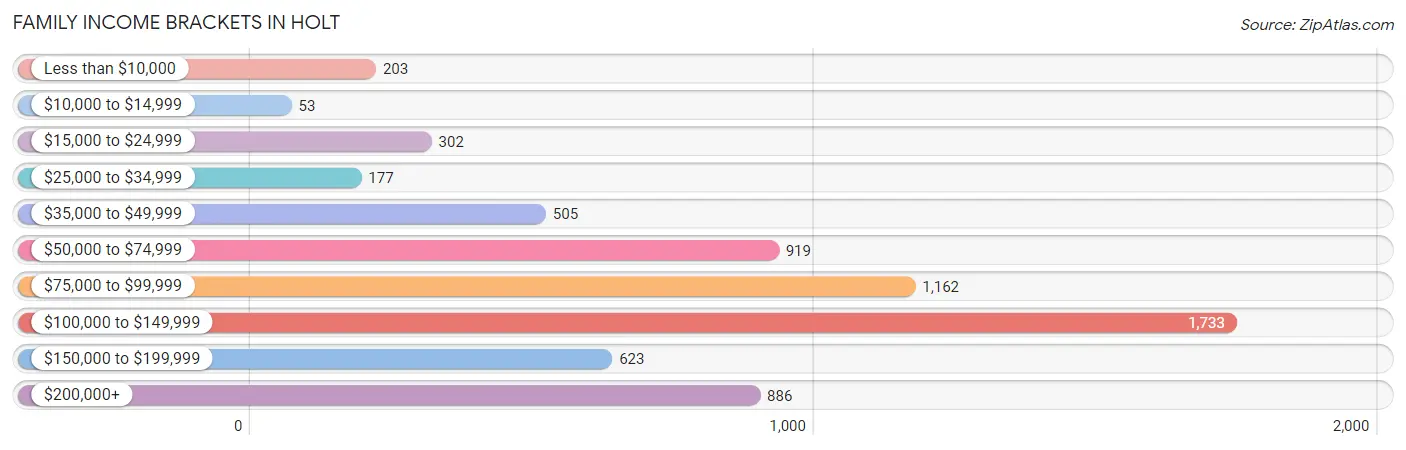
| Income Bracket | # Families | % Families |
| Less than $10,000 | 203 | 3.1% |
| $10,000 to $14,999 | 53 | 0.8% |
| $15,000 to $24,999 | 302 | 4.6% |
| $25,000 to $34,999 | 177 | 2.7% |
| $35,000 to $49,999 | 505 | 7.7% |
| $50,000 to $74,999 | 919 | 14.0% |
| $75,000 to $99,999 | 1,162 | 17.7% |
| $100,000 to $149,999 | 1,733 | 26.4% |
| $150,000 to $199,999 | 623 | 9.5% |
| $200,000+ | 886 | 13.5% |
Family Income by Famaliy Size in Holt
5-person families (451 | 6.9%) account for the highest median family income in Holt with $120,169 per family, while 2-person families (3,315 | 50.5%) have the highest median income of $48,102 per family member.
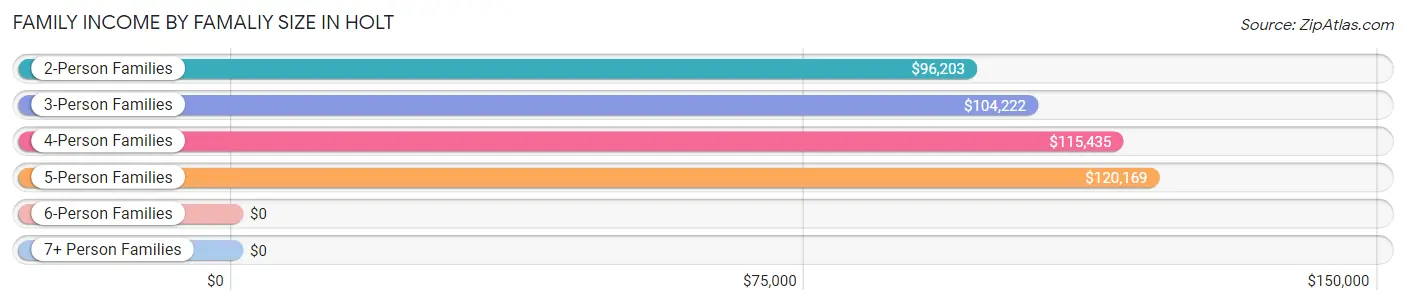
| Income Bracket | # Families | Median Income |
| 2-Person Families | 3,315 (50.5%) | $96,203 |
| 3-Person Families | 1,443 (22.0%) | $104,222 |
| 4-Person Families | 1,202 (18.3%) | $115,435 |
| 5-Person Families | 451 (6.9%) | $120,169 |
| 6-Person Families | 121 (1.8%) | $0 |
| 7+ Person Families | 31 (0.5%) | $0 |
| Total | 6,563 (100.0%) | $99,660 |
Family Income by Number of Earners in Holt
The median family income in Holt is $99,660, with families comprising 3+ earners (754) having the highest median family income of $163,333, while families with 1 earner (1,948) have the lowest median family income of $63,385, accounting for 11.5% and 29.7% of families, respectively.
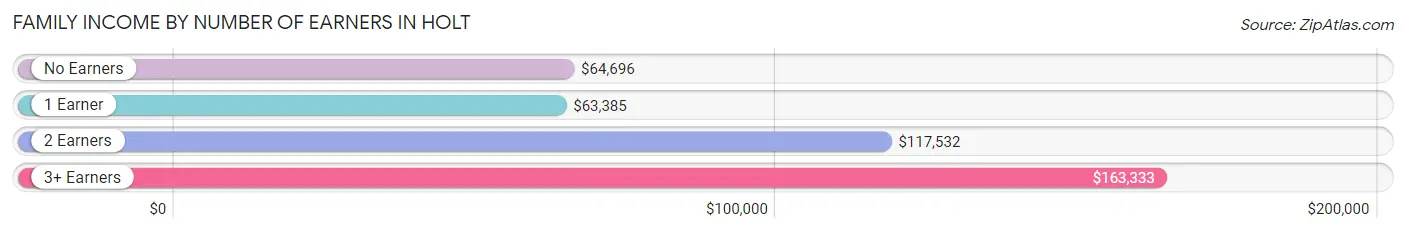
| Number of Earners | # Families | Median Income |
| No Earners | 850 (13.0%) | $64,696 |
| 1 Earner | 1,948 (29.7%) | $63,385 |
| 2 Earners | 3,011 (45.9%) | $117,532 |
| 3+ Earners | 754 (11.5%) | $163,333 |
| Total | 6,563 (100.0%) | $99,660 |
Household Income in Holt
Household Income Brackets in Holt
With 2,280 households falling in the category, the $100,000 to $149,999 income range is the most frequent in Holt, accounting for 21.9% of all households. In contrast, only 250 households (2.4%) fall into the $10,000 to $14,999 income bracket, making it the least populous group.
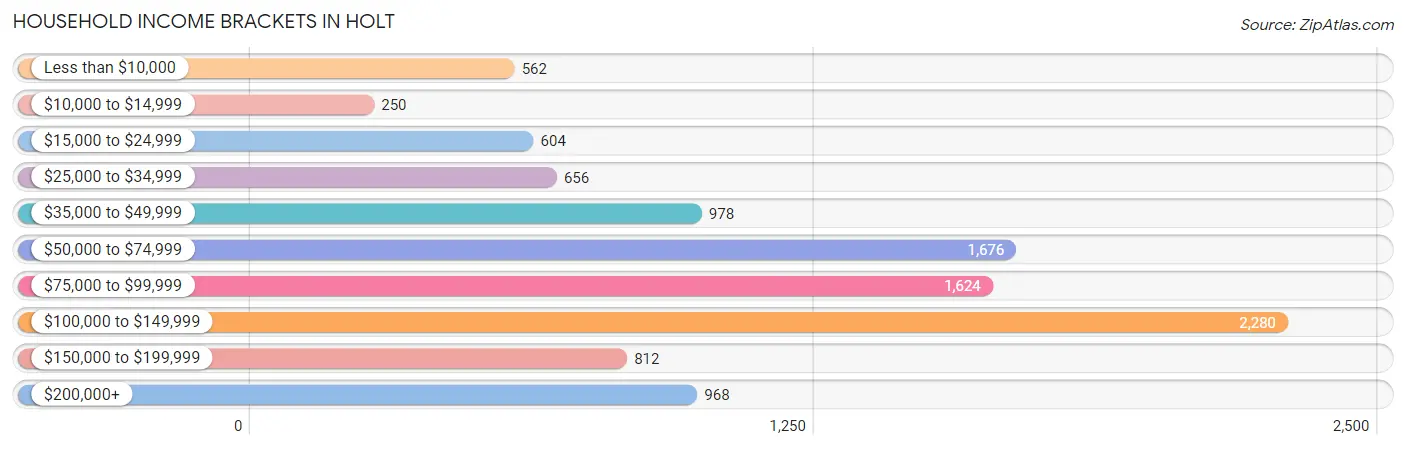
| Income Bracket | # Households | % Households |
| Less than $10,000 | 562 | 5.4% |
| $10,000 to $14,999 | 250 | 2.4% |
| $15,000 to $24,999 | 604 | 5.8% |
| $25,000 to $34,999 | 656 | 6.3% |
| $35,000 to $49,999 | 978 | 9.4% |
| $50,000 to $74,999 | 1,676 | 16.1% |
| $75,000 to $99,999 | 1,624 | 15.6% |
| $100,000 to $149,999 | 2,280 | 21.9% |
| $150,000 to $199,999 | 812 | 7.8% |
| $200,000+ | 968 | 9.3% |
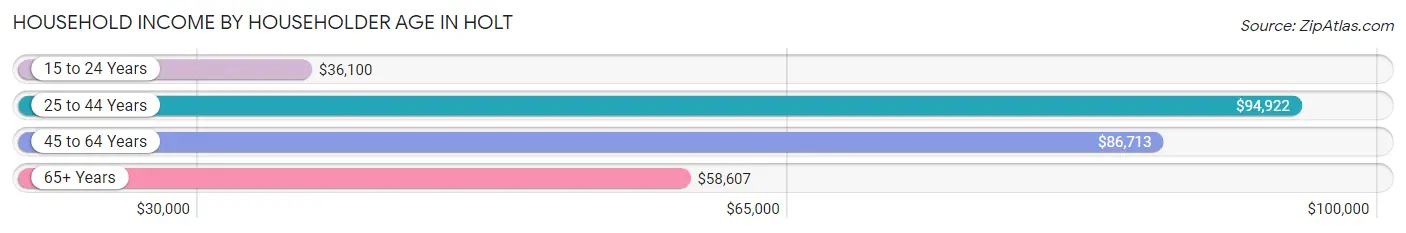
Household Income by Householder Age in Holt
The median household income in Holt is $83,722, with the highest median household income of $94,922 found in the 25 to 44 years age bracket for the primary householder. A total of 3,525 households (33.9%) fall into this category. Meanwhile, the 15 to 24 years age bracket for the primary householder has the lowest median household income of $36,100, with 348 households (3.3%) in this group.
| Income Bracket | # Households | Median Income |
| 15 to 24 Years | 348 (3.3%) | $36,100 |
| 25 to 44 Years | 3,525 (33.9%) | $94,922 |
| 45 to 64 Years | 3,866 (37.1%) | $86,713 |
| 65+ Years | 2,670 (25.7%) | $58,607 |
| Total | 10,409 (100.0%) | $83,722 |
Poverty in Holt
Income Below Poverty by Sex and Age in Holt
With 9.1% poverty level for males and 12.6% for females among the residents of Holt, 15 year old males and 15 year old females are the most vulnerable to poverty, with 66 males (36.7%) and 149 females (77.6%) in their respective age groups living below the poverty level.
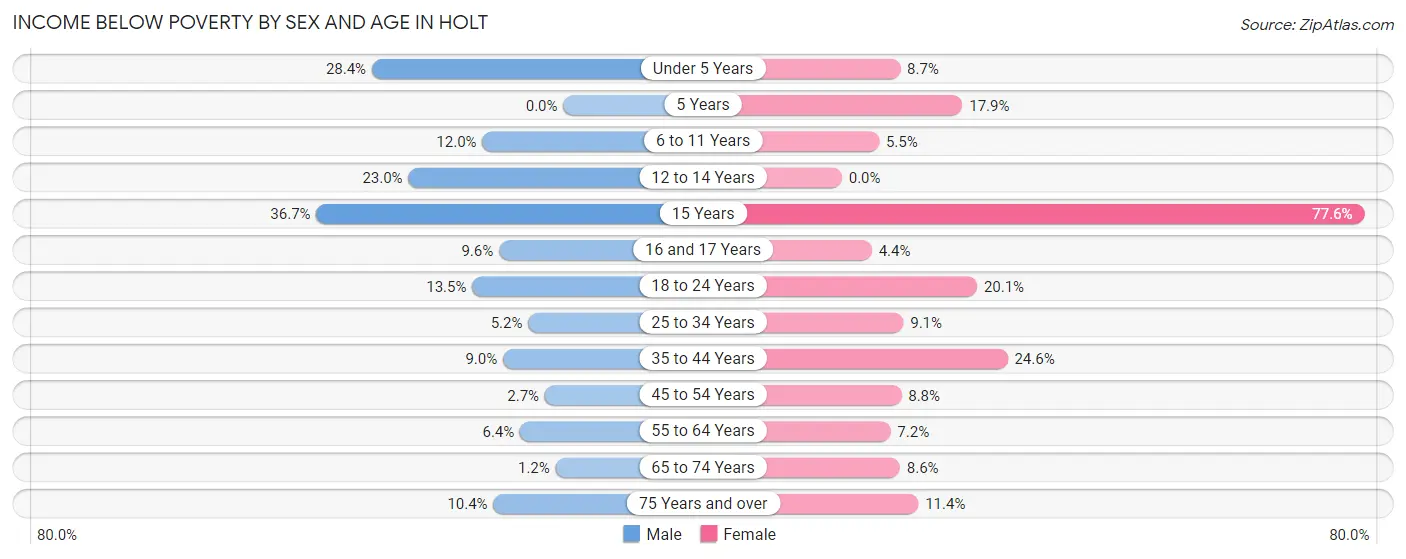
| Age Bracket | Male | Female |
| Under 5 Years | 133 (28.4%) | 71 (8.7%) |
| 5 Years | 0 (0.0%) | 22 (17.9%) |
| 6 to 11 Years | 96 (12.0%) | 57 (5.5%) |
| 12 to 14 Years | 190 (23.0%) | 0 (0.0%) |
| 15 Years | 66 (36.7%) | 149 (77.6%) |
| 16 and 17 Years | 32 (9.6%) | 13 (4.4%) |
| 18 to 24 Years | 118 (13.5%) | 237 (20.1%) |
| 25 to 34 Years | 102 (5.2%) | 132 (9.1%) |
| 35 to 44 Years | 157 (8.9%) | 456 (24.6%) |
| 45 to 54 Years | 42 (2.7%) | 150 (8.8%) |
| 55 to 64 Years | 95 (6.4%) | 116 (7.2%) |
| 65 to 74 Years | 15 (1.1%) | 120 (8.6%) |
| 75 Years and over | 54 (10.4%) | 110 (11.4%) |
| Total | 1,100 (9.1%) | 1,633 (12.6%) |
Income Above Poverty by Sex and Age in Holt
According to the poverty statistics in Holt, males aged 5 years and females aged 12 to 14 years are the age groups that are most secure financially, with 100.0% of males and 100.0% of females in these age groups living above the poverty line.
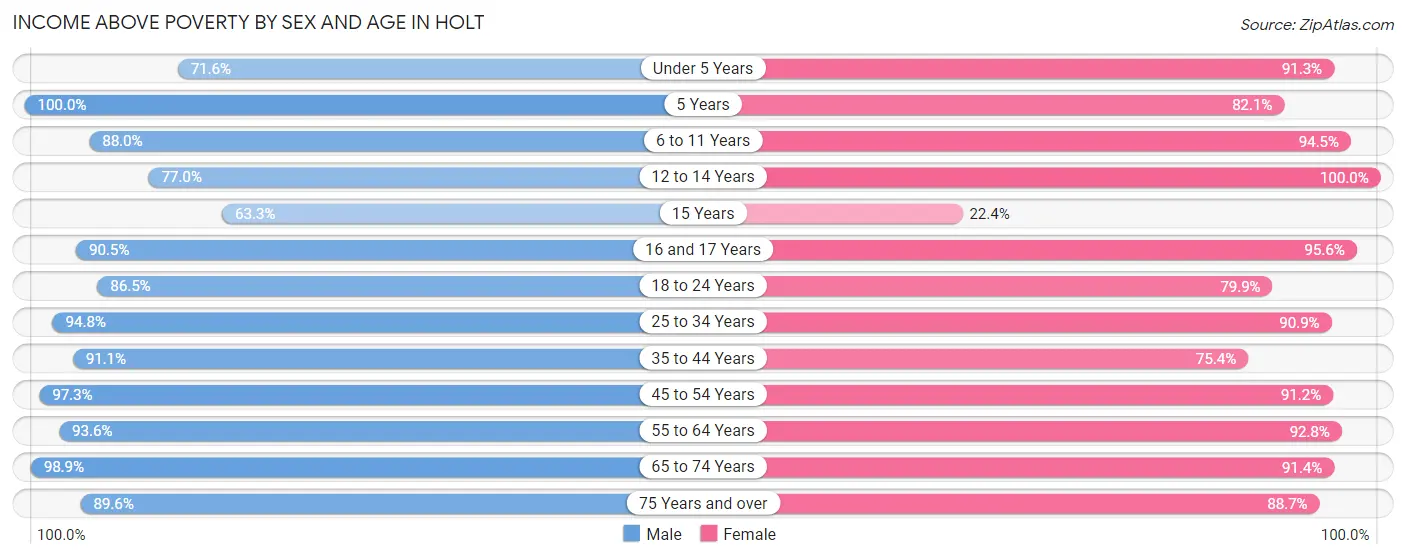
| Age Bracket | Male | Female |
| Under 5 Years | 335 (71.6%) | 749 (91.3%) |
| 5 Years | 113 (100.0%) | 101 (82.1%) |
| 6 to 11 Years | 703 (88.0%) | 975 (94.5%) |
| 12 to 14 Years | 636 (77.0%) | 347 (100.0%) |
| 15 Years | 114 (63.3%) | 43 (22.4%) |
| 16 and 17 Years | 303 (90.4%) | 280 (95.6%) |
| 18 to 24 Years | 755 (86.5%) | 944 (79.9%) |
| 25 to 34 Years | 1,855 (94.8%) | 1,313 (90.9%) |
| 35 to 44 Years | 1,597 (91.0%) | 1,398 (75.4%) |
| 45 to 54 Years | 1,495 (97.3%) | 1,549 (91.2%) |
| 55 to 64 Years | 1,384 (93.6%) | 1,490 (92.8%) |
| 65 to 74 Years | 1,291 (98.9%) | 1,272 (91.4%) |
| 75 Years and over | 466 (89.6%) | 859 (88.6%) |
| Total | 11,047 (90.9%) | 11,320 (87.4%) |
Income Below Poverty Among Married-Couple Families in Holt
The poverty statistics for married-couple families in Holt show that 2.2% or 108 of the total 4,964 families live below the poverty line. Families with no children have the highest poverty rate of 2.9%, comprising of 91 families. On the other hand, families with 3 or 4 children have the lowest poverty rate of 0.0%, which includes 0 families.
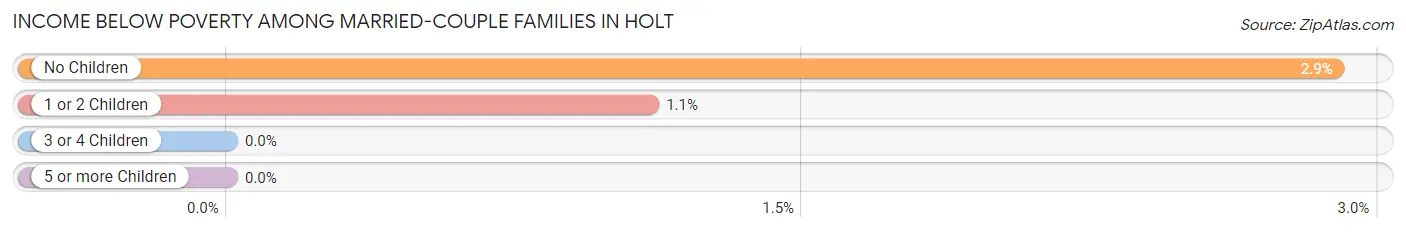
| Children | Above Poverty | Below Poverty |
| No Children | 3,058 (97.1%) | 91 (2.9%) |
| 1 or 2 Children | 1,522 (98.9%) | 17 (1.1%) |
| 3 or 4 Children | 276 (100.0%) | 0 (0.0%) |
| 5 or more Children | 0 (0.0%) | 0 (0.0%) |
| Total | 4,856 (97.8%) | 108 (2.2%) |
Income Below Poverty Among Single-Parent Households in Holt
According to the poverty data in Holt, 13.8% or 49 single-father households and 30.2% or 376 single-mother households are living below the poverty line. Among single-father households, those with 1 or 2 children have the highest poverty rate, with 49 households (24.3%) experiencing poverty. Likewise, among single-mother households, those with 3 or 4 children have the highest poverty rate, with 99 households (64.7%) falling below the poverty line.
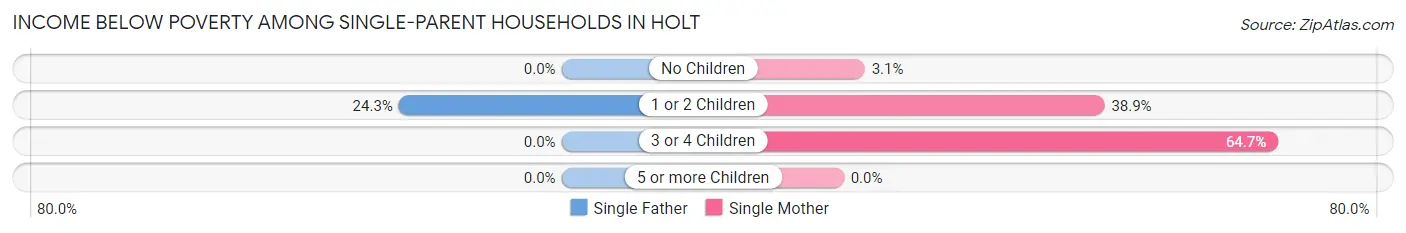
| Children | Single Father | Single Mother |
| No Children | 0 (0.0%) | 12 (3.1%) |
| 1 or 2 Children | 49 (24.3%) | 265 (38.9%) |
| 3 or 4 Children | 0 (0.0%) | 99 (64.7%) |
| 5 or more Children | 0 (0.0%) | 0 (0.0%) |
| Total | 49 (13.8%) | 376 (30.2%) |
Income Below Poverty Among Married-Couple vs Single-Parent Households in Holt
The poverty data for Holt shows that 108 of the married-couple family households (2.2%) and 425 of the single-parent households (26.6%) are living below the poverty level. Within the married-couple family households, those with no children have the highest poverty rate, with 91 households (2.9%) falling below the poverty line. Among the single-parent households, those with 3 or 4 children have the highest poverty rate, with 99 household (51.6%) living below poverty.
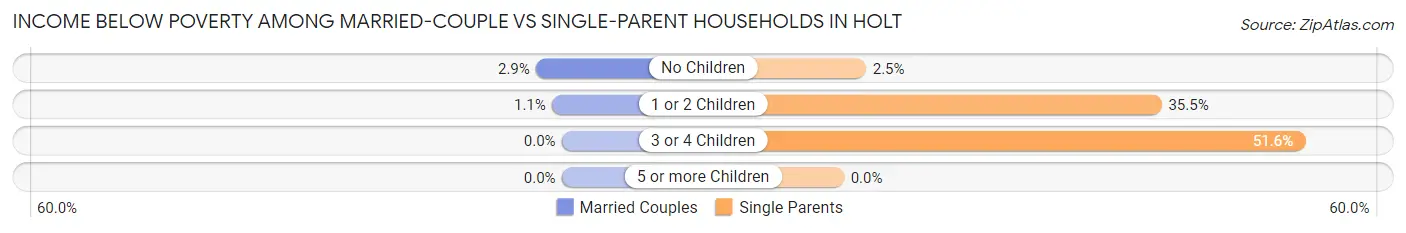
| Children | Married-Couple Families | Single-Parent Households |
| No Children | 91 (2.9%) | 12 (2.5%) |
| 1 or 2 Children | 17 (1.1%) | 314 (35.5%) |
| 3 or 4 Children | 0 (0.0%) | 99 (51.6%) |
| 5 or more Children | 0 (0.0%) | 0 (0.0%) |
| Total | 108 (2.2%) | 425 (26.6%) |
Race in Holt
The most populous races in Holt are White / Caucasian (19,222 | 75.7%), Black / African American (2,229 | 8.8%), and Hispanic or Latino (2,167 | 8.5%).
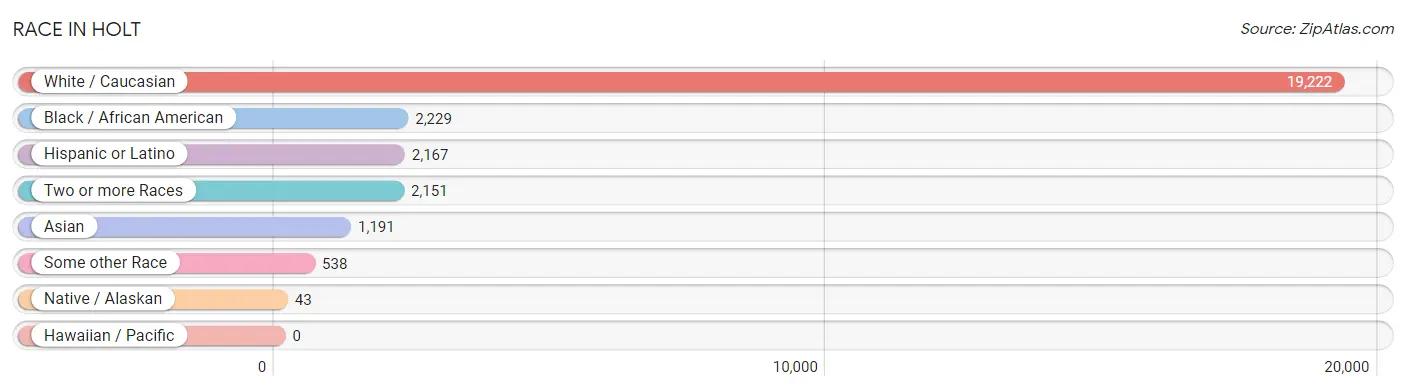
| Race | # Population | % Population |
| Asian | 1,191 | 4.7% |
| Black / African American | 2,229 | 8.8% |
| Hawaiian / Pacific | 0 | 0.0% |
| Hispanic or Latino | 2,167 | 8.5% |
| Native / Alaskan | 43 | 0.2% |
| White / Caucasian | 19,222 | 75.7% |
| Two or more Races | 2,151 | 8.5% |
| Some other Race | 538 | 2.1% |
| Total | 25,374 | 100.0% |
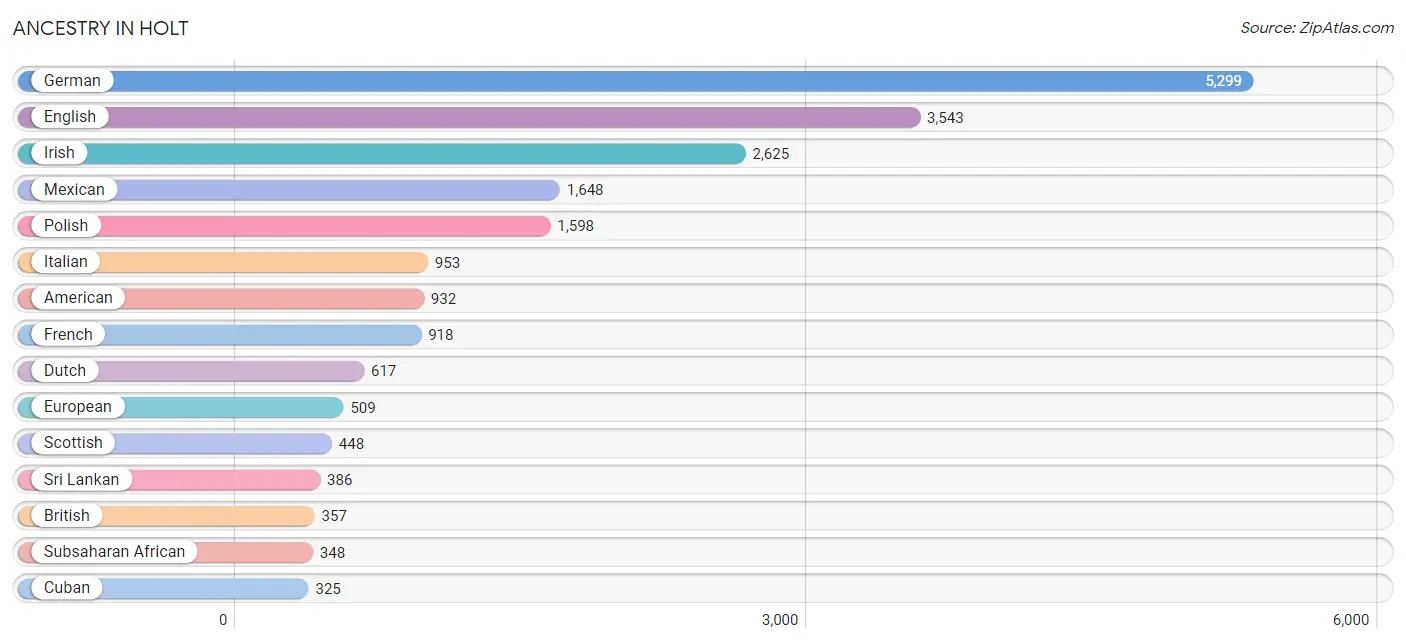
Ancestry in Holt
The most populous ancestries reported in Holt are German (5,299 | 20.9%), English (3,543 | 14.0%), Irish (2,625 | 10.3%), Mexican (1,648 | 6.5%), and Polish (1,598 | 6.3%), together accounting for 58.0% of all Holt residents.
| Ancestry | # Population | % Population |
| African | 211 | 0.8% |
| American | 932 | 3.7% |
| Apache | 42 | 0.2% |
| Arab | 311 | 1.2% |
| Austrian | 30 | 0.1% |
| Bangladeshi | 44 | 0.2% |
| Belgian | 136 | 0.5% |
| Bhutanese | 47 | 0.2% |
| Brazilian | 34 | 0.1% |
| British | 357 | 1.4% |
| Bulgarian | 12 | 0.1% |
| Burmese | 182 | 0.7% |
| Canadian | 155 | 0.6% |
| Celtic | 13 | 0.1% |
| Central American | 37 | 0.2% |
| Cherokee | 58 | 0.2% |
| Chilean | 17 | 0.1% |
| Chippewa | 30 | 0.1% |
| Croatian | 157 | 0.6% |
| Cuban | 325 | 1.3% |
| Czech | 17 | 0.1% |
| Czechoslovakian | 23 | 0.1% |
| Danish | 165 | 0.6% |
| Dutch | 617 | 2.4% |
| Eastern European | 98 | 0.4% |
| English | 3,543 | 14.0% |
| European | 509 | 2.0% |
| Finnish | 172 | 0.7% |
| French | 918 | 3.6% |
| French Canadian | 269 | 1.1% |
| German | 5,299 | 20.9% |
| Greek | 11 | 0.0% |
| Guatemalan | 22 | 0.1% |
| Honduran | 15 | 0.1% |
| Hungarian | 167 | 0.7% |
| Indian (Asian) | 125 | 0.5% |
| Iraqi | 37 | 0.2% |
| Irish | 2,625 | 10.3% |
| Italian | 953 | 3.8% |
| Jamaican | 250 | 1.0% |
| Korean | 213 | 0.8% |
| Laotian | 18 | 0.1% |
| Lebanese | 110 | 0.4% |
| Lithuanian | 60 | 0.2% |
| Malaysian | 13 | 0.1% |
| Mexican | 1,648 | 6.5% |
| Mexican American Indian | 25 | 0.1% |
| Nigerian | 45 | 0.2% |
| Northern European | 11 | 0.0% |
| Norwegian | 282 | 1.1% |
| Polish | 1,598 | 6.3% |
| Portuguese | 35 | 0.1% |
| Puerto Rican | 76 | 0.3% |
| Romanian | 151 | 0.6% |
| Russian | 10 | 0.0% |
| Scandinavian | 69 | 0.3% |
| Scotch-Irish | 212 | 0.8% |
| Scottish | 448 | 1.8% |
| Slavic | 18 | 0.1% |
| Slovak | 42 | 0.2% |
| Somali | 79 | 0.3% |
| South American | 17 | 0.1% |
| Spaniard | 9 | 0.0% |
| Spanish | 34 | 0.1% |
| Sri Lankan | 386 | 1.5% |
| Subsaharan African | 348 | 1.4% |
| Swedish | 321 | 1.3% |
| Swiss | 91 | 0.4% |
| Syrian | 118 | 0.5% |
| Thai | 325 | 1.3% |
| Trinidadian and Tobagonian | 70 | 0.3% |
| Ukrainian | 46 | 0.2% |
| Welsh | 132 | 0.5% |
| West Indian | 27 | 0.1% |
| Yugoslavian | 35 | 0.1% | View All 75 Rows |
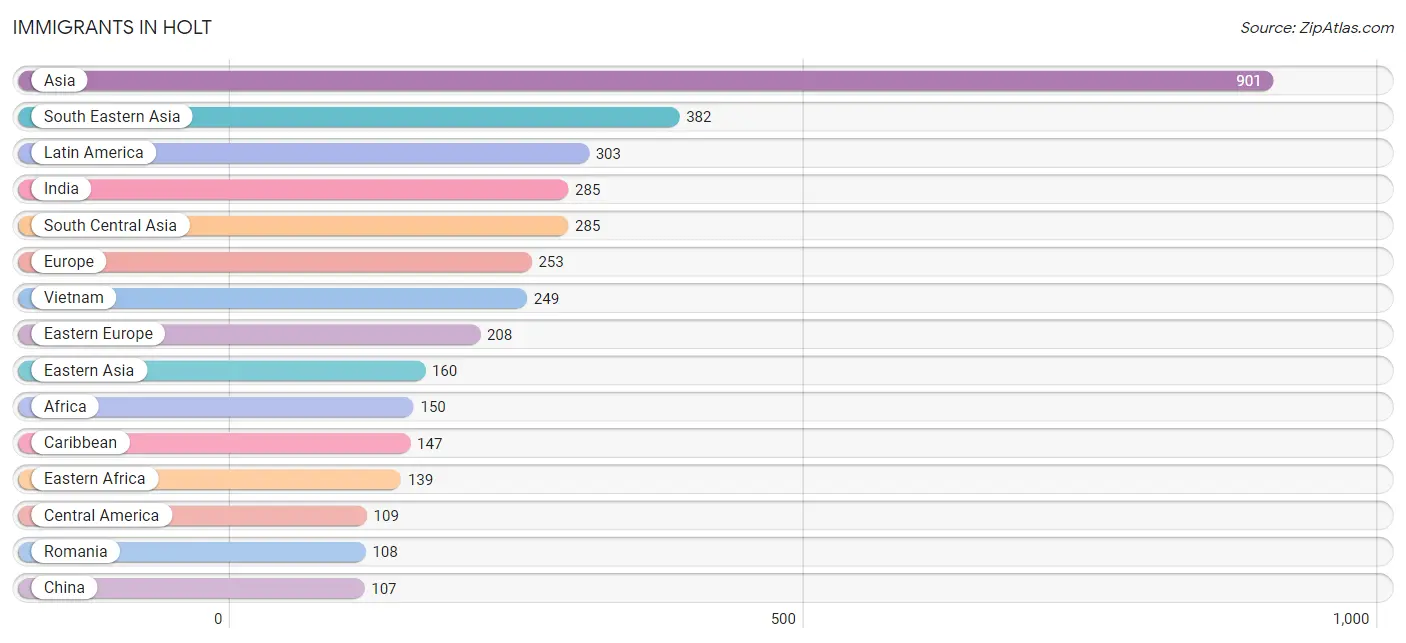
Immigrants in Holt
The most numerous immigrant groups reported in Holt came from Asia (901 | 3.5%), South Eastern Asia (382 | 1.5%), Latin America (303 | 1.2%), India (285 | 1.1%), and South Central Asia (285 | 1.1%), together accounting for 8.5% of all Holt residents.
| Immigration Origin | # Population | % Population |
| Africa | 150 | 0.6% |
| Asia | 901 | 3.5% |
| Bosnia and Herzegovina | 24 | 0.1% |
| Brazil | 47 | 0.2% |
| Canada | 10 | 0.0% |
| Caribbean | 147 | 0.6% |
| Central America | 109 | 0.4% |
| China | 107 | 0.4% |
| Cuba | 20 | 0.1% |
| Eastern Africa | 139 | 0.5% |
| Eastern Asia | 160 | 0.6% |
| Eastern Europe | 208 | 0.8% |
| England | 15 | 0.1% |
| Europe | 253 | 1.0% |
| Guatemala | 57 | 0.2% |
| India | 285 | 1.1% |
| Iraq | 37 | 0.2% |
| Italy | 30 | 0.1% |
| Jamaica | 57 | 0.2% |
| Korea | 53 | 0.2% |
| Laos | 31 | 0.1% |
| Latin America | 303 | 1.2% |
| Lebanon | 37 | 0.2% |
| Mexico | 52 | 0.2% |
| Moldova | 18 | 0.1% |
| Nigeria | 11 | 0.0% |
| Northern Europe | 15 | 0.1% |
| Philippines | 102 | 0.4% |
| Poland | 22 | 0.1% |
| Romania | 108 | 0.4% |
| South America | 47 | 0.2% |
| South Central Asia | 285 | 1.1% |
| South Eastern Asia | 382 | 1.5% |
| Southern Europe | 30 | 0.1% |
| Taiwan | 37 | 0.2% |
| Trinidad and Tobago | 70 | 0.3% |
| Ukraine | 22 | 0.1% |
| Vietnam | 249 | 1.0% |
| Western Africa | 11 | 0.0% |
| Western Asia | 74 | 0.3% |
| Zimbabwe | 7 | 0.0% | View All 41 Rows |
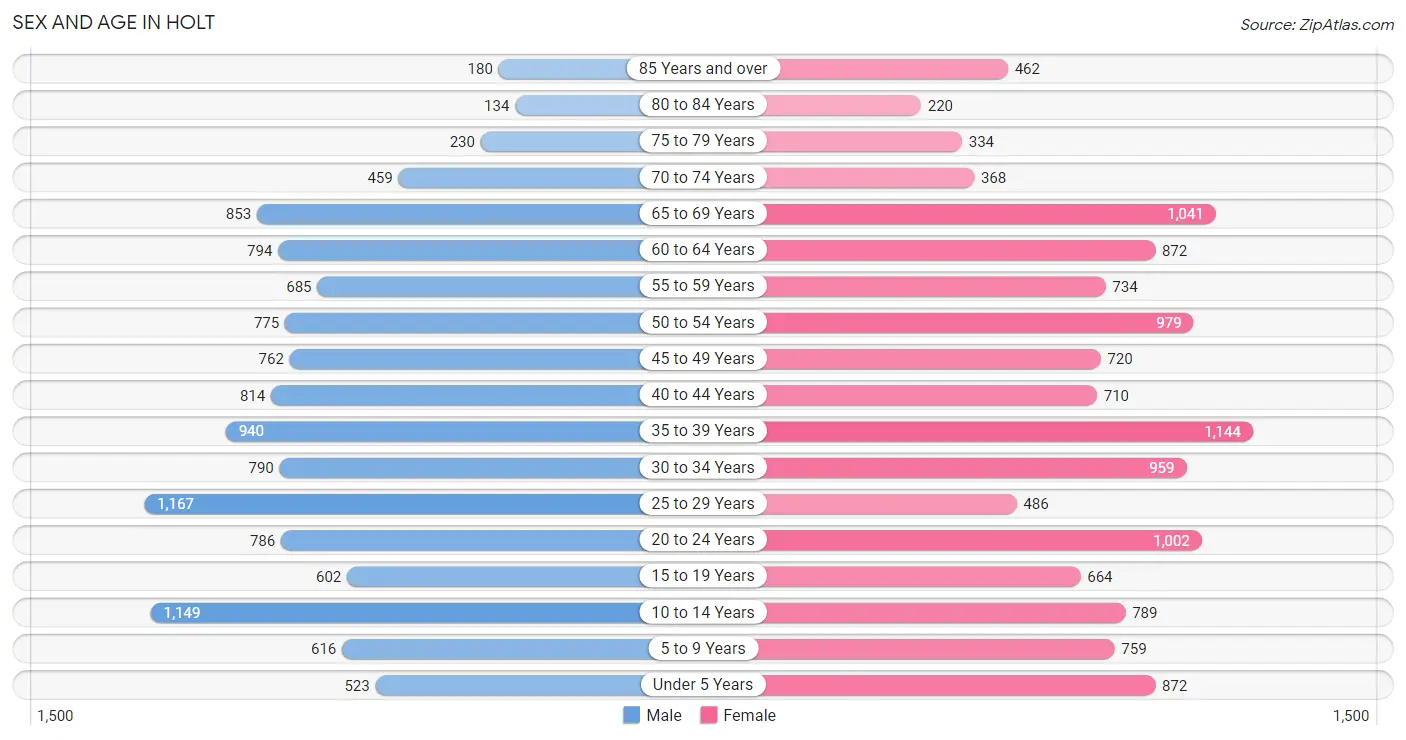
Sex and Age in Holt
Sex and Age in Holt
The most populous age groups in Holt are 25 to 29 Years (1,167 | 9.5%) for men and 35 to 39 Years (1,144 | 8.7%) for women.
| Age Bracket | Male | Female |
| Under 5 Years | 523 (4.3%) | 872 (6.7%) |
| 5 to 9 Years | 616 (5.0%) | 759 (5.8%) |
| 10 to 14 Years | 1,149 (9.4%) | 789 (6.0%) |
| 15 to 19 Years | 602 (4.9%) | 664 (5.1%) |
| 20 to 24 Years | 786 (6.4%) | 1,002 (7.6%) |
| 25 to 29 Years | 1,167 (9.5%) | 486 (3.7%) |
| 30 to 34 Years | 790 (6.4%) | 959 (7.3%) |
| 35 to 39 Years | 940 (7.7%) | 1,144 (8.7%) |
| 40 to 44 Years | 814 (6.6%) | 710 (5.4%) |
| 45 to 49 Years | 762 (6.2%) | 720 (5.5%) |
| 50 to 54 Years | 775 (6.3%) | 979 (7.5%) |
| 55 to 59 Years | 685 (5.6%) | 734 (5.6%) |
| 60 to 64 Years | 794 (6.5%) | 872 (6.7%) |
| 65 to 69 Years | 853 (7.0%) | 1,041 (7.9%) |
| 70 to 74 Years | 459 (3.7%) | 368 (2.8%) |
| 75 to 79 Years | 230 (1.9%) | 334 (2.5%) |
| 80 to 84 Years | 134 (1.1%) | 220 (1.7%) |
| 85 Years and over | 180 (1.5%) | 462 (3.5%) |
| Total | 12,259 (100.0%) | 13,115 (100.0%) |
Families and Households in Holt
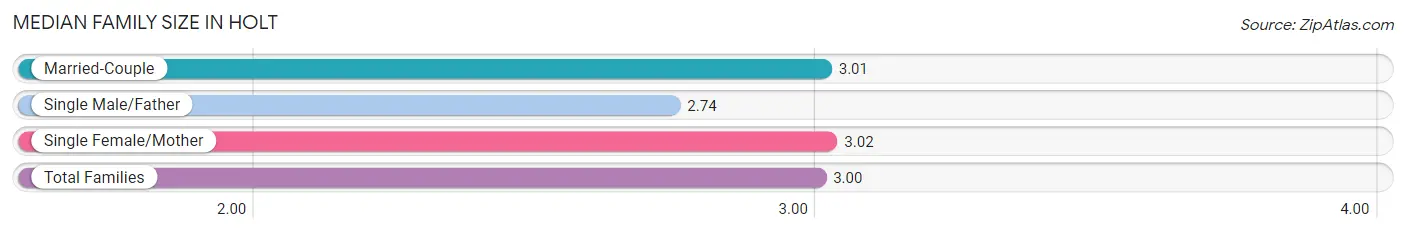
Median Family Size in Holt
The median family size in Holt is 3.00 persons per family, with single female/mother families (1,245 | 19.0%) accounting for the largest median family size of 3.02 persons per family. On the other hand, single male/father families (354 | 5.4%) represent the smallest median family size with 2.74 persons per family.
| Family Type | # Families | Family Size |
| Married-Couple | 4,964 (75.6%) | 3.01 |
| Single Male/Father | 354 (5.4%) | 2.74 |
| Single Female/Mother | 1,245 (19.0%) | 3.02 |
| Total Families | 6,563 (100.0%) | 3.00 |
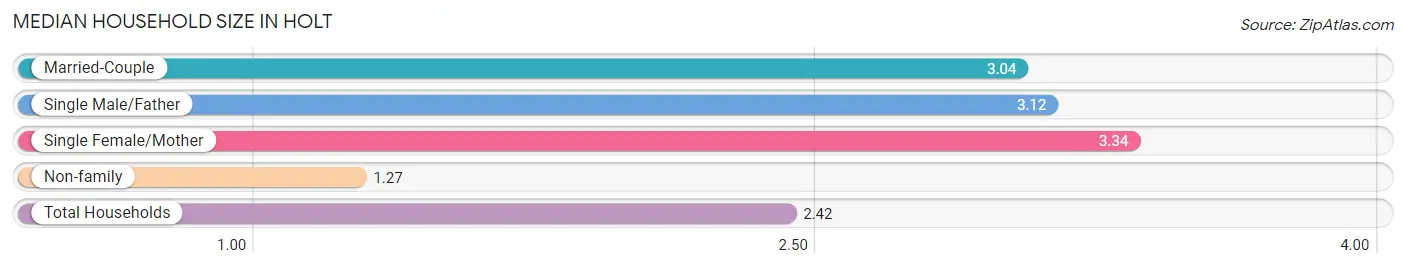
Median Household Size in Holt
The median household size in Holt is 2.42 persons per household, with single female/mother households (1,245 | 12.0%) accounting for the largest median household size of 3.34 persons per household. non-family households (3,846 | 36.9%) represent the smallest median household size with 1.27 persons per household.
| Household Type | # Households | Household Size |
| Married-Couple | 4,964 (47.7%) | 3.04 |
| Single Male/Father | 354 (3.4%) | 3.12 |
| Single Female/Mother | 1,245 (12.0%) | 3.34 |
| Non-family | 3,846 (36.9%) | 1.27 |
| Total Households | 10,409 (100.0%) | 2.42 |
Household Size by Marriage Status in Holt
Out of a total of 10,409 households in Holt, 6,563 (63.0%) are family households, while 3,846 (36.9%) are nonfamily households. The most numerous type of family households are 2-person households, comprising 2,944, and the most common type of nonfamily households are 1-person households, comprising 3,143.
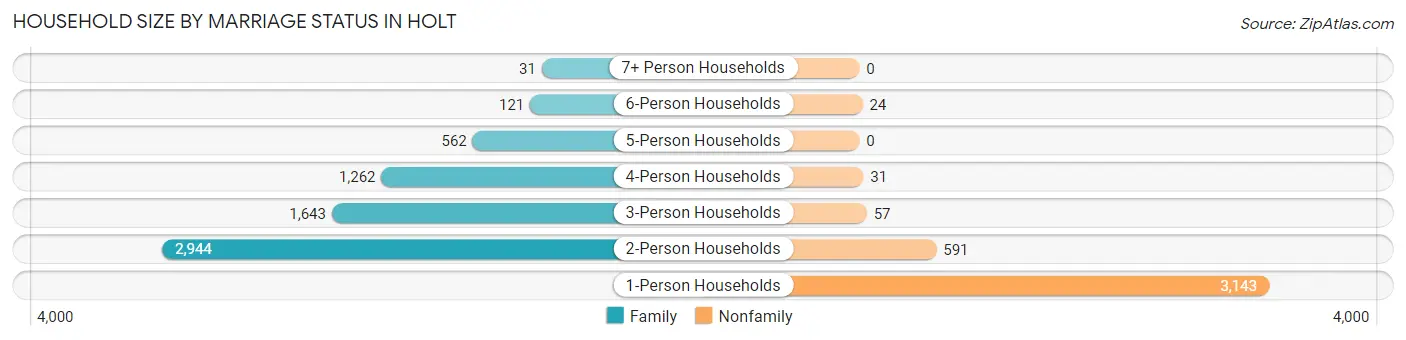
| Household Size | Family Households | Nonfamily Households |
| 1-Person Households | - | 3,143 (30.2%) |
| 2-Person Households | 2,944 (28.3%) | 591 (5.7%) |
| 3-Person Households | 1,643 (15.8%) | 57 (0.5%) |
| 4-Person Households | 1,262 (12.1%) | 31 (0.3%) |
| 5-Person Households | 562 (5.4%) | 0 (0.0%) |
| 6-Person Households | 121 (1.2%) | 24 (0.2%) |
| 7+ Person Households | 31 (0.3%) | 0 (0.0%) |
| Total | 6,563 (63.0%) | 3,846 (36.9%) |
Female Fertility in Holt
Fertility by Age in Holt
Average fertility rate in Holt is 80.0 births per 1,000 women. Women in the age bracket of 20 to 34 years have the highest fertility rate with 124.0 births per 1,000 women. Women in the age bracket of 20 to 34 years acount for 64.9% of all women with births.
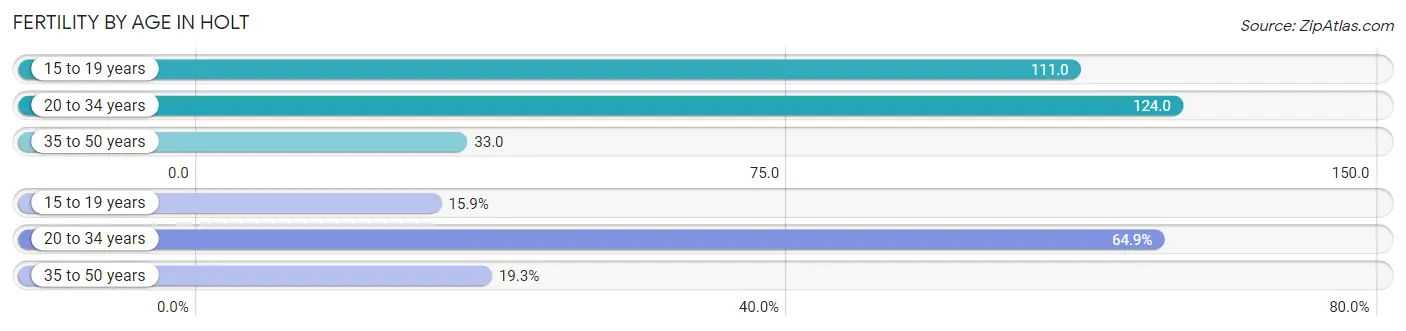
| Age Bracket | Women with Births | Births / 1,000 Women |
| 15 to 19 years | 74 (15.9%) | 111.0 |
| 20 to 34 years | 303 (64.9%) | 124.0 |
| 35 to 50 years | 90 (19.3%) | 33.0 |
| Total | 467 (100.0%) | 80.0 |
Fertility by Age by Marriage Status in Holt
45.2% of women with births (467) in Holt are married. The highest percentage of unmarried women with births falls into 15 to 19 years age bracket with 100.0% of them unmarried at the time of birth, while the lowest percentage of unmarried women with births belong to 35 to 50 years age bracket with 0.0% of them unmarried.
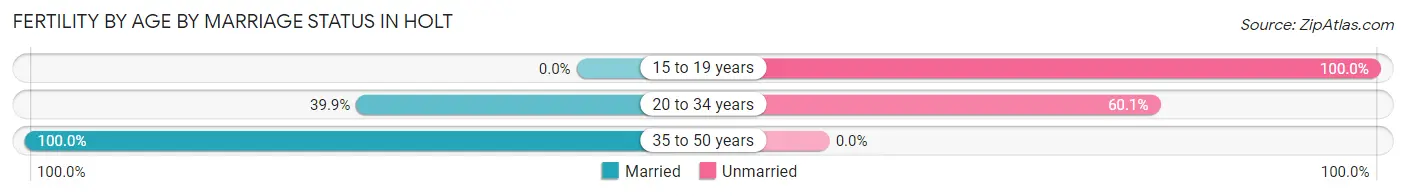
| Age Bracket | Married | Unmarried |
| 15 to 19 years | 0 (0.0%) | 74 (100.0%) |
| 20 to 34 years | 121 (39.9%) | 182 (60.1%) |
| 35 to 50 years | 90 (100.0%) | 0 (0.0%) |
| Total | 211 (45.2%) | 256 (54.8%) |
Fertility by Education in Holt
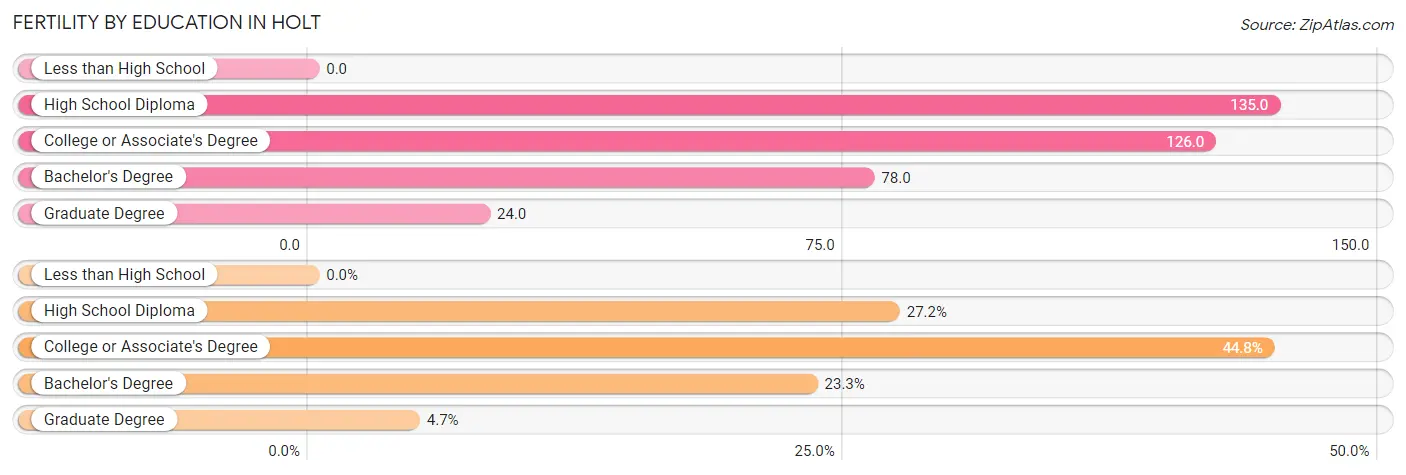
| Educational Attainment | Women with Births | Births / 1,000 Women |
| Less than High School | 0 (0.0%) | 0.0 |
| High School Diploma | 127 (27.2%) | 135.0 |
| College or Associate's Degree | 209 (44.8%) | 126.0 |
| Bachelor's Degree | 109 (23.3%) | 78.0 |
| Graduate Degree | 22 (4.7%) | 24.0 |
| Total | 467 (100.0%) | 80.0 |
Fertility by Education by Marriage Status in Holt
54.8% of women with births in Holt are unmarried. Women with the educational attainment of graduate degree are most likely to be married with 100.0% of them married at childbirth, while women with the educational attainment of high school diploma are least likely to be married with 76.4% of them unmarried at childbirth.
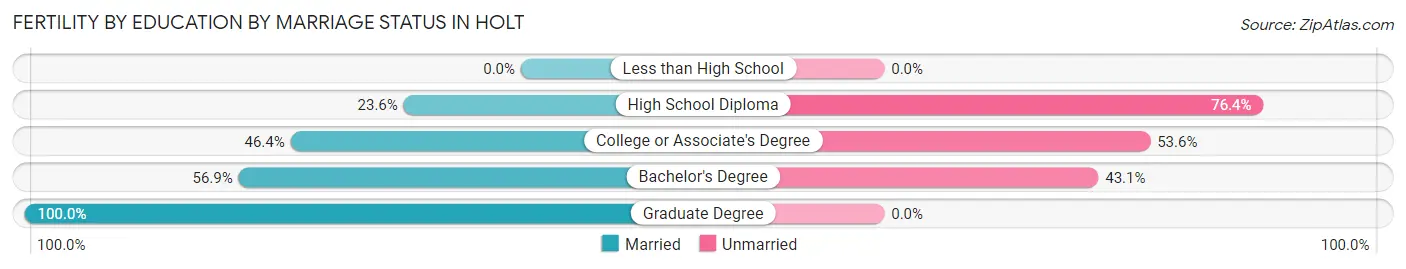
| Educational Attainment | Married | Unmarried |
| Less than High School | 0 (0.0%) | 0 (0.0%) |
| High School Diploma | 30 (23.6%) | 97 (76.4%) |
| College or Associate's Degree | 97 (46.4%) | 112 (53.6%) |
| Bachelor's Degree | 62 (56.9%) | 47 (43.1%) |
| Graduate Degree | 22 (100.0%) | 0 (0.0%) |
| Total | 211 (45.2%) | 256 (54.8%) |
Employment Characteristics in Holt
Employment by Class of Employer in Holt
Among the 13,090 employed individuals in Holt, private company employees (7,844 | 59.9%), not-for-profit organizations (1,784 | 13.6%), and state government employees (1,409 | 10.8%) make up the most common classes of employment.
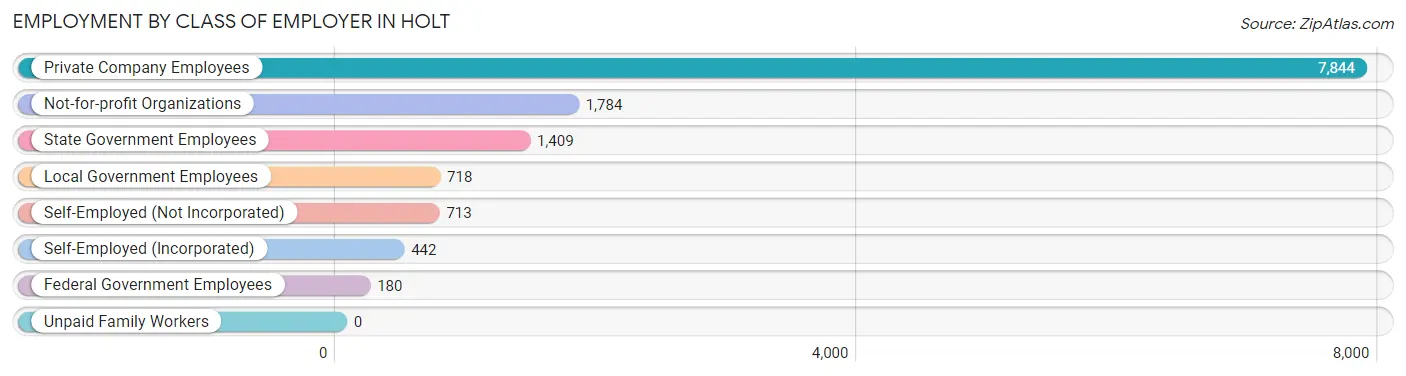
| Employer Class | # Employees | % Employees |
| Private Company Employees | 7,844 | 59.9% |
| Self-Employed (Incorporated) | 442 | 3.4% |
| Self-Employed (Not Incorporated) | 713 | 5.4% |
| Not-for-profit Organizations | 1,784 | 13.6% |
| Local Government Employees | 718 | 5.5% |
| State Government Employees | 1,409 | 10.8% |
| Federal Government Employees | 180 | 1.4% |
| Unpaid Family Workers | 0 | 0.0% |
| Total | 13,090 | 100.0% |
Employment Status by Age in Holt
According to the labor force statistics for Holt, out of the total population over 16 years of age (20,294), 69.2% or 14,043 individuals are in the labor force, with 5.5% or 772 of them unemployed. The age group with the highest labor force participation rate is 25 to 29 years, with 93.5% or 1,546 individuals in the labor force. Within the labor force, the 20 to 24 years age range has the highest percentage of unemployed individuals, with 14.8% or 235 of them being unemployed.
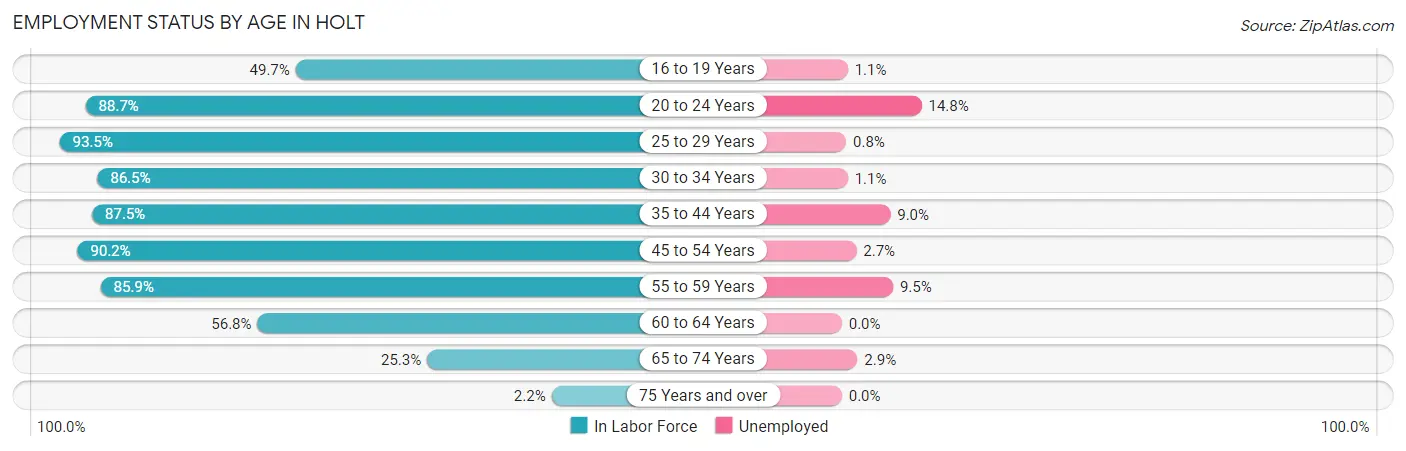
| Age Bracket | In Labor Force | Unemployed |
| 16 to 19 Years | 444 (49.7%) | 5 (1.1%) |
| 20 to 24 Years | 1,586 (88.7%) | 235 (14.8%) |
| 25 to 29 Years | 1,546 (93.5%) | 12 (0.8%) |
| 30 to 34 Years | 1,513 (86.5%) | 17 (1.1%) |
| 35 to 44 Years | 3,157 (87.5%) | 284 (9.0%) |
| 45 to 54 Years | 2,919 (90.2%) | 79 (2.7%) |
| 55 to 59 Years | 1,219 (85.9%) | 116 (9.5%) |
| 60 to 64 Years | 946 (56.8%) | 0 (0.0%) |
| 65 to 74 Years | 688 (25.3%) | 20 (2.9%) |
| 75 Years and over | 34 (2.2%) | 0 (0.0%) |
| Total | 14,043 (69.2%) | 772 (5.5%) |
Employment Status by Educational Attainment in Holt
According to labor force statistics for Holt, 84.8% of individuals (11,305) out of the total population between 25 and 64 years of age (13,331) are in the labor force, with 4.5% or 509 of them being unemployed. The group with the highest labor force participation rate are those with the educational attainment of bachelor's degree or higher, with 89.6% or 5,054 individuals in the labor force. Within the labor force, individuals with less than high school education have the highest percentage of unemployment, with 36.0% or 177 of them being unemployed.
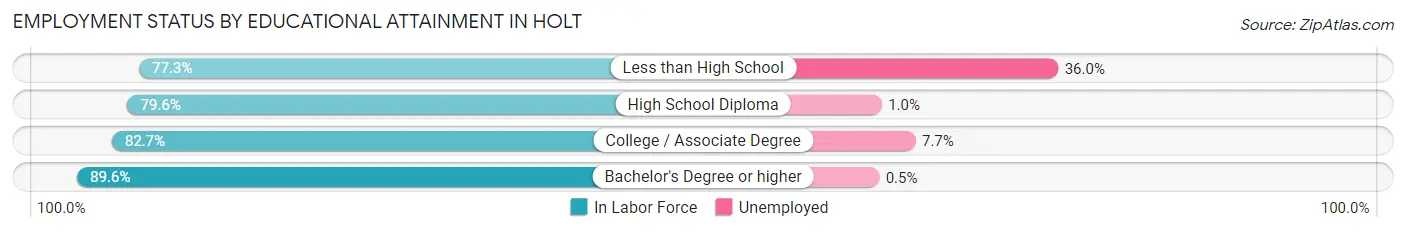
| Educational Attainment | In Labor Force | Unemployed |
| Less than High School | 491 (77.3%) | 229 (36.0%) |
| High School Diploma | 2,056 (79.6%) | 26 (1.0%) |
| College / Associate Degree | 3,698 (82.7%) | 344 (7.7%) |
| Bachelor's Degree or higher | 5,054 (89.6%) | 28 (0.5%) |
| Total | 11,305 (84.8%) | 600 (4.5%) |
Employment Occupations by Sex in Holt
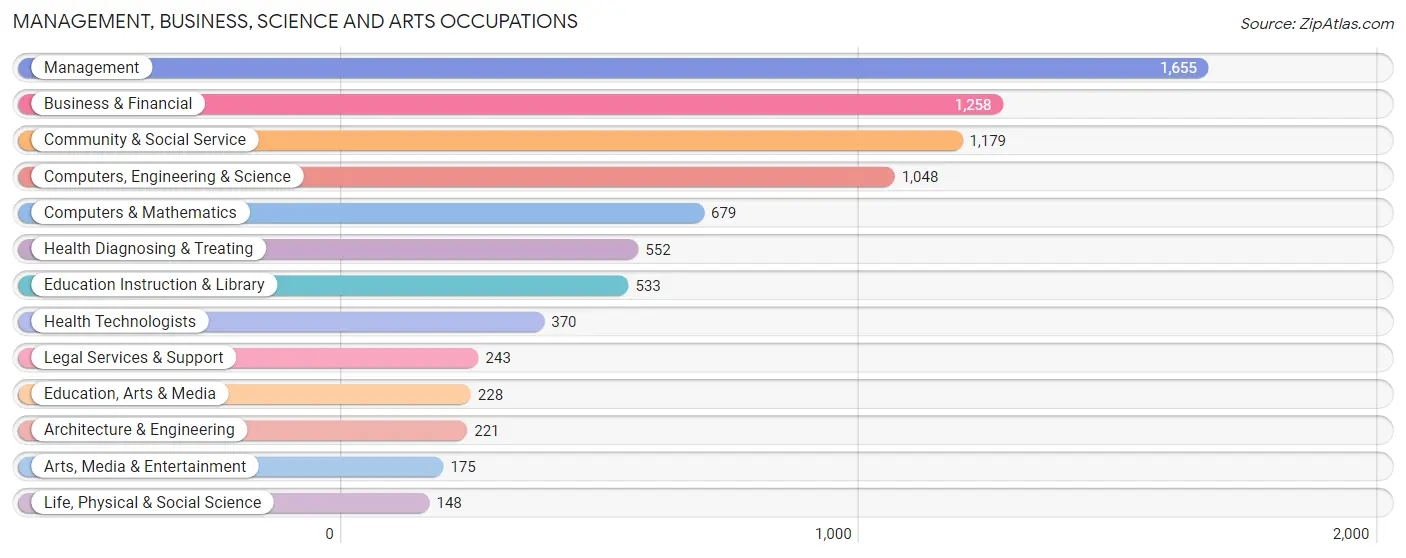
Management, Business, Science and Arts Occupations
The most common Management, Business, Science and Arts occupations in Holt are Management (1,655 | 12.5%), Business & Financial (1,258 | 9.5%), Community & Social Service (1,179 | 8.9%), Computers, Engineering & Science (1,048 | 7.9%), and Computers & Mathematics (679 | 5.1%).
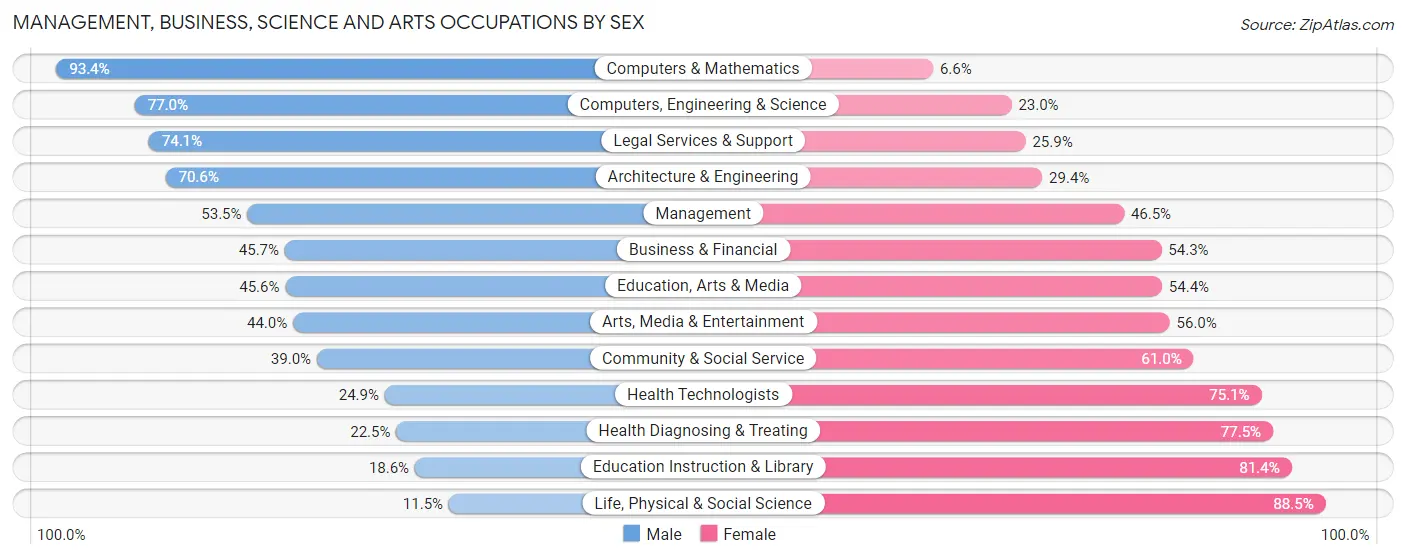
Management, Business, Science and Arts Occupations by Sex
Within the Management, Business, Science and Arts occupations in Holt, the most male-oriented occupations are Computers & Mathematics (93.4%), Computers, Engineering & Science (77.0%), and Legal Services & Support (74.1%), while the most female-oriented occupations are Life, Physical & Social Science (88.5%), Education Instruction & Library (81.4%), and Health Diagnosing & Treating (77.5%).
| Occupation | Male | Female |
| Management | 886 (53.5%) | 769 (46.5%) |
| Business & Financial | 575 (45.7%) | 683 (54.3%) |
| Computers, Engineering & Science | 807 (77.0%) | 241 (23.0%) |
| Computers & Mathematics | 634 (93.4%) | 45 (6.6%) |
| Architecture & Engineering | 156 (70.6%) | 65 (29.4%) |
| Life, Physical & Social Science | 17 (11.5%) | 131 (88.5%) |
| Community & Social Service | 460 (39.0%) | 719 (61.0%) |
| Education, Arts & Media | 104 (45.6%) | 124 (54.4%) |
| Legal Services & Support | 180 (74.1%) | 63 (25.9%) |
| Education Instruction & Library | 99 (18.6%) | 434 (81.4%) |
| Arts, Media & Entertainment | 77 (44.0%) | 98 (56.0%) |
| Health Diagnosing & Treating | 124 (22.5%) | 428 (77.5%) |
| Health Technologists | 92 (24.9%) | 278 (75.1%) |
| Total (Category) | 2,852 (50.1%) | 2,840 (49.9%) |
| Total (Overall) | 6,988 (52.7%) | 6,272 (47.3%) |
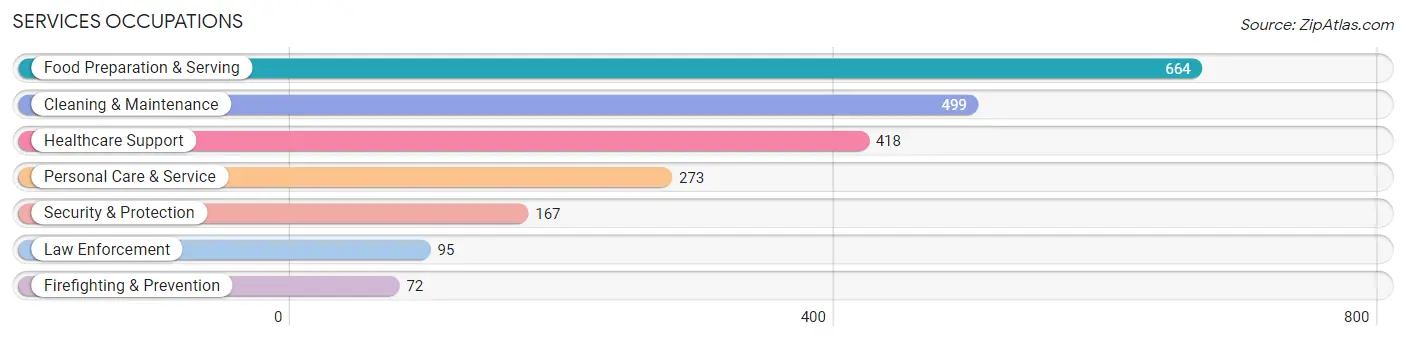
Services Occupations
The most common Services occupations in Holt are Food Preparation & Serving (664 | 5.0%), Cleaning & Maintenance (499 | 3.8%), Healthcare Support (418 | 3.2%), Personal Care & Service (273 | 2.1%), and Security & Protection (167 | 1.3%).
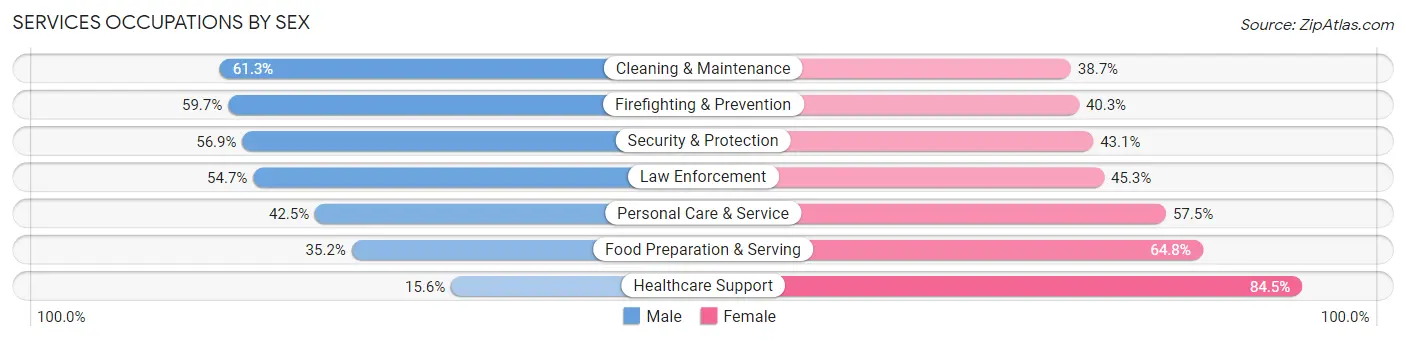
Services Occupations by Sex
Within the Services occupations in Holt, the most male-oriented occupations are Cleaning & Maintenance (61.3%), Firefighting & Prevention (59.7%), and Security & Protection (56.9%), while the most female-oriented occupations are Healthcare Support (84.5%), Food Preparation & Serving (64.8%), and Personal Care & Service (57.5%).
| Occupation | Male | Female |
| Healthcare Support | 65 (15.5%) | 353 (84.5%) |
| Security & Protection | 95 (56.9%) | 72 (43.1%) |
| Firefighting & Prevention | 43 (59.7%) | 29 (40.3%) |
| Law Enforcement | 52 (54.7%) | 43 (45.3%) |
| Food Preparation & Serving | 234 (35.2%) | 430 (64.8%) |
| Cleaning & Maintenance | 306 (61.3%) | 193 (38.7%) |
| Personal Care & Service | 116 (42.5%) | 157 (57.5%) |
| Total (Category) | 816 (40.4%) | 1,205 (59.6%) |
| Total (Overall) | 6,988 (52.7%) | 6,272 (47.3%) |
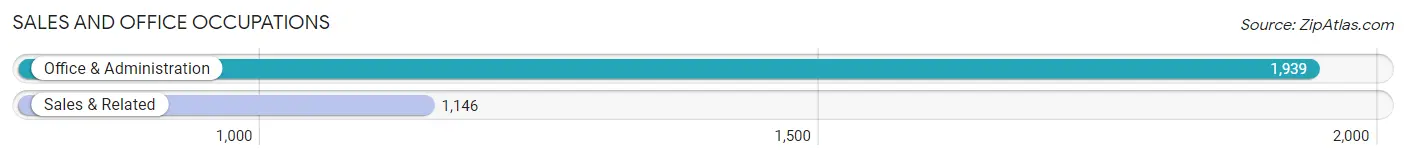
Sales and Office Occupations
The most common Sales and Office occupations in Holt are Office & Administration (1,939 | 14.6%), and Sales & Related (1,146 | 8.6%).
Sales and Office Occupations by Sex
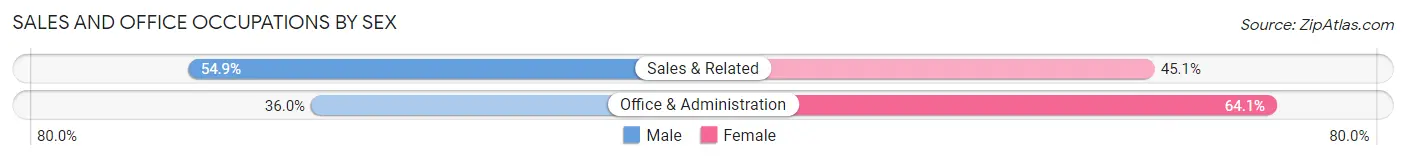
| Occupation | Male | Female |
| Sales & Related | 629 (54.9%) | 517 (45.1%) |
| Office & Administration | 697 (35.9%) | 1,242 (64.0%) |
| Total (Category) | 1,326 (43.0%) | 1,759 (57.0%) |
| Total (Overall) | 6,988 (52.7%) | 6,272 (47.3%) |
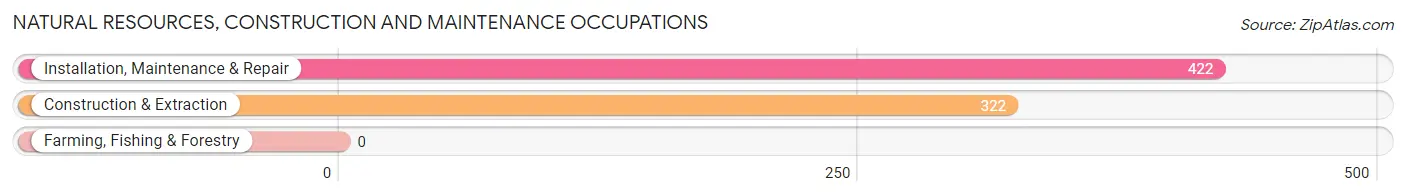
Natural Resources, Construction and Maintenance Occupations
The most common Natural Resources, Construction and Maintenance occupations in Holt are Installation, Maintenance & Repair (422 | 3.2%), and Construction & Extraction (322 | 2.4%).
Natural Resources, Construction and Maintenance Occupations by Sex
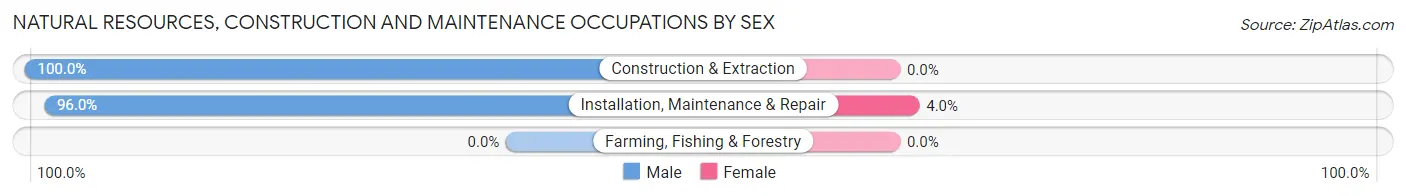
| Occupation | Male | Female |
| Farming, Fishing & Forestry | 0 (0.0%) | 0 (0.0%) |
| Construction & Extraction | 322 (100.0%) | 0 (0.0%) |
| Installation, Maintenance & Repair | 405 (96.0%) | 17 (4.0%) |
| Total (Category) | 727 (97.7%) | 17 (2.3%) |
| Total (Overall) | 6,988 (52.7%) | 6,272 (47.3%) |
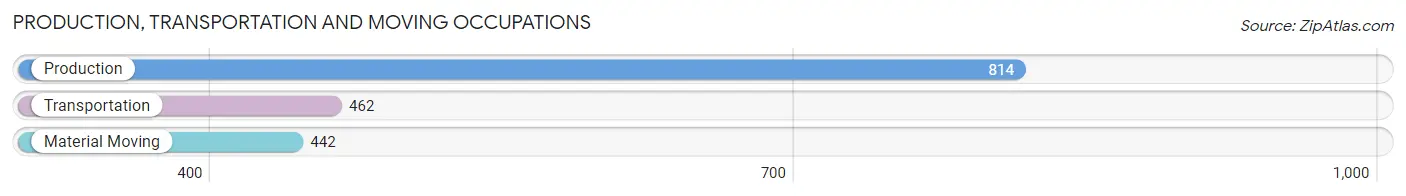
Production, Transportation and Moving Occupations
The most common Production, Transportation and Moving occupations in Holt are Production (814 | 6.1%), Transportation (462 | 3.5%), and Material Moving (442 | 3.3%).
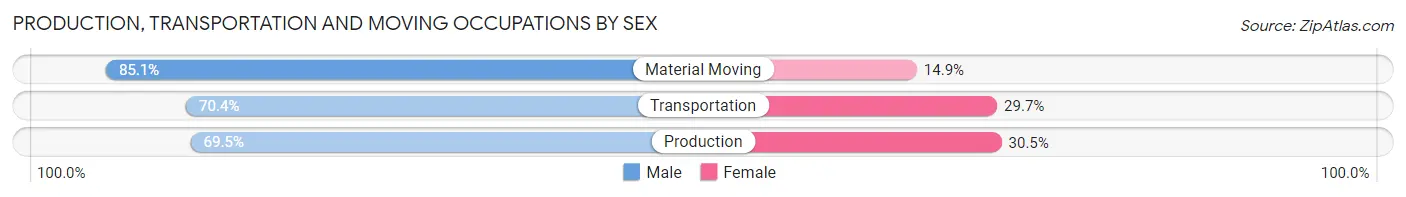
Production, Transportation and Moving Occupations by Sex
| Occupation | Male | Female |
| Production | 566 (69.5%) | 248 (30.5%) |
| Transportation | 325 (70.4%) | 137 (29.6%) |
| Material Moving | 376 (85.1%) | 66 (14.9%) |
| Total (Category) | 1,267 (73.8%) | 451 (26.3%) |
| Total (Overall) | 6,988 (52.7%) | 6,272 (47.3%) |
Employment Industries by Sex in Holt
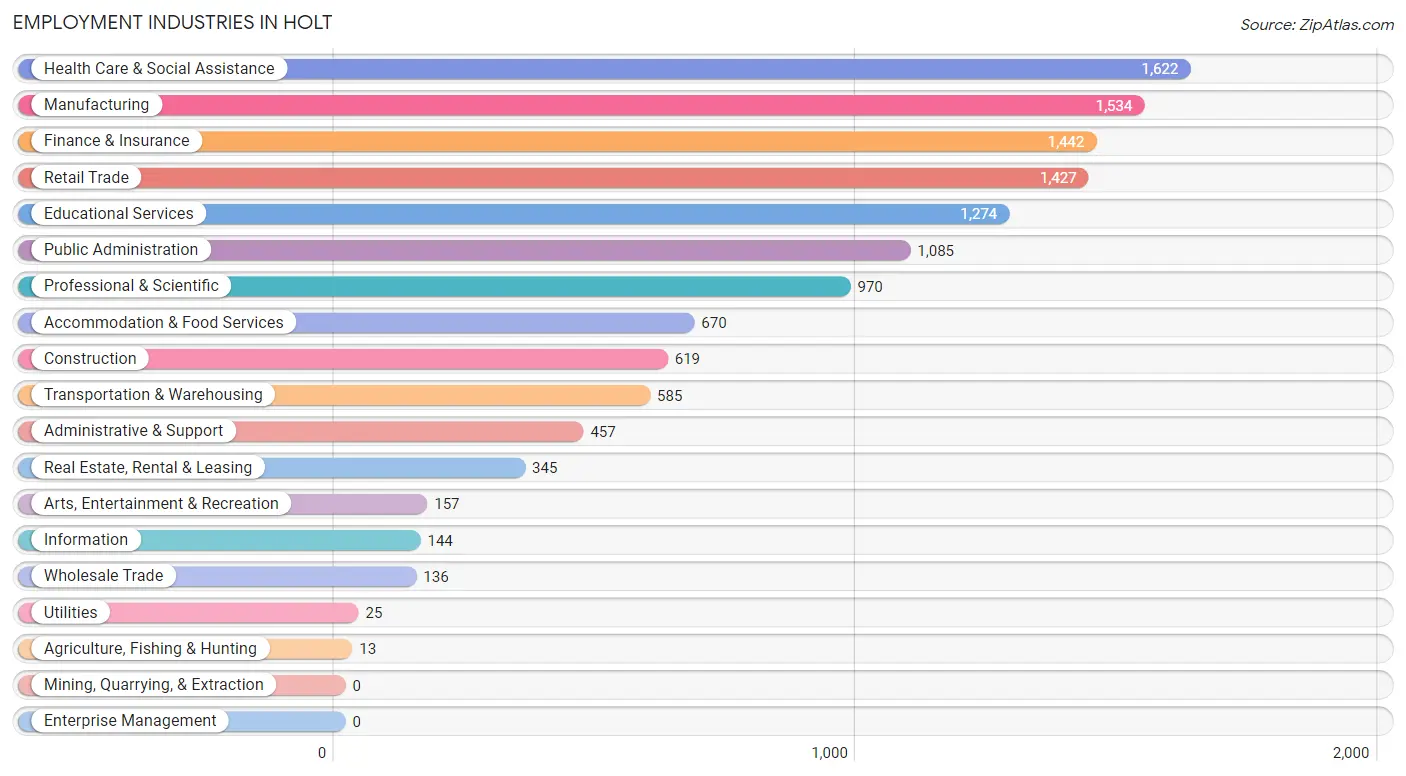
Employment Industries in Holt
The major employment industries in Holt include Health Care & Social Assistance (1,622 | 12.2%), Manufacturing (1,534 | 11.6%), Finance & Insurance (1,442 | 10.9%), Retail Trade (1,427 | 10.8%), and Educational Services (1,274 | 9.6%).
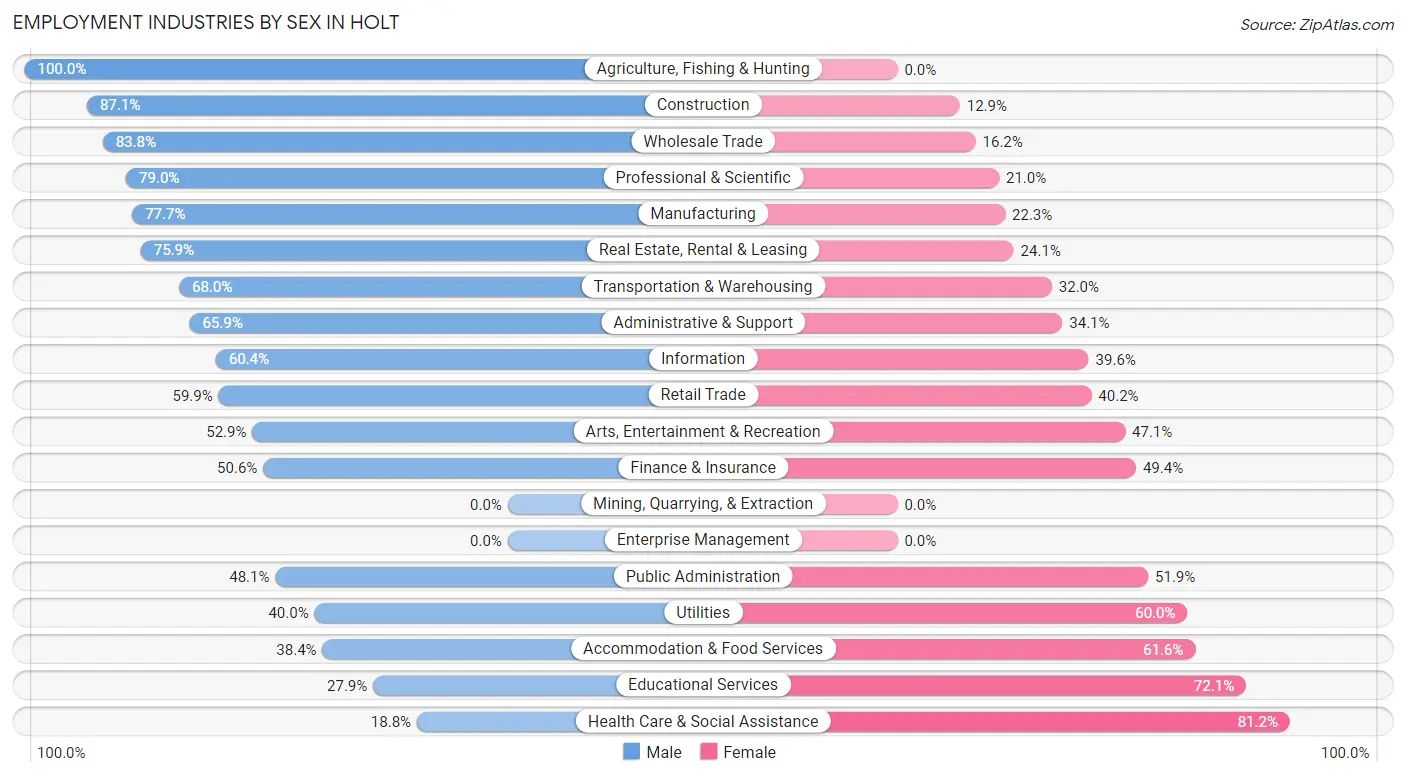
Employment Industries by Sex in Holt
The Holt industries that see more men than women are Agriculture, Fishing & Hunting (100.0%), Construction (87.1%), and Wholesale Trade (83.8%), whereas the industries that tend to have a higher number of women are Health Care & Social Assistance (81.2%), Educational Services (72.1%), and Accommodation & Food Services (61.6%).
| Industry | Male | Female |
| Agriculture, Fishing & Hunting | 13 (100.0%) | 0 (0.0%) |
| Mining, Quarrying, & Extraction | 0 (0.0%) | 0 (0.0%) |
| Construction | 539 (87.1%) | 80 (12.9%) |
| Manufacturing | 1,192 (77.7%) | 342 (22.3%) |
| Wholesale Trade | 114 (83.8%) | 22 (16.2%) |
| Retail Trade | 854 (59.9%) | 573 (40.2%) |
| Transportation & Warehousing | 398 (68.0%) | 187 (32.0%) |
| Utilities | 10 (40.0%) | 15 (60.0%) |
| Information | 87 (60.4%) | 57 (39.6%) |
| Finance & Insurance | 730 (50.6%) | 712 (49.4%) |
| Real Estate, Rental & Leasing | 262 (75.9%) | 83 (24.1%) |
| Professional & Scientific | 766 (79.0%) | 204 (21.0%) |
| Enterprise Management | 0 (0.0%) | 0 (0.0%) |
| Administrative & Support | 301 (65.9%) | 156 (34.1%) |
| Educational Services | 355 (27.9%) | 919 (72.1%) |
| Health Care & Social Assistance | 305 (18.8%) | 1,317 (81.2%) |
| Arts, Entertainment & Recreation | 83 (52.9%) | 74 (47.1%) |
| Accommodation & Food Services | 257 (38.4%) | 413 (61.6%) |
| Public Administration | 522 (48.1%) | 563 (51.9%) |
| Total | 6,988 (52.7%) | 6,272 (47.3%) |
Education in Holt
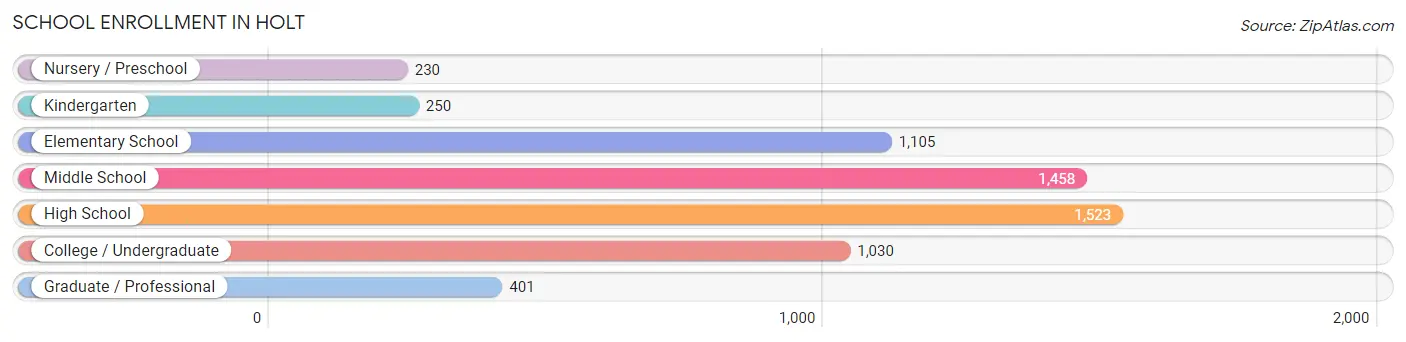
School Enrollment in Holt
The most common levels of schooling among the 5,997 students in Holt are high school (1,523 | 25.4%), middle school (1,458 | 24.3%), and elementary school (1,105 | 18.4%).
| School Level | # Students | % Students |
| Nursery / Preschool | 230 | 3.8% |
| Kindergarten | 250 | 4.2% |
| Elementary School | 1,105 | 18.4% |
| Middle School | 1,458 | 24.3% |
| High School | 1,523 | 25.4% |
| College / Undergraduate | 1,030 | 17.2% |
| Graduate / Professional | 401 | 6.7% |
| Total | 5,997 | 100.0% |
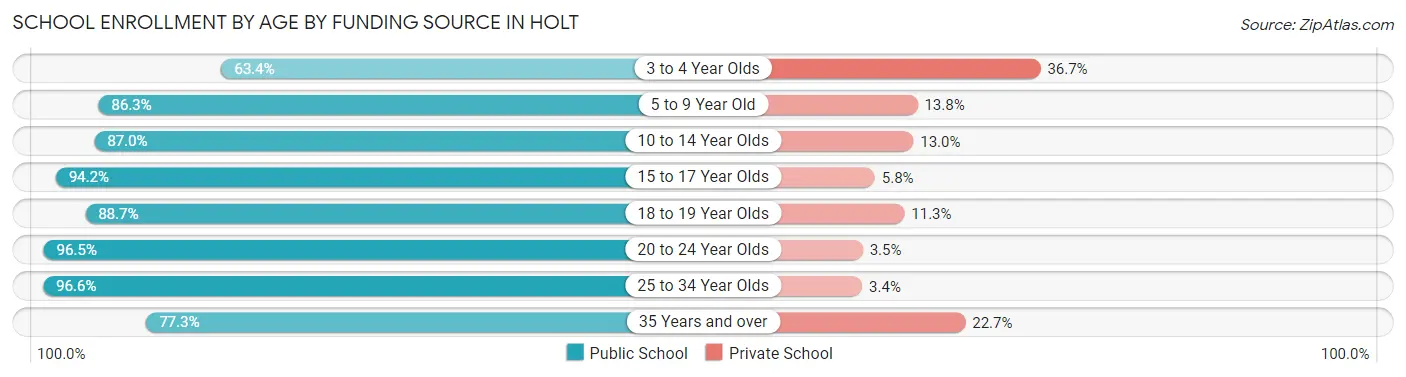
School Enrollment by Age by Funding Source in Holt
Out of a total of 5,997 students who are enrolled in schools in Holt, 738 (12.3%) attend a private institution, while the remaining 5,259 (87.7%) are enrolled in public schools. The age group of 3 to 4 year olds has the highest likelihood of being enrolled in private schools, with 70 (36.6% in the age bracket) enrolled. Conversely, the age group of 25 to 34 year olds has the lowest likelihood of being enrolled in a private school, with 253 (96.6% in the age bracket) attending a public institution.
| Age Bracket | Public School | Private School |
| 3 to 4 Year Olds | 121 (63.3%) | 70 (36.6%) |
| 5 to 9 Year Old | 1,135 (86.3%) | 181 (13.8%) |
| 10 to 14 Year Olds | 1,678 (87.0%) | 250 (13.0%) |
| 15 to 17 Year Olds | 942 (94.2%) | 58 (5.8%) |
| 18 to 19 Year Olds | 157 (88.7%) | 20 (11.3%) |
| 20 to 24 Year Olds | 517 (96.5%) | 19 (3.5%) |
| 25 to 34 Year Olds | 253 (96.6%) | 9 (3.4%) |
| 35 Years and over | 454 (77.3%) | 133 (22.7%) |
| Total | 5,259 (87.7%) | 738 (12.3%) |
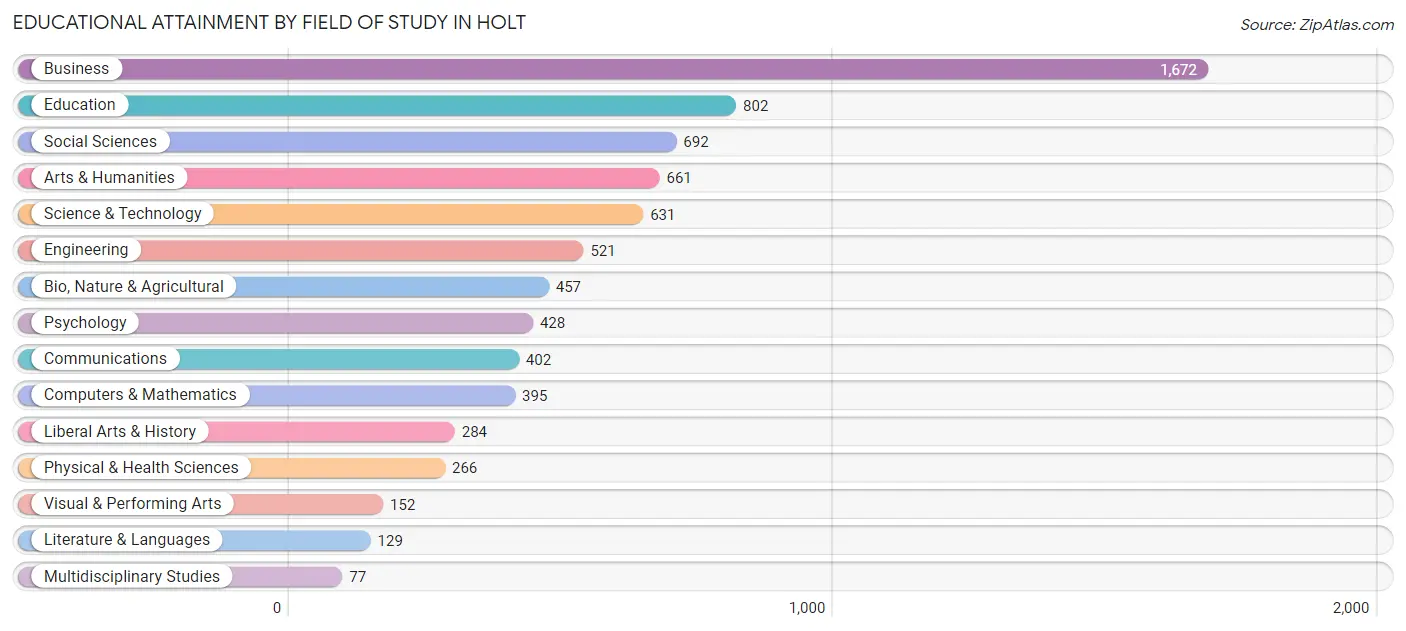
Educational Attainment by Field of Study in Holt
Business (1,672 | 22.1%), education (802 | 10.6%), social sciences (692 | 9.1%), arts & humanities (661 | 8.7%), and science & technology (631 | 8.3%) are the most common fields of study among 7,569 individuals in Holt who have obtained a bachelor's degree or higher.
| Field of Study | # Graduates | % Graduates |
| Computers & Mathematics | 395 | 5.2% |
| Bio, Nature & Agricultural | 457 | 6.0% |
| Physical & Health Sciences | 266 | 3.5% |
| Psychology | 428 | 5.7% |
| Social Sciences | 692 | 9.1% |
| Engineering | 521 | 6.9% |
| Multidisciplinary Studies | 77 | 1.0% |
| Science & Technology | 631 | 8.3% |
| Business | 1,672 | 22.1% |
| Education | 802 | 10.6% |
| Literature & Languages | 129 | 1.7% |
| Liberal Arts & History | 284 | 3.7% |
| Visual & Performing Arts | 152 | 2.0% |
| Communications | 402 | 5.3% |
| Arts & Humanities | 661 | 8.7% |
| Total | 7,569 | 100.0% |
Transportation & Commute in Holt
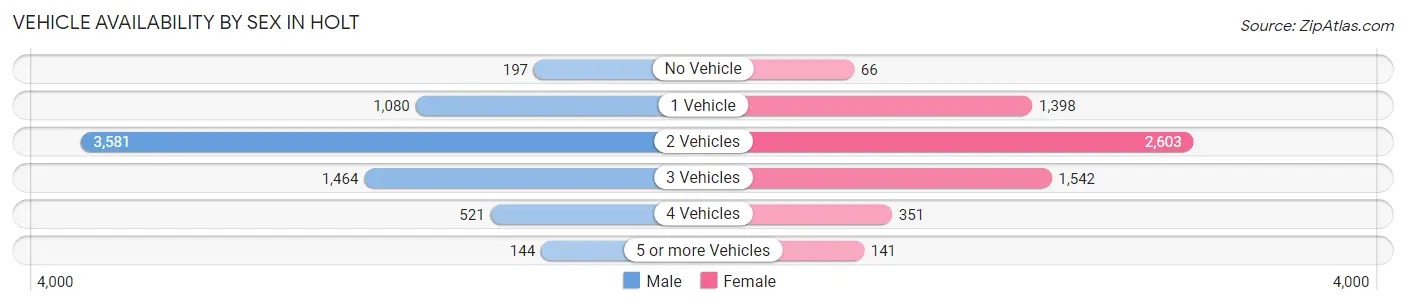
Vehicle Availability by Sex in Holt
The most prevalent vehicle ownership categories in Holt are males with 2 vehicles (3,581, accounting for 51.2%) and females with 2 vehicles (2,603, making up 58.7%).
| Vehicles Available | Male | Female |
| No Vehicle | 197 (2.8%) | 66 (1.1%) |
| 1 Vehicle | 1,080 (15.5%) | 1,398 (22.9%) |
| 2 Vehicles | 3,581 (51.2%) | 2,603 (42.7%) |
| 3 Vehicles | 1,464 (20.9%) | 1,542 (25.3%) |
| 4 Vehicles | 521 (7.5%) | 351 (5.8%) |
| 5 or more Vehicles | 144 (2.1%) | 141 (2.3%) |
| Total | 6,987 (100.0%) | 6,101 (100.0%) |
Commute Time in Holt
The most frequently occuring commute durations in Holt are 20 to 24 minutes (2,899 commuters, 25.4%), 15 to 19 minutes (2,547 commuters, 22.3%), and 10 to 14 minutes (1,640 commuters, 14.4%).
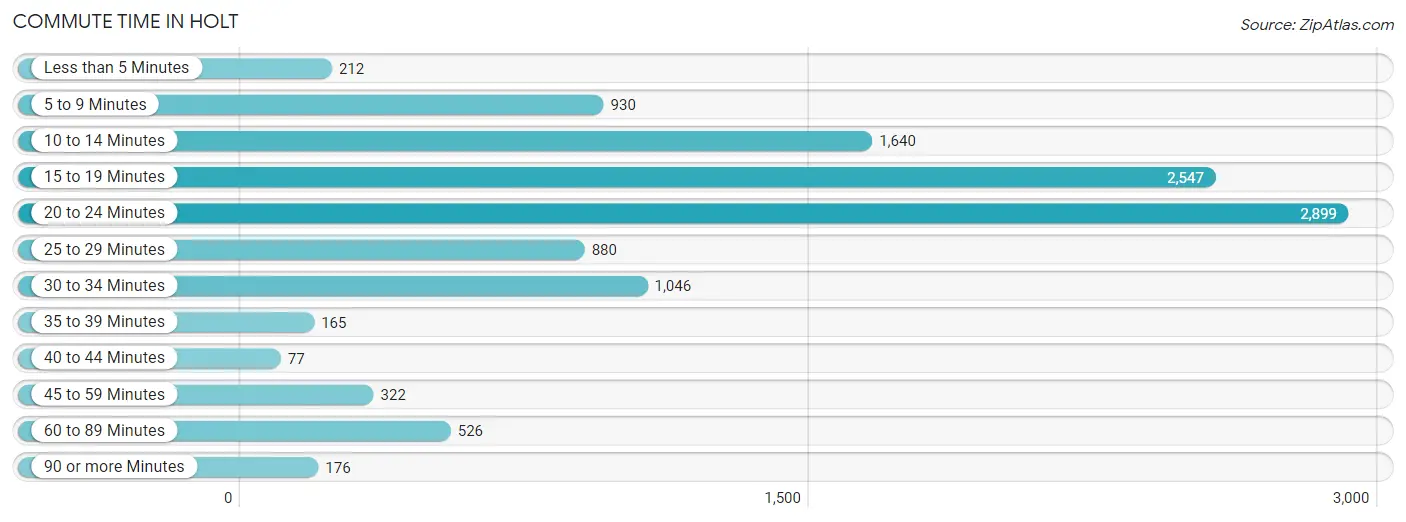
| Commute Time | # Commuters | % Commuters |
| Less than 5 Minutes | 212 | 1.9% |
| 5 to 9 Minutes | 930 | 8.1% |
| 10 to 14 Minutes | 1,640 | 14.4% |
| 15 to 19 Minutes | 2,547 | 22.3% |
| 20 to 24 Minutes | 2,899 | 25.4% |
| 25 to 29 Minutes | 880 | 7.7% |
| 30 to 34 Minutes | 1,046 | 9.2% |
| 35 to 39 Minutes | 165 | 1.4% |
| 40 to 44 Minutes | 77 | 0.7% |
| 45 to 59 Minutes | 322 | 2.8% |
| 60 to 89 Minutes | 526 | 4.6% |
| 90 or more Minutes | 176 | 1.5% |
Commute Time by Sex in Holt
The most common commute times in Holt are 20 to 24 minutes (1,265 commuters, 21.3%) for males and 20 to 24 minutes (1,634 commuters, 29.9%) for females.
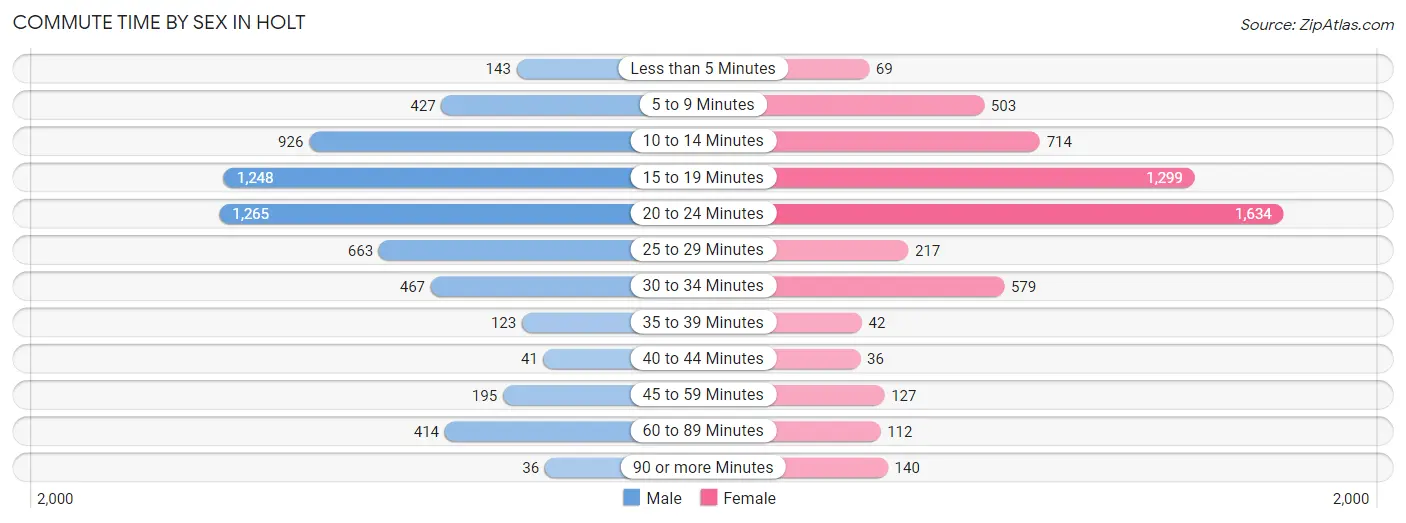
| Commute Time | Male | Female |
| Less than 5 Minutes | 143 (2.4%) | 69 (1.3%) |
| 5 to 9 Minutes | 427 (7.2%) | 503 (9.2%) |
| 10 to 14 Minutes | 926 (15.6%) | 714 (13.1%) |
| 15 to 19 Minutes | 1,248 (21.0%) | 1,299 (23.7%) |
| 20 to 24 Minutes | 1,265 (21.3%) | 1,634 (29.9%) |
| 25 to 29 Minutes | 663 (11.2%) | 217 (4.0%) |
| 30 to 34 Minutes | 467 (7.9%) | 579 (10.6%) |
| 35 to 39 Minutes | 123 (2.1%) | 42 (0.8%) |
| 40 to 44 Minutes | 41 (0.7%) | 36 (0.7%) |
| 45 to 59 Minutes | 195 (3.3%) | 127 (2.3%) |
| 60 to 89 Minutes | 414 (7.0%) | 112 (2.1%) |
| 90 or more Minutes | 36 (0.6%) | 140 (2.6%) |
Time of Departure to Work by Sex in Holt
The most frequent times of departure to work in Holt are 7:00 AM to 7:29 AM (815, 13.7%) for males and 7:00 AM to 7:29 AM (1,096, 20.0%) for females.
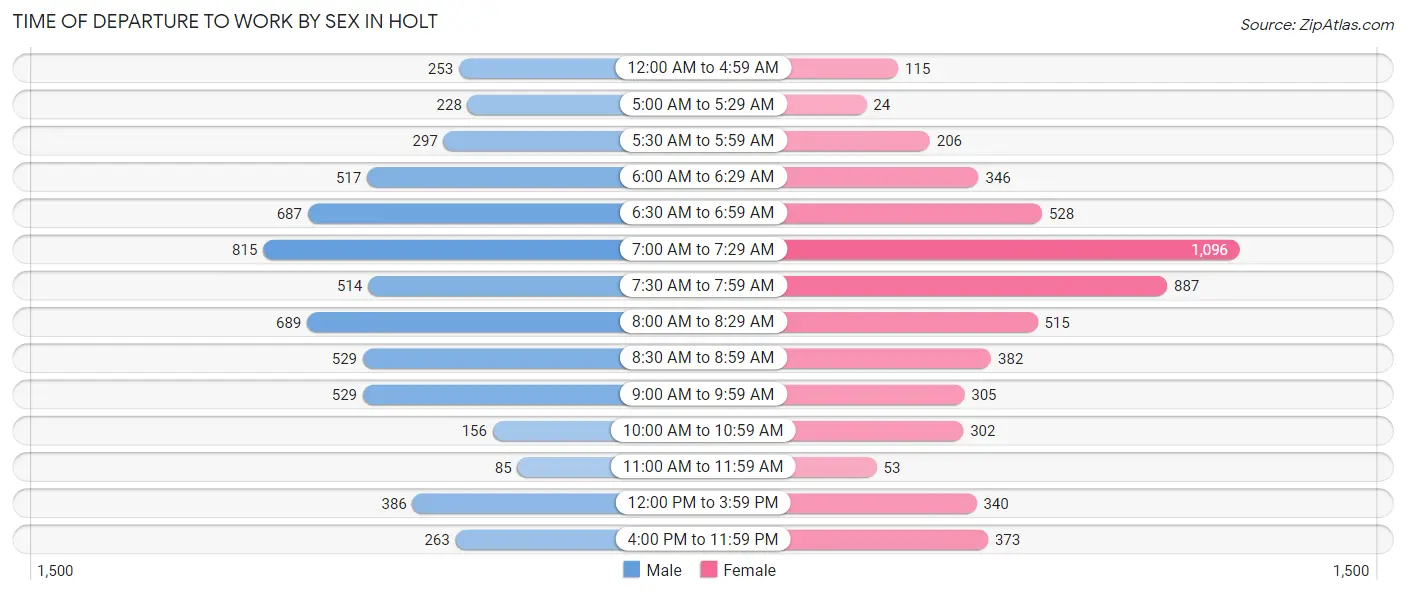
| Time of Departure | Male | Female |
| 12:00 AM to 4:59 AM | 253 (4.3%) | 115 (2.1%) |
| 5:00 AM to 5:29 AM | 228 (3.8%) | 24 (0.4%) |
| 5:30 AM to 5:59 AM | 297 (5.0%) | 206 (3.8%) |
| 6:00 AM to 6:29 AM | 517 (8.7%) | 346 (6.3%) |
| 6:30 AM to 6:59 AM | 687 (11.6%) | 528 (9.7%) |
| 7:00 AM to 7:29 AM | 815 (13.7%) | 1,096 (20.0%) |
| 7:30 AM to 7:59 AM | 514 (8.6%) | 887 (16.2%) |
| 8:00 AM to 8:29 AM | 689 (11.6%) | 515 (9.4%) |
| 8:30 AM to 8:59 AM | 529 (8.9%) | 382 (7.0%) |
| 9:00 AM to 9:59 AM | 529 (8.9%) | 305 (5.6%) |
| 10:00 AM to 10:59 AM | 156 (2.6%) | 302 (5.5%) |
| 11:00 AM to 11:59 AM | 85 (1.4%) | 53 (1.0%) |
| 12:00 PM to 3:59 PM | 386 (6.5%) | 340 (6.2%) |
| 4:00 PM to 11:59 PM | 263 (4.4%) | 373 (6.8%) |
| Total | 5,948 (100.0%) | 5,472 (100.0%) |
Housing Occupancy in Holt
Occupancy by Ownership in Holt
Of the total 10,409 dwellings in Holt, owner-occupied units account for 6,834 (65.6%), while renter-occupied units make up 3,575 (34.4%).
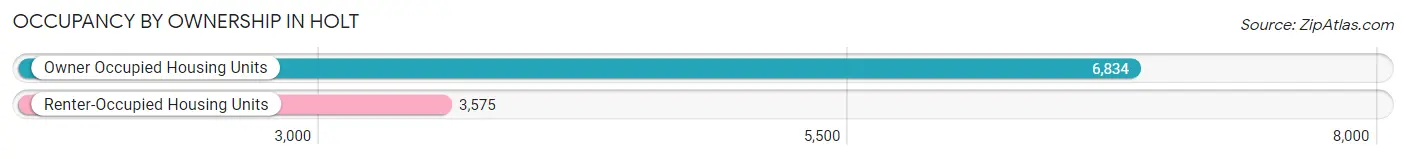
| Occupancy | # Housing Units | % Housing Units |
| Owner Occupied Housing Units | 6,834 | 65.6% |
| Renter-Occupied Housing Units | 3,575 | 34.4% |
| Total Occupied Housing Units | 10,409 | 100.0% |
Occupancy by Household Size in Holt
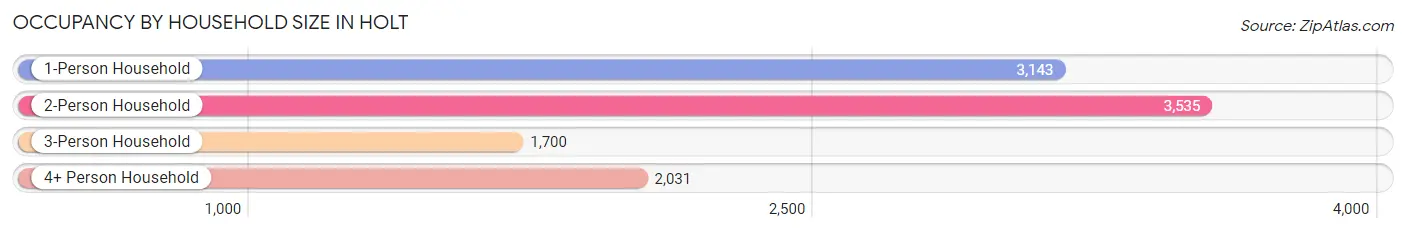
| Household Size | # Housing Units | % Housing Units |
| 1-Person Household | 3,143 | 30.2% |
| 2-Person Household | 3,535 | 34.0% |
| 3-Person Household | 1,700 | 16.3% |
| 4+ Person Household | 2,031 | 19.5% |
| Total Housing Units | 10,409 | 100.0% |
Occupancy by Ownership by Household Size in Holt
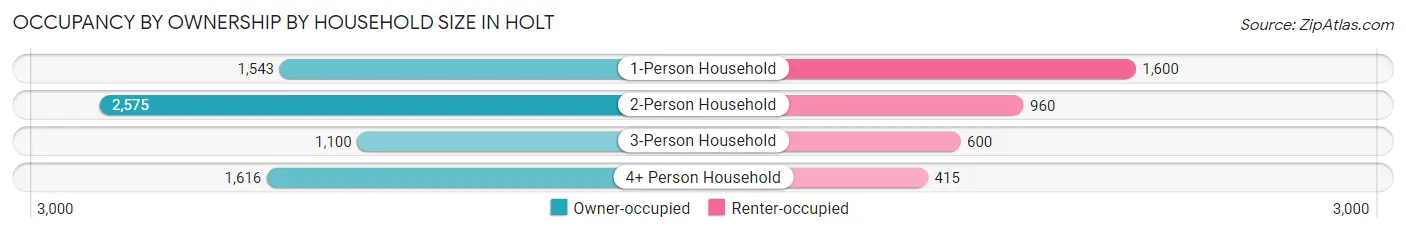
| Household Size | Owner-occupied | Renter-occupied |
| 1-Person Household | 1,543 (49.1%) | 1,600 (50.9%) |
| 2-Person Household | 2,575 (72.8%) | 960 (27.2%) |
| 3-Person Household | 1,100 (64.7%) | 600 (35.3%) |
| 4+ Person Household | 1,616 (79.6%) | 415 (20.4%) |
| Total Housing Units | 6,834 (65.6%) | 3,575 (34.4%) |
Occupancy by Educational Attainment in Holt
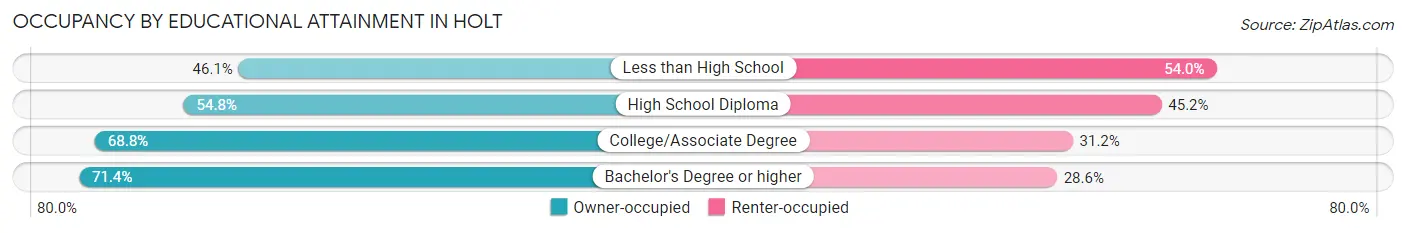
| Household Size | Owner-occupied | Renter-occupied |
| Less than High School | 309 (46.1%) | 362 (53.9%) |
| High School Diploma | 1,120 (54.8%) | 925 (45.2%) |
| College/Associate Degree | 2,311 (68.8%) | 1,046 (31.2%) |
| Bachelor's Degree or higher | 3,094 (71.4%) | 1,242 (28.6%) |
Occupancy by Age of Householder in Holt
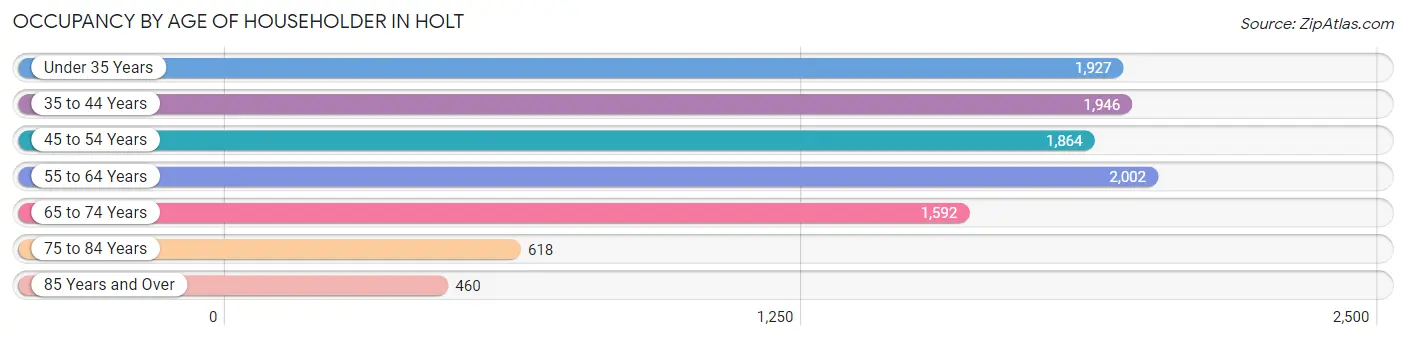
| Age Bracket | # Households | % Households |
| Under 35 Years | 1,927 | 18.5% |
| 35 to 44 Years | 1,946 | 18.7% |
| 45 to 54 Years | 1,864 | 17.9% |
| 55 to 64 Years | 2,002 | 19.2% |
| 65 to 74 Years | 1,592 | 15.3% |
| 75 to 84 Years | 618 | 5.9% |
| 85 Years and Over | 460 | 4.4% |
| Total | 10,409 | 100.0% |
Housing Finances in Holt
Median Income by Occupancy in Holt
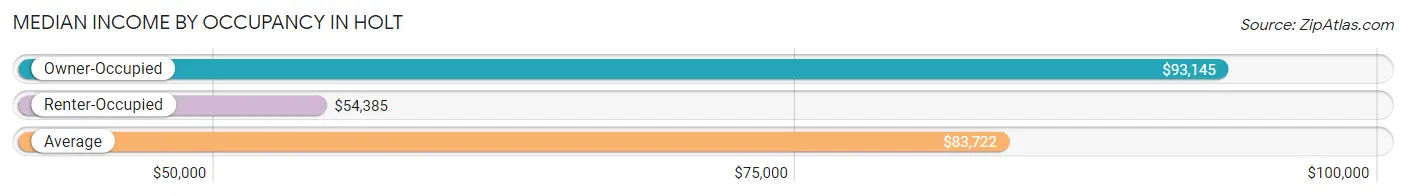
| Occupancy Type | # Households | Median Income |
| Owner-Occupied | 6,834 (65.6%) | $93,145 |
| Renter-Occupied | 3,575 (34.4%) | $54,385 |
| Average | 10,409 (100.0%) | $83,722 |
Occupancy by Householder Income Bracket in Holt
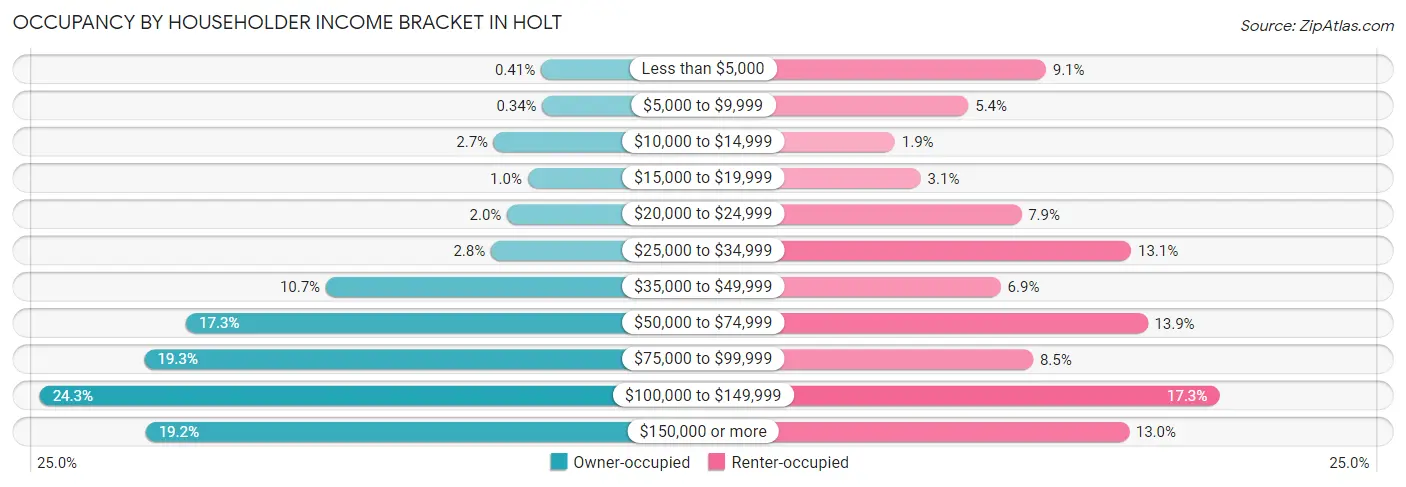
| Income Bracket | Owner-occupied | Renter-occupied |
| Less than $5,000 | 28 (0.4%) | 324 (9.1%) |
| $5,000 to $9,999 | 23 (0.3%) | 192 (5.4%) |
| $10,000 to $14,999 | 181 (2.6%) | 67 (1.9%) |
| $15,000 to $19,999 | 71 (1.0%) | 111 (3.1%) |
| $20,000 to $24,999 | 138 (2.0%) | 282 (7.9%) |
| $25,000 to $34,999 | 191 (2.8%) | 469 (13.1%) |
| $35,000 to $49,999 | 728 (10.6%) | 247 (6.9%) |
| $50,000 to $74,999 | 1,183 (17.3%) | 497 (13.9%) |
| $75,000 to $99,999 | 1,318 (19.3%) | 302 (8.5%) |
| $100,000 to $149,999 | 1,659 (24.3%) | 619 (17.3%) |
| $150,000 or more | 1,314 (19.2%) | 465 (13.0%) |
| Total | 6,834 (100.0%) | 3,575 (100.0%) |
Monthly Housing Cost Tiers in Holt
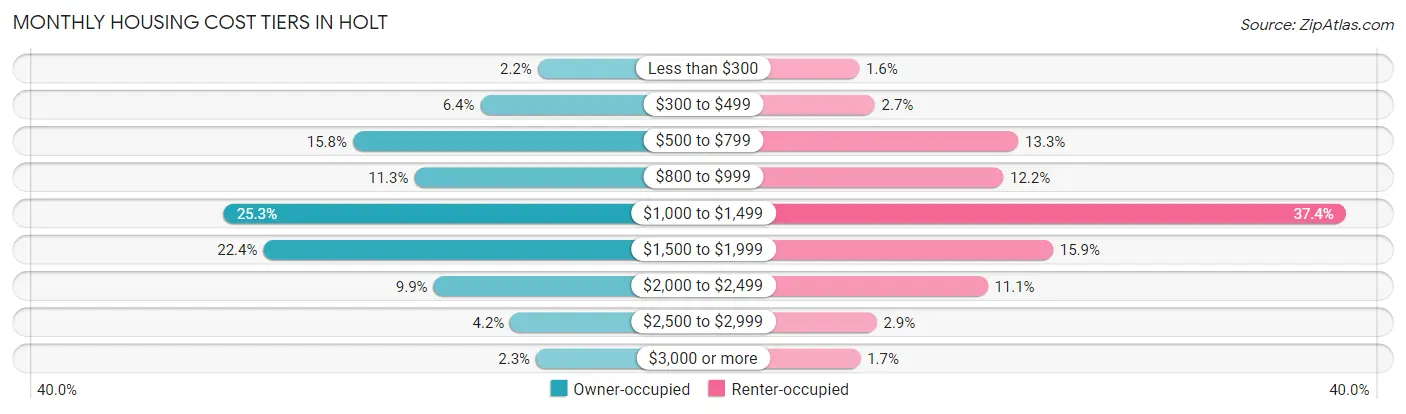
| Monthly Cost | Owner-occupied | Renter-occupied |
| Less than $300 | 151 (2.2%) | 57 (1.6%) |
| $300 to $499 | 440 (6.4%) | 98 (2.7%) |
| $500 to $799 | 1,082 (15.8%) | 476 (13.3%) |
| $800 to $999 | 772 (11.3%) | 436 (12.2%) |
| $1,000 to $1,499 | 1,731 (25.3%) | 1,338 (37.4%) |
| $1,500 to $1,999 | 1,532 (22.4%) | 567 (15.9%) |
| $2,000 to $2,499 | 676 (9.9%) | 395 (11.1%) |
| $2,500 to $2,999 | 290 (4.2%) | 103 (2.9%) |
| $3,000 or more | 160 (2.3%) | 60 (1.7%) |
| Total | 6,834 (100.0%) | 3,575 (100.0%) |
Physical Housing Characteristics in Holt
Housing Structures in Holt
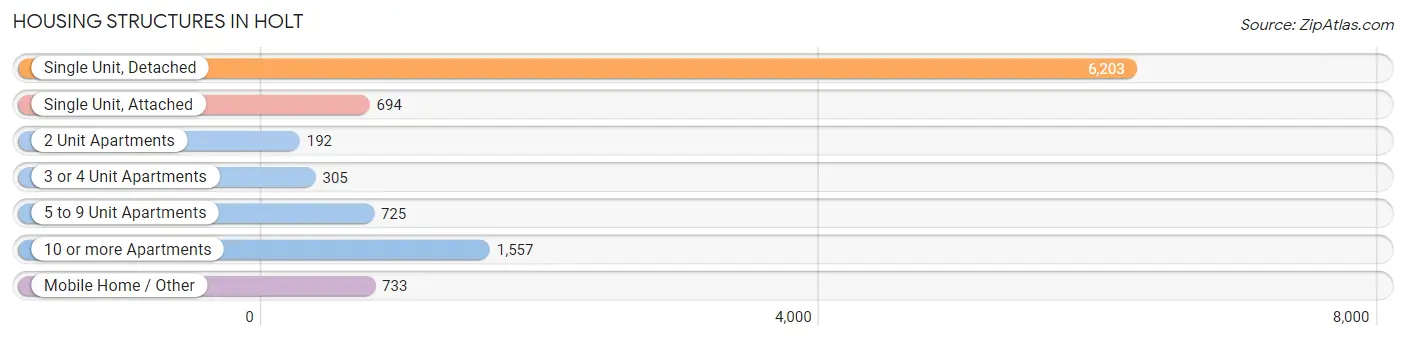
| Structure Type | # Housing Units | % Housing Units |
| Single Unit, Detached | 6,203 | 59.6% |
| Single Unit, Attached | 694 | 6.7% |
| 2 Unit Apartments | 192 | 1.8% |
| 3 or 4 Unit Apartments | 305 | 2.9% |
| 5 to 9 Unit Apartments | 725 | 7.0% |
| 10 or more Apartments | 1,557 | 15.0% |
| Mobile Home / Other | 733 | 7.0% |
| Total | 10,409 | 100.0% |
Housing Structures by Occupancy in Holt
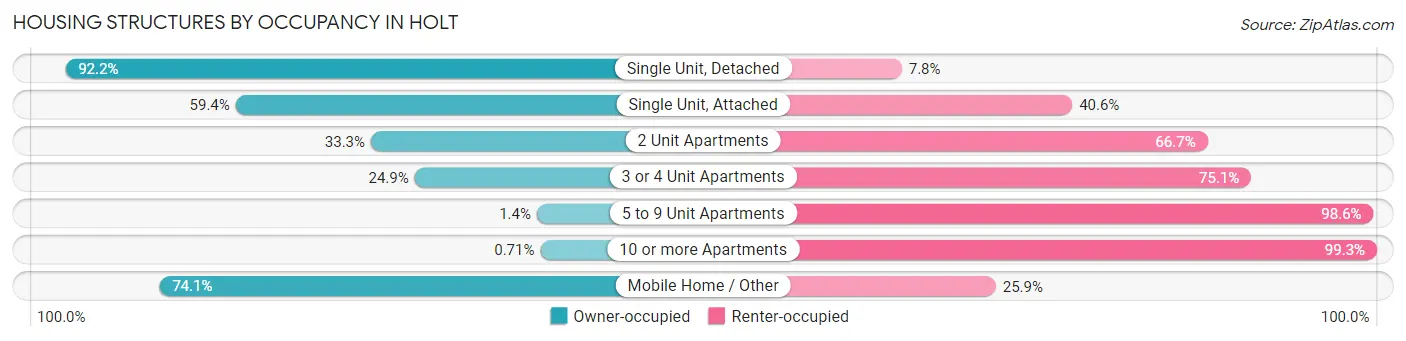
| Structure Type | Owner-occupied | Renter-occupied |
| Single Unit, Detached | 5,718 (92.2%) | 485 (7.8%) |
| Single Unit, Attached | 412 (59.4%) | 282 (40.6%) |
| 2 Unit Apartments | 64 (33.3%) | 128 (66.7%) |
| 3 or 4 Unit Apartments | 76 (24.9%) | 229 (75.1%) |
| 5 to 9 Unit Apartments | 10 (1.4%) | 715 (98.6%) |
| 10 or more Apartments | 11 (0.7%) | 1,546 (99.3%) |
| Mobile Home / Other | 543 (74.1%) | 190 (25.9%) |
| Total | 6,834 (65.6%) | 3,575 (34.4%) |
Housing Structures by Number of Rooms in Holt
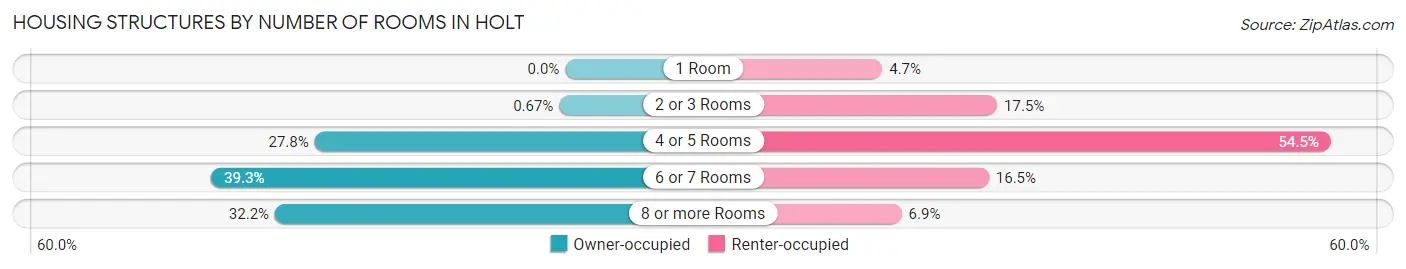
| Number of Rooms | Owner-occupied | Renter-occupied |
| 1 Room | 0 (0.0%) | 168 (4.7%) |
| 2 or 3 Rooms | 46 (0.7%) | 624 (17.4%) |
| 4 or 5 Rooms | 1,901 (27.8%) | 1,947 (54.5%) |
| 6 or 7 Rooms | 2,685 (39.3%) | 591 (16.5%) |
| 8 or more Rooms | 2,202 (32.2%) | 245 (6.9%) |
| Total | 6,834 (100.0%) | 3,575 (100.0%) |
Housing Structure by Heating Type in Holt
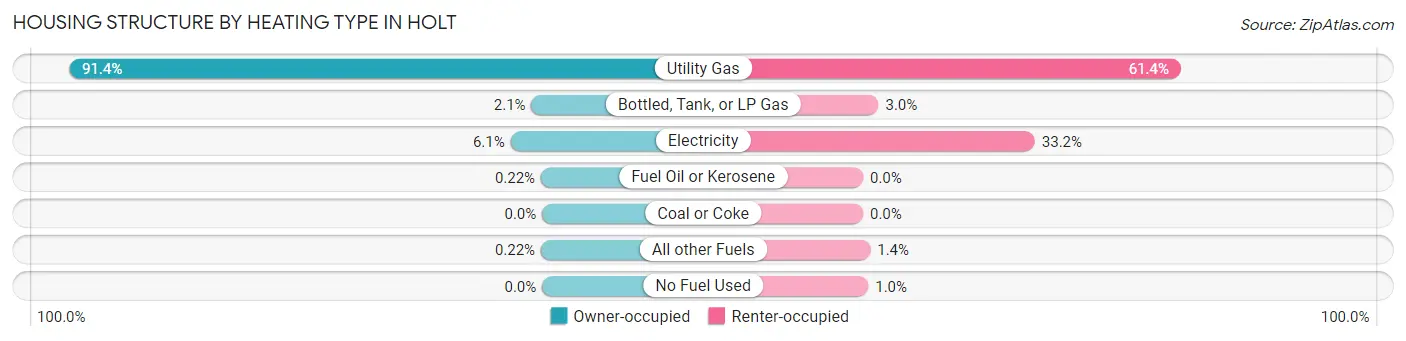
| Heating Type | Owner-occupied | Renter-occupied |
| Utility Gas | 6,247 (91.4%) | 2,195 (61.4%) |
| Bottled, Tank, or LP Gas | 141 (2.1%) | 107 (3.0%) |
| Electricity | 416 (6.1%) | 1,187 (33.2%) |
| Fuel Oil or Kerosene | 15 (0.2%) | 0 (0.0%) |
| Coal or Coke | 0 (0.0%) | 0 (0.0%) |
| All other Fuels | 15 (0.2%) | 50 (1.4%) |
| No Fuel Used | 0 (0.0%) | 36 (1.0%) |
| Total | 6,834 (100.0%) | 3,575 (100.0%) |
Household Vehicle Usage in Holt
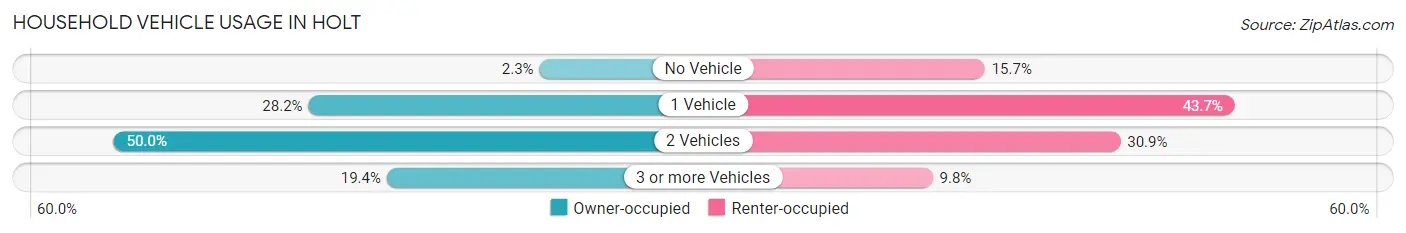
| Vehicles per Household | Owner-occupied | Renter-occupied |
| No Vehicle | 159 (2.3%) | 560 (15.7%) |
| 1 Vehicle | 1,928 (28.2%) | 1,561 (43.7%) |
| 2 Vehicles | 3,419 (50.0%) | 1,103 (30.8%) |
| 3 or more Vehicles | 1,328 (19.4%) | 351 (9.8%) |
| Total | 6,834 (100.0%) | 3,575 (100.0%) |
Real Estate & Mortgages in Holt
Real Estate and Mortgage Overview in Holt
| Characteristic | Without Mortgage | With Mortgage |
| Housing Units | 2,363 | 4,471 |
| Median Property Value | $154,300 | $211,100 |
| Median Household Income | $76,458 | $1,100 |
| Monthly Housing Costs | $695 | $160 |
| Real Estate Taxes | $3,508 | $33 |
Property Value by Mortgage Status in Holt
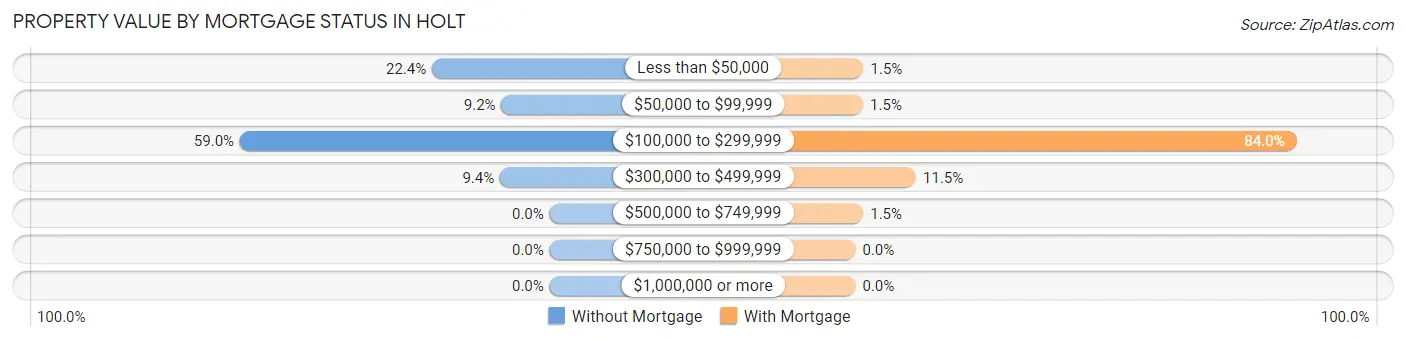
| Property Value | Without Mortgage | With Mortgage |
| Less than $50,000 | 529 (22.4%) | 69 (1.5%) |
| $50,000 to $99,999 | 217 (9.2%) | 65 (1.5%) |
| $100,000 to $299,999 | 1,394 (59.0%) | 3,755 (84.0%) |
| $300,000 to $499,999 | 223 (9.4%) | 516 (11.5%) |
| $500,000 to $749,999 | 0 (0.0%) | 66 (1.5%) |
| $750,000 to $999,999 | 0 (0.0%) | 0 (0.0%) |
| $1,000,000 or more | 0 (0.0%) | 0 (0.0%) |
| Total | 2,363 (100.0%) | 4,471 (100.0%) |
Household Income by Mortgage Status in Holt
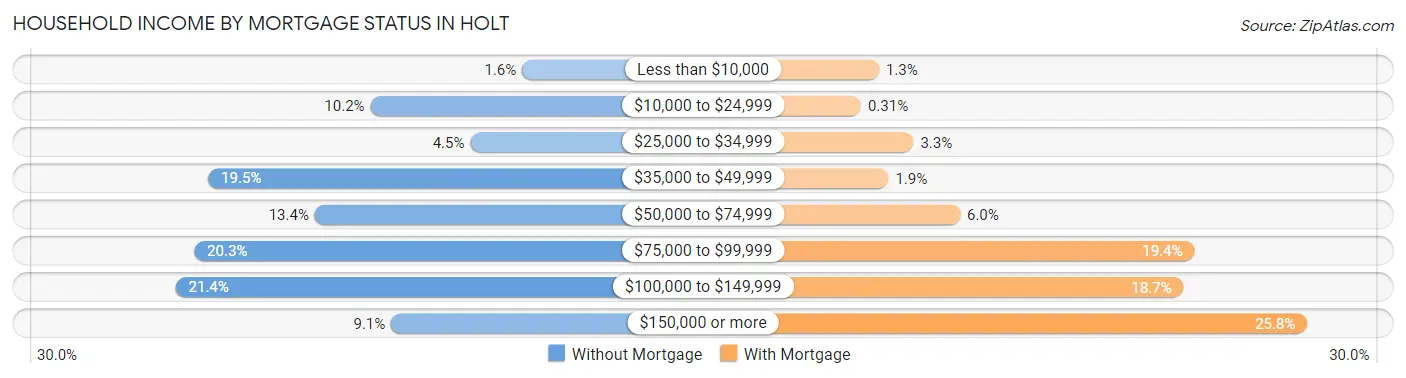
| Household Income | Without Mortgage | With Mortgage |
| Less than $10,000 | 37 (1.6%) | 60 (1.3%) |
| $10,000 to $24,999 | 242 (10.2%) | 14 (0.3%) |
| $25,000 to $34,999 | 107 (4.5%) | 148 (3.3%) |
| $35,000 to $49,999 | 461 (19.5%) | 84 (1.9%) |
| $50,000 to $74,999 | 317 (13.4%) | 267 (6.0%) |
| $75,000 to $99,999 | 480 (20.3%) | 866 (19.4%) |
| $100,000 to $149,999 | 505 (21.4%) | 838 (18.7%) |
| $150,000 or more | 214 (9.1%) | 1,154 (25.8%) |
| Total | 2,363 (100.0%) | 4,471 (100.0%) |
Property Value to Household Income Ratio in Holt
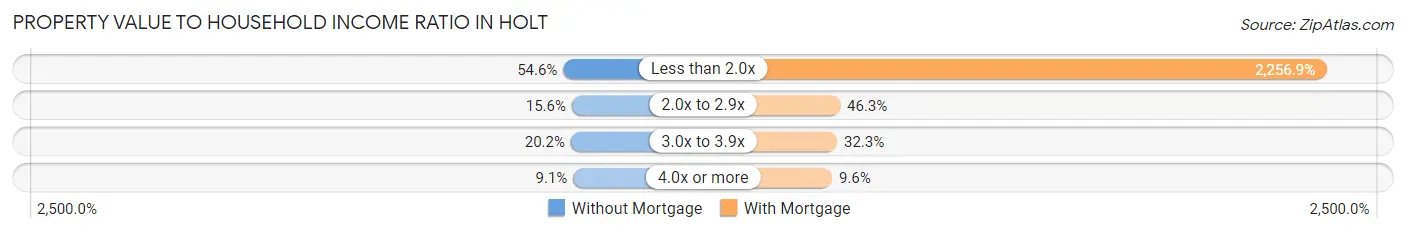
| Value-to-Income Ratio | Without Mortgage | With Mortgage |
| Less than 2.0x | 1,291 (54.6%) | 100,907 (2,256.9%) |
| 2.0x to 2.9x | 368 (15.6%) | 2,069 (46.3%) |
| 3.0x to 3.9x | 477 (20.2%) | 1,442 (32.3%) |
| 4.0x or more | 216 (9.1%) | 431 (9.6%) |
| Total | 2,363 (100.0%) | 4,471 (100.0%) |
Real Estate Taxes by Mortgage Status in Holt
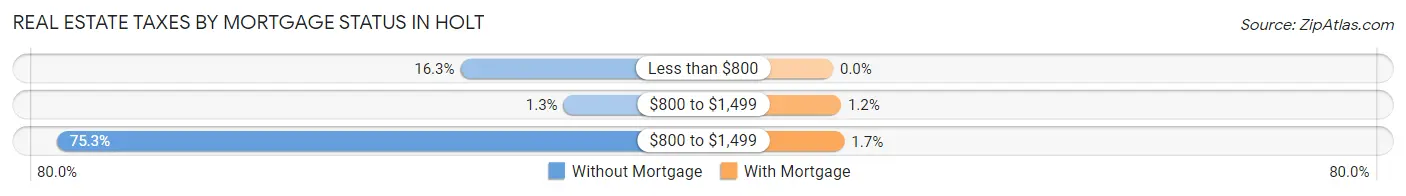
| Property Taxes | Without Mortgage | With Mortgage |
| Less than $800 | 386 (16.3%) | 0 (0.0%) |
| $800 to $1,499 | 30 (1.3%) | 52 (1.2%) |
| $800 to $1,499 | 1,779 (75.3%) | 74 (1.7%) |
| Total | 2,363 (100.0%) | 4,471 (100.0%) |
Health & Disability in Holt
Health Insurance Coverage by Age in Holt
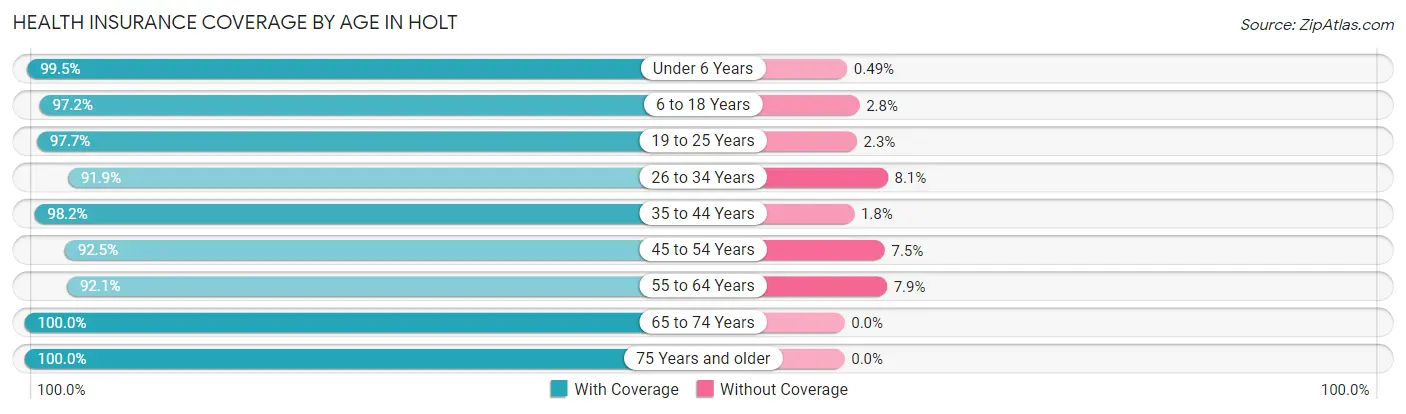
| Age Bracket | With Coverage | Without Coverage |
| Under 6 Years | 1,623 (99.5%) | 8 (0.5%) |
| 6 to 18 Years | 4,168 (97.2%) | 119 (2.8%) |
| 19 to 25 Years | 2,332 (97.7%) | 55 (2.3%) |
| 26 to 34 Years | 2,613 (91.9%) | 229 (8.1%) |
| 35 to 44 Years | 3,532 (98.2%) | 65 (1.8%) |
| 45 to 54 Years | 2,993 (92.5%) | 243 (7.5%) |
| 55 to 64 Years | 2,841 (92.1%) | 244 (7.9%) |
| 65 to 74 Years | 2,698 (100.0%) | 0 (0.0%) |
| 75 Years and older | 1,489 (100.0%) | 0 (0.0%) |
| Total | 24,289 (96.2%) | 963 (3.8%) |
Health Insurance Coverage by Citizenship Status in Holt
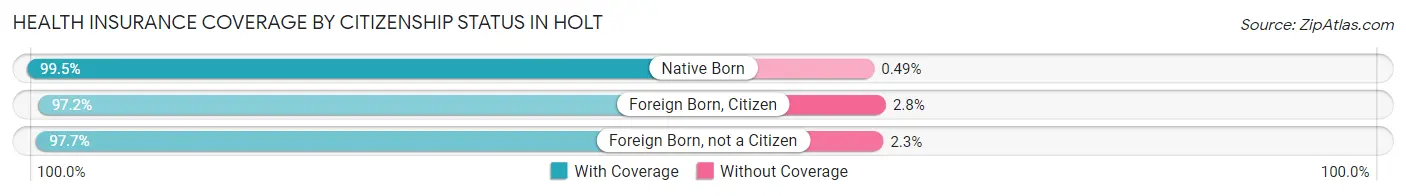
| Citizenship Status | With Coverage | Without Coverage |
| Native Born | 1,623 (99.5%) | 8 (0.5%) |
| Foreign Born, Citizen | 4,168 (97.2%) | 119 (2.8%) |
| Foreign Born, not a Citizen | 2,332 (97.7%) | 55 (2.3%) |
Health Insurance Coverage by Household Income in Holt
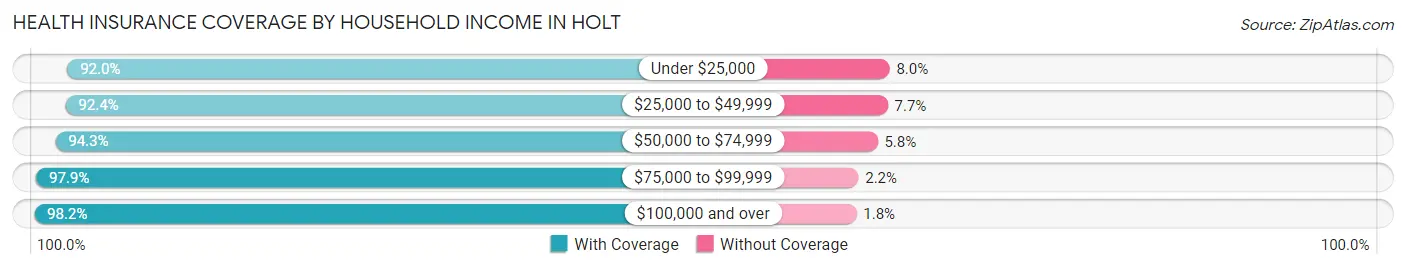
| Household Income | With Coverage | Without Coverage |
| Under $25,000 | 2,107 (92.0%) | 183 (8.0%) |
| $25,000 to $49,999 | 3,139 (92.3%) | 260 (7.6%) |
| $50,000 to $74,999 | 3,721 (94.3%) | 227 (5.8%) |
| $75,000 to $99,999 | 3,464 (97.9%) | 76 (2.1%) |
| $100,000 and over | 11,819 (98.2%) | 216 (1.8%) |
Public vs Private Health Insurance Coverage by Age in Holt
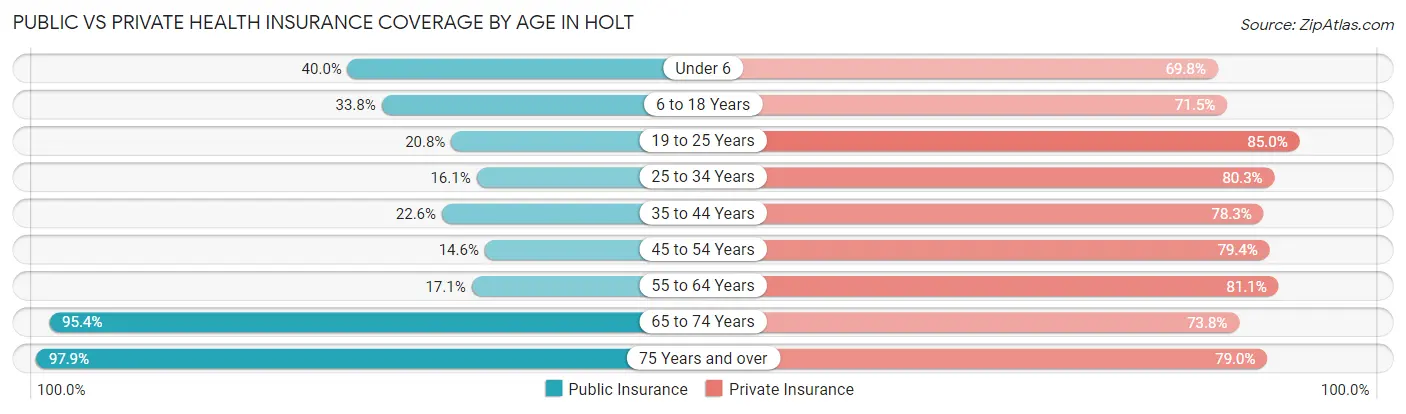
| Age Bracket | Public Insurance | Private Insurance |
| Under 6 | 653 (40.0%) | 1,138 (69.8%) |
| 6 to 18 Years | 1,447 (33.8%) | 3,066 (71.5%) |
| 19 to 25 Years | 497 (20.8%) | 2,028 (85.0%) |
| 25 to 34 Years | 458 (16.1%) | 2,282 (80.3%) |
| 35 to 44 Years | 811 (22.6%) | 2,816 (78.3%) |
| 45 to 54 Years | 472 (14.6%) | 2,570 (79.4%) |
| 55 to 64 Years | 526 (17.1%) | 2,501 (81.1%) |
| 65 to 74 Years | 2,575 (95.4%) | 1,990 (73.8%) |
| 75 Years and over | 1,458 (97.9%) | 1,176 (79.0%) |
| Total | 8,897 (35.2%) | 19,567 (77.5%) |
Disability Status by Sex by Age in Holt
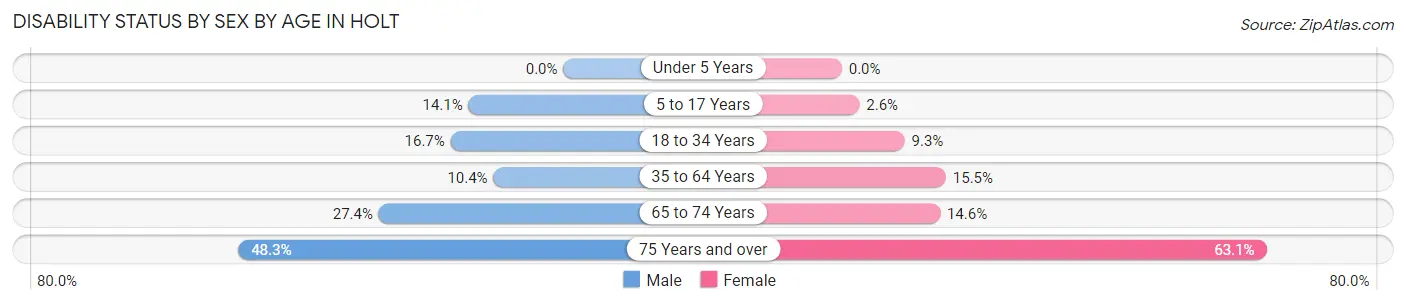
| Age Bracket | Male | Female |
| Under 5 Years | 0 (0.0%) | 0 (0.0%) |
| 5 to 17 Years | 321 (14.1%) | 53 (2.6%) |
| 18 to 34 Years | 471 (16.7%) | 245 (9.3%) |
| 35 to 64 Years | 494 (10.4%) | 797 (15.4%) |
| 65 to 74 Years | 358 (27.4%) | 203 (14.6%) |
| 75 Years and over | 251 (48.3%) | 611 (63.0%) |
Disability Class by Sex by Age in Holt
Disability Class: Hearing Difficulty
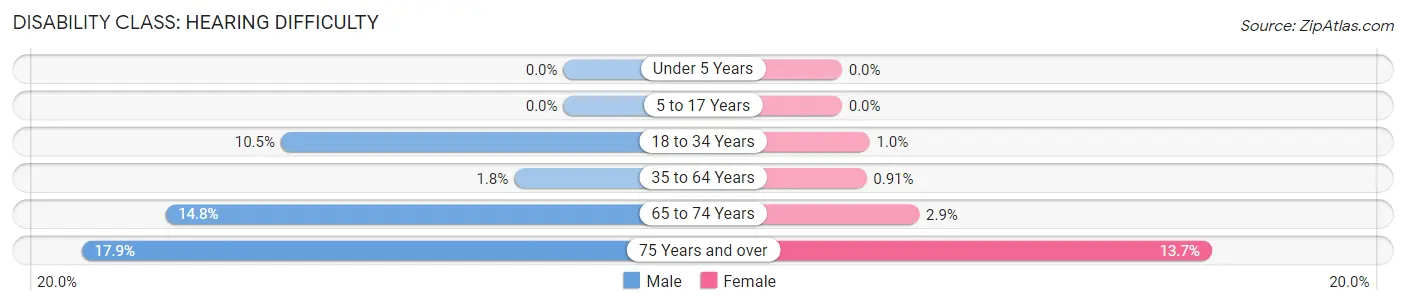
| Age Bracket | Male | Female |
| Under 5 Years | 0 (0.0%) | 0 (0.0%) |
| 5 to 17 Years | 0 (0.0%) | 0 (0.0%) |
| 18 to 34 Years | 295 (10.5%) | 27 (1.0%) |
| 35 to 64 Years | 87 (1.8%) | 47 (0.9%) |
| 65 to 74 Years | 193 (14.8%) | 40 (2.9%) |
| 75 Years and over | 93 (17.9%) | 133 (13.7%) |
Disability Class: Vision Difficulty
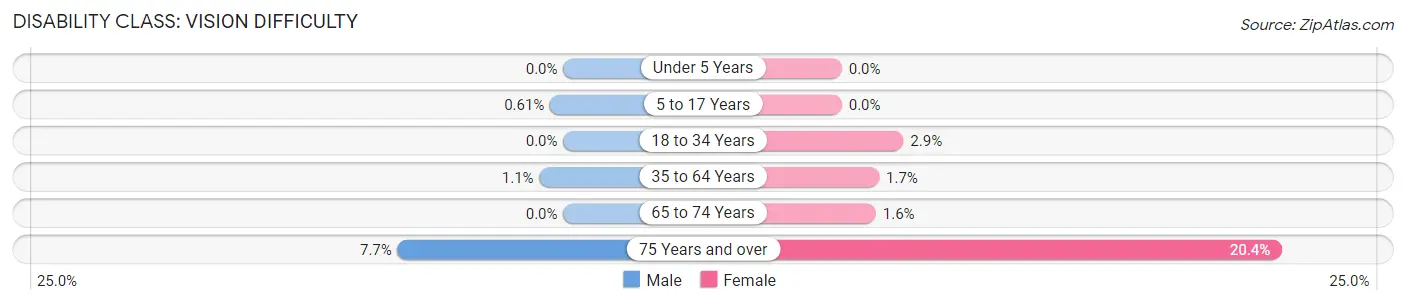
| Age Bracket | Male | Female |
| Under 5 Years | 0 (0.0%) | 0 (0.0%) |
| 5 to 17 Years | 14 (0.6%) | 0 (0.0%) |
| 18 to 34 Years | 0 (0.0%) | 75 (2.9%) |
| 35 to 64 Years | 53 (1.1%) | 89 (1.7%) |
| 65 to 74 Years | 0 (0.0%) | 22 (1.6%) |
| 75 Years and over | 40 (7.7%) | 198 (20.4%) |
Disability Class: Cognitive Difficulty
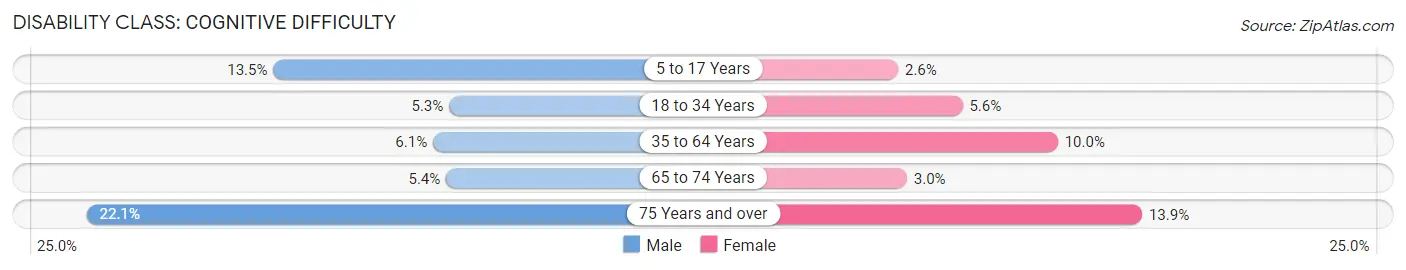
| Age Bracket | Male | Female |
| 5 to 17 Years | 307 (13.5%) | 53 (2.6%) |
| 18 to 34 Years | 149 (5.3%) | 147 (5.6%) |
| 35 to 64 Years | 288 (6.0%) | 517 (10.0%) |
| 65 to 74 Years | 71 (5.4%) | 42 (3.0%) |
| 75 Years and over | 115 (22.1%) | 135 (13.9%) |
Disability Class: Ambulatory Difficulty
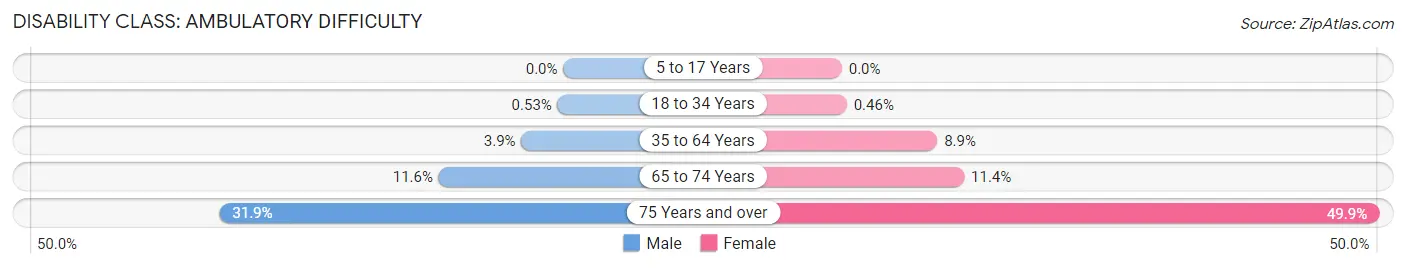
| Age Bracket | Male | Female |
| 5 to 17 Years | 0 (0.0%) | 0 (0.0%) |
| 18 to 34 Years | 15 (0.5%) | 12 (0.5%) |
| 35 to 64 Years | 185 (3.9%) | 457 (8.9%) |
| 65 to 74 Years | 151 (11.6%) | 158 (11.4%) |
| 75 Years and over | 166 (31.9%) | 483 (49.8%) |
Disability Class: Self-Care Difficulty
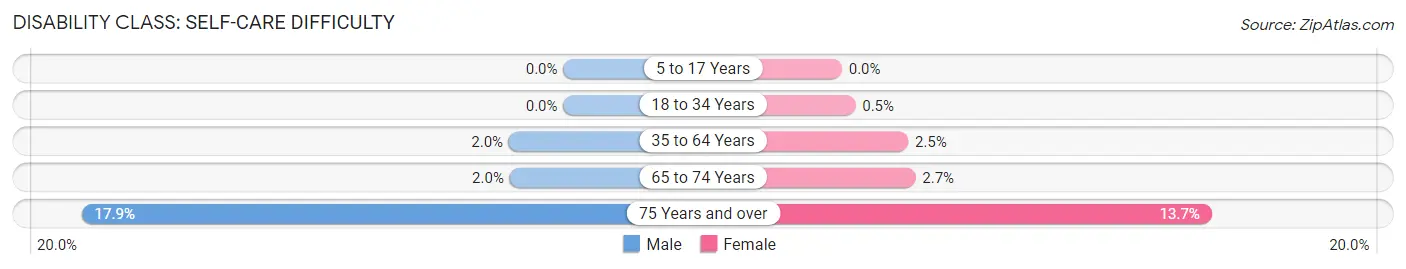
| Age Bracket | Male | Female |
| 5 to 17 Years | 0 (0.0%) | 0 (0.0%) |
| 18 to 34 Years | 0 (0.0%) | 13 (0.5%) |
| 35 to 64 Years | 96 (2.0%) | 127 (2.5%) |
| 65 to 74 Years | 26 (2.0%) | 38 (2.7%) |
| 75 Years and over | 93 (17.9%) | 133 (13.7%) |
Technology Access in Holt
Computing Device Access in Holt

| Device Type | # Households | % Households |
| Desktop or Laptop | 8,319 | 79.9% |
| Smartphone | 9,156 | 88.0% |
| Tablet | 6,747 | 64.8% |
| No Computing Device | 927 | 8.9% |
| Total | 10,409 | 100.0% |
Internet Access in Holt
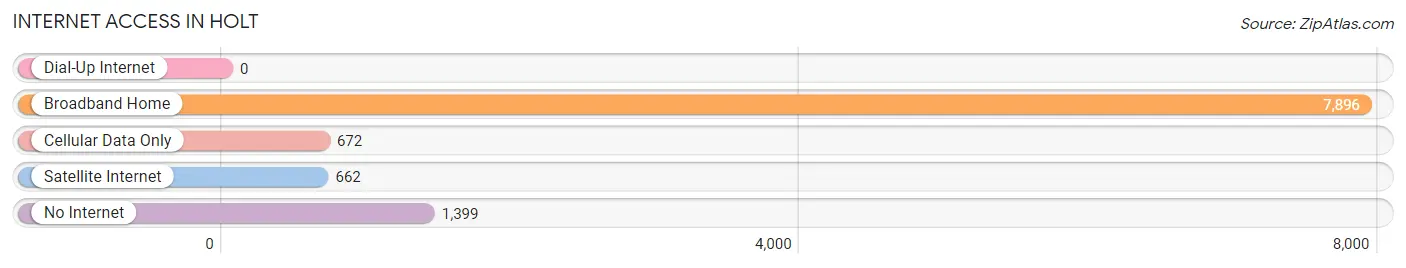
| Internet Type | # Households | % Households |
| Dial-Up Internet | 0 | 0.0% |
| Broadband Home | 7,896 | 75.9% |
| Cellular Data Only | 672 | 6.5% |
| Satellite Internet | 662 | 6.4% |
| No Internet | 1,399 | 13.4% |
| Total | 10,409 | 100.0% |
Holt Summary
Holt, Michigan is a small city located in Ingham County, Michigan. It is part of the Lansing-East Lansing Metropolitan Statistical Area. The city has a population of approximately 8,000 people and is located about 10 miles west of Lansing.
History
Holt was first settled in 1836 by a group of settlers from New York. The settlement was originally called Dryden, but was later changed to Holt in honor of a local landowner, William Holt. The city was incorporated in 1871 and has since grown to become a thriving community.
Geography
Holt is located in the central part of Michigan, about 10 miles west of Lansing. The city is situated on the banks of the Grand River and is surrounded by rolling hills and farmland. The city has a total area of 8.2 square miles, of which 8.1 square miles is land and 0.1 square miles is water.
Economy
Holt is home to a variety of businesses and industries. The city is home to several manufacturing companies, including a paper mill, a plastics plant, and a metal fabrication plant. The city also has a number of retail stores, restaurants, and other businesses. The city is also home to a number of educational institutions, including Michigan State University, Lansing Community College, and Lansing Community College.
Demographics
As of the 2010 census, Holt had a population of 8,000 people. The racial makeup of the city was 87.3% White, 6.2% African American, 0.7% Native American, 1.2% Asian, 0.1% Pacific Islander, 1.7% from other races, and 2.9% from two or more races. Hispanic or Latino of any race were 4.2% of the population.
The median income for a household in Holt was $50,945, and the median income for a family was $60,945. The per capita income for the city was $22,945. About 6.2% of families and 8.2% of the population were below the poverty line, including 10.2% of those under age 18 and 6.2% of those age 65 or over.
Holt is a small city with a rich history and a vibrant economy. The city is home to a variety of businesses and industries, as well as educational institutions. The city has a diverse population and a strong sense of community. Holt is a great place to live, work, and play.
Common Questions
What is Per Capita Income in Holt?
Per Capita income in Holt is $40,862.
What is the Median Family Income in Holt?
Median Family Income in Holt is $99,660.
What is the Median Household income in Holt?
Median Household Income in Holt is $83,722.
What is Income or Wage Gap in Holt?
Income or Wage Gap in Holt is 25.5%.
Women in Holt earn 74.5 cents for every dollar earned by a man.
What is Family Income Deficit in Holt?
Family Income Deficit in Holt is $8,525.
Families that are below poverty line in Holt earn $8,525 less on average than the poverty threshold level.
What is Inequality or Gini Index in Holt?
Inequality or Gini Index in Holt is 0.41.
What is the Total Population of Holt?
Total Population of Holt is 25,374.
What is the Total Male Population of Holt?
Total Male Population of Holt is 12,259.
What is the Total Female Population of Holt?
Total Female Population of Holt is 13,115.
What is the Ratio of Males per 100 Females in Holt?
There are 93.47 Males per 100 Females in Holt.
What is the Ratio of Females per 100 Males in Holt?
There are 106.98 Females per 100 Males in Holt.
What is the Median Population Age in Holt?
Median Population Age in Holt is 38.1 Years.
What is the Average Family Size in Holt
Average Family Size in Holt is 3.0 People.
What is the Average Household Size in Holt
Average Household Size in Holt is 2.4 People.
How Large is the Labor Force in Holt?
There are 14,043 People in the Labor Forcein in Holt.
What is the Percentage of People in the Labor Force in Holt?
69.2% of People are in the Labor Force in Holt.
What is the Unemployment Rate in Holt?
Unemployment Rate in Holt is 5.5%.