Otsego, MI Map & Demographics
Otsego Map
Otsego Overview
$29,059
PER CAPITA INCOME
$77,591
AVG FAMILY INCOME
$68,490
AVG HOUSEHOLD INCOME
54.2%
WAGE / INCOME GAP [ % ]
45.8¢/ $1
WAGE / INCOME GAP [ $ ]
0.37
INEQUALITY / GINI INDEX
4,083
TOTAL POPULATION
1,778
MALE POPULATION
2,305
FEMALE POPULATION
77.14
MALES / 100 FEMALES
129.64
FEMALES / 100 MALES
40.1
MEDIAN AGE
2.9
AVG FAMILY SIZE
2.5
AVG HOUSEHOLD SIZE
1,889
LABOR FORCE [ PEOPLE ]
57.7%
PERCENT IN LABOR FORCE
7.8%
UNEMPLOYMENT RATE
Otsego Zip Codes
Otsego Area Codes
Income in Otsego
Income Overview in Otsego
Per Capita Income in Otsego is $29,059, while median incomes of families and households are $77,591 and $68,490 respectively.
| Characteristic | Number | Measure |
| Per Capita Income | 4,083 | $29,059 |
| Median Family Income | 1,169 | $77,591 |
| Mean Family Income | 1,169 | $98,098 |
| Median Household Income | 1,641 | $68,490 |
| Mean Household Income | 1,641 | $84,170 |
| Income Deficit | 1,169 | $0 |
| Wage / Income Gap (%) | 4,083 | 54.18% |
| Wage / Income Gap ($) | 4,083 | 45.82¢ per $1 |
| Gini / Inequality Index | 4,083 | 0.37 |
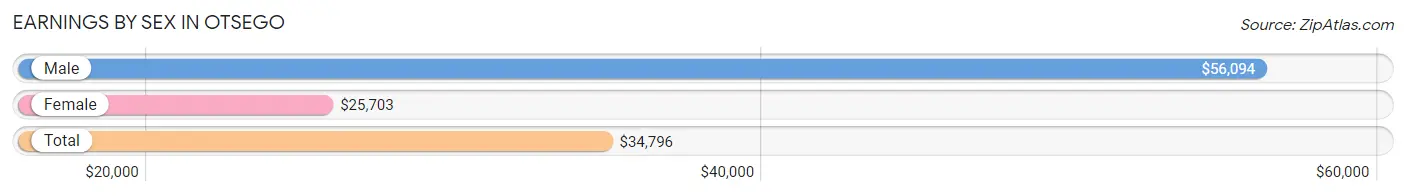
Earnings by Sex in Otsego
Average Earnings in Otsego are $34,796, $56,094 for men and $25,703 for women, a difference of 54.2%.
| Sex | Number | Average Earnings |
| Male | 958 (48.7%) | $56,094 |
| Female | 1,009 (51.3%) | $25,703 |
| Total | 1,967 (100.0%) | $34,796 |
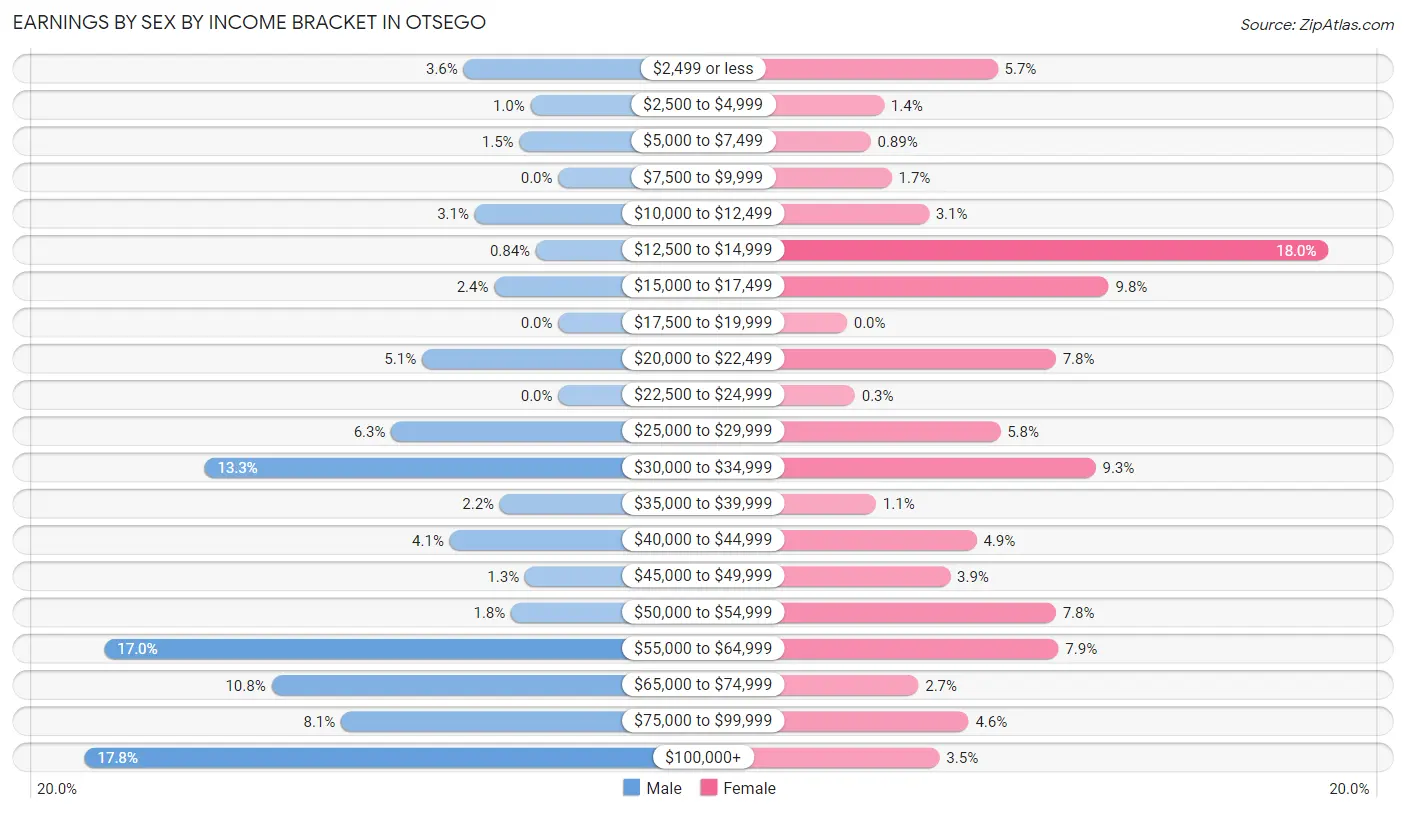
Earnings by Sex by Income Bracket in Otsego
The most common earnings brackets in Otsego are $100,000+ for men (170 | 17.7%) and $12,500 to $14,999 for women (182 | 18.0%).
| Income | Male | Female |
| $2,499 or less | 34 (3.5%) | 57 (5.7%) |
| $2,500 to $4,999 | 10 (1.0%) | 14 (1.4%) |
| $5,000 to $7,499 | 14 (1.5%) | 9 (0.9%) |
| $7,500 to $9,999 | 0 (0.0%) | 17 (1.7%) |
| $10,000 to $12,499 | 30 (3.1%) | 31 (3.1%) |
| $12,500 to $14,999 | 8 (0.8%) | 182 (18.0%) |
| $15,000 to $17,499 | 23 (2.4%) | 99 (9.8%) |
| $17,500 to $19,999 | 0 (0.0%) | 0 (0.0%) |
| $20,000 to $22,499 | 49 (5.1%) | 79 (7.8%) |
| $22,500 to $24,999 | 0 (0.0%) | 3 (0.3%) |
| $25,000 to $29,999 | 60 (6.3%) | 58 (5.8%) |
| $30,000 to $34,999 | 127 (13.3%) | 94 (9.3%) |
| $35,000 to $39,999 | 21 (2.2%) | 11 (1.1%) |
| $40,000 to $44,999 | 39 (4.1%) | 49 (4.9%) |
| $45,000 to $49,999 | 12 (1.3%) | 39 (3.9%) |
| $50,000 to $54,999 | 17 (1.8%) | 79 (7.8%) |
| $55,000 to $64,999 | 163 (17.0%) | 80 (7.9%) |
| $65,000 to $74,999 | 103 (10.7%) | 27 (2.7%) |
| $75,000 to $99,999 | 78 (8.1%) | 46 (4.6%) |
| $100,000+ | 170 (17.7%) | 35 (3.5%) |
| Total | 958 (100.0%) | 1,009 (100.0%) |
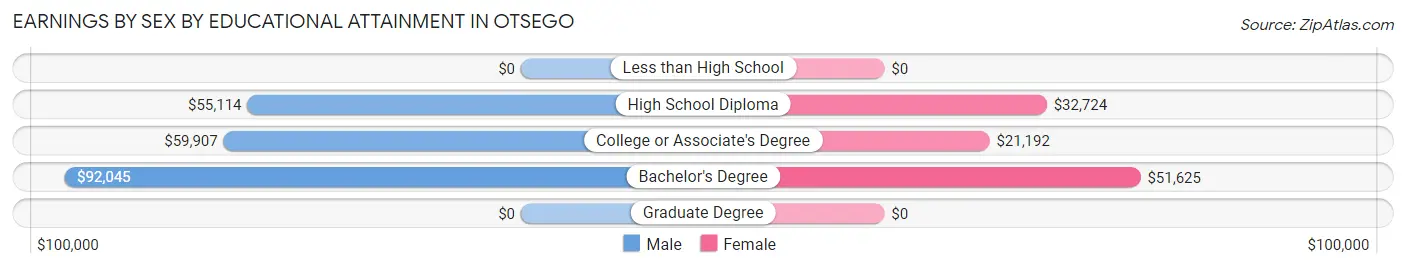
Earnings by Sex by Educational Attainment in Otsego
Average earnings in Otsego are $57,250 for men and $33,674 for women, a difference of 41.2%. Men with an educational attainment of bachelor's degree enjoy the highest average annual earnings of $92,045, while those with high school diploma education earn the least with $55,114. Women with an educational attainment of bachelor's degree earn the most with the average annual earnings of $51,625, while those with college or associate's degree education have the smallest earnings of $21,192.
| Educational Attainment | Male Income | Female Income |
| Less than High School | - | - |
| High School Diploma | $55,114 | $32,724 |
| College or Associate's Degree | $59,907 | $21,192 |
| Bachelor's Degree | $92,045 | $51,625 |
| Graduate Degree | - | - |
| Total | $57,250 | $33,674 |
Family Income in Otsego
Family Income Brackets in Otsego
According to the Otsego family income data, there are 375 families falling into the $50,000 to $74,999 income range, which is the most common income bracket and makes up 32.1% of all families.
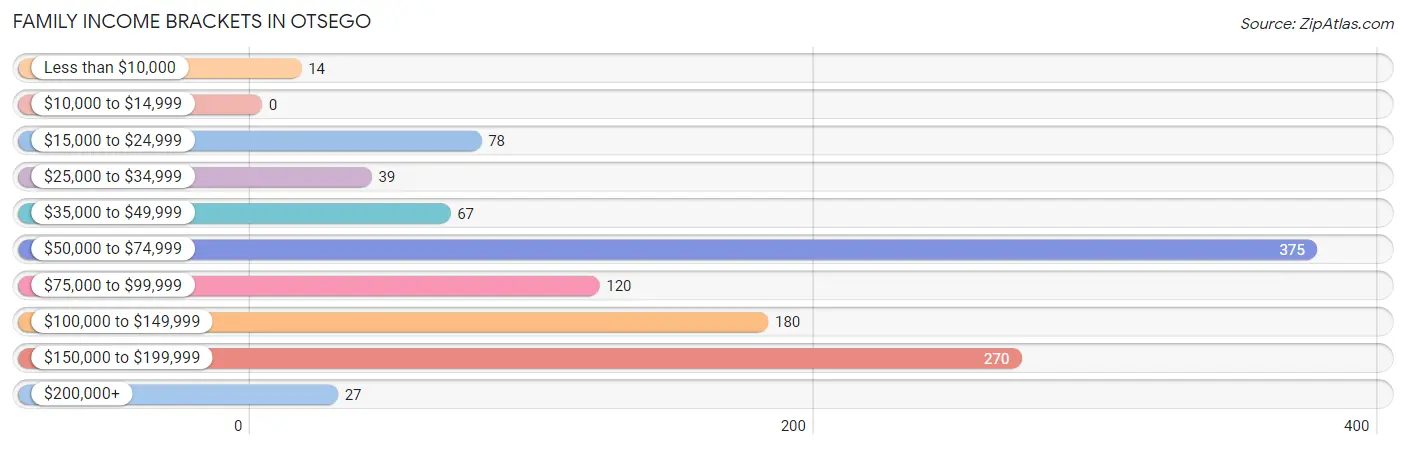
| Income Bracket | # Families | % Families |
| Less than $10,000 | 14 | 1.2% |
| $10,000 to $14,999 | 0 | 0.0% |
| $15,000 to $24,999 | 78 | 6.7% |
| $25,000 to $34,999 | 39 | 3.3% |
| $35,000 to $49,999 | 67 | 5.7% |
| $50,000 to $74,999 | 375 | 32.1% |
| $75,000 to $99,999 | 120 | 10.3% |
| $100,000 to $149,999 | 180 | 15.4% |
| $150,000 to $199,999 | 270 | 23.1% |
| $200,000+ | 27 | 2.3% |
Family Income by Famaliy Size in Otsego
4-person families (211 | 18.0%) account for the highest median family income in Otsego with $182,838 per family, while 4-person families (211 | 18.0%) have the highest median income of $45,710 per family member.
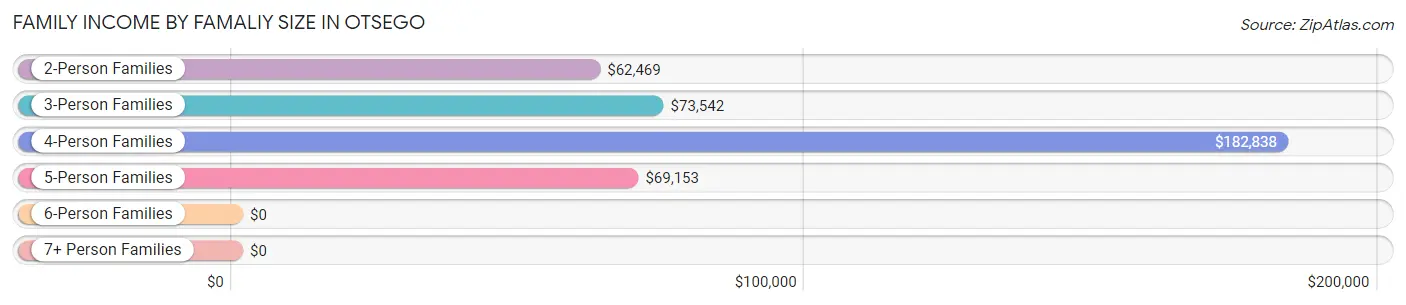
| Income Bracket | # Families | Median Income |
| 2-Person Families | 507 (43.4%) | $62,469 |
| 3-Person Families | 272 (23.3%) | $73,542 |
| 4-Person Families | 211 (18.0%) | $182,838 |
| 5-Person Families | 160 (13.7%) | $69,153 |
| 6-Person Families | 19 (1.6%) | $0 |
| 7+ Person Families | 0 (0.0%) | $0 |
| Total | 1,169 (100.0%) | $77,591 |
Family Income by Number of Earners in Otsego
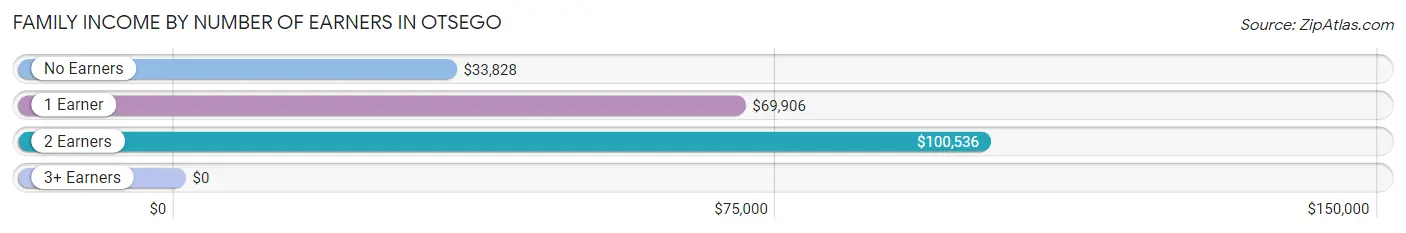
| Number of Earners | # Families | Median Income |
| No Earners | 131 (11.2%) | $33,828 |
| 1 Earner | 543 (46.5%) | $69,906 |
| 2 Earners | 414 (35.4%) | $100,536 |
| 3+ Earners | 81 (6.9%) | $0 |
| Total | 1,169 (100.0%) | $77,591 |
Household Income in Otsego
Household Income Brackets in Otsego
With 433 households falling in the category, the $50,000 to $74,999 income range is the most frequent in Otsego, accounting for 26.4% of all households. In contrast, only 26 households (1.6%) fall into the less than $10,000 income bracket, making it the least populous group.
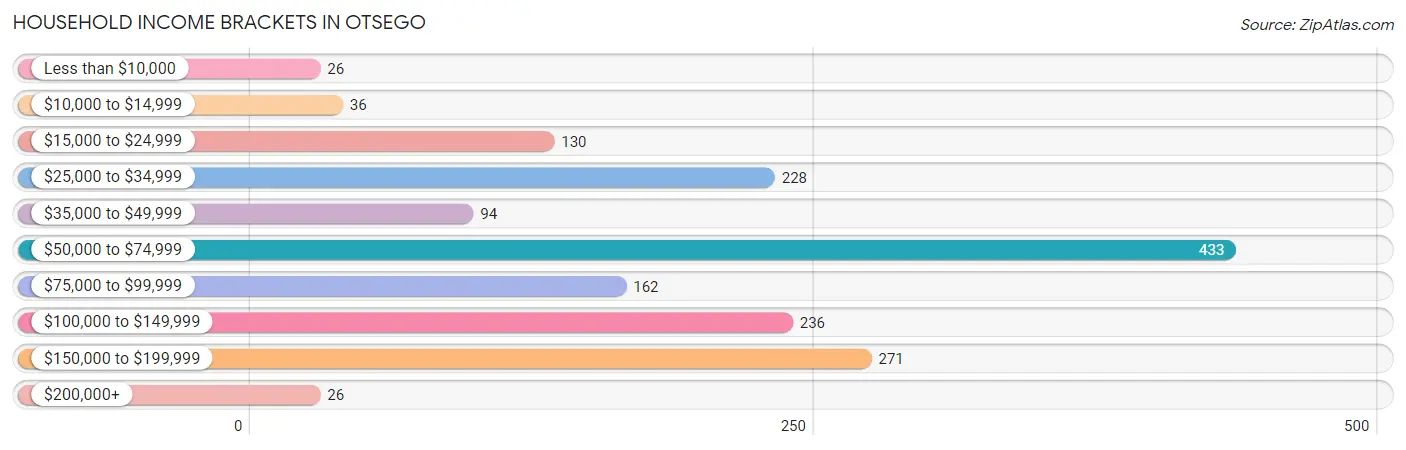
| Income Bracket | # Households | % Households |
| Less than $10,000 | 26 | 1.6% |
| $10,000 to $14,999 | 36 | 2.2% |
| $15,000 to $24,999 | 130 | 7.9% |
| $25,000 to $34,999 | 228 | 13.9% |
| $35,000 to $49,999 | 94 | 5.7% |
| $50,000 to $74,999 | 433 | 26.4% |
| $75,000 to $99,999 | 162 | 9.9% |
| $100,000 to $149,999 | 236 | 14.4% |
| $150,000 to $199,999 | 271 | 16.5% |
| $200,000+ | 26 | 1.6% |
Household Income by Householder Age in Otsego
The median household income in Otsego is $68,490, with the highest median household income of $93,750 found in the 25 to 44 years age bracket for the primary householder. A total of 537 households (32.7%) fall into this category. Meanwhile, the 65+ years age bracket for the primary householder has the lowest median household income of $32,188, with 417 households (25.4%) in this group.
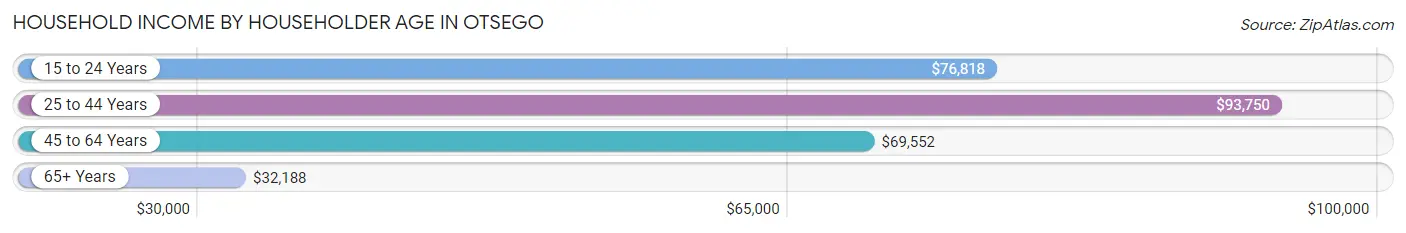
| Income Bracket | # Households | Median Income |
| 15 to 24 Years | 54 (3.3%) | $76,818 |
| 25 to 44 Years | 537 (32.7%) | $93,750 |
| 45 to 64 Years | 633 (38.6%) | $69,552 |
| 65+ Years | 417 (25.4%) | $32,188 |
| Total | 1,641 (100.0%) | $68,490 |
Poverty in Otsego
Income Below Poverty by Sex and Age in Otsego
With 3.5% poverty level for males and 7.9% for females among the residents of Otsego, 25 to 34 year old males and 75 year old and over females are the most vulnerable to poverty, with 33 males (14.7%) and 67 females (24.6%) in their respective age groups living below the poverty level.
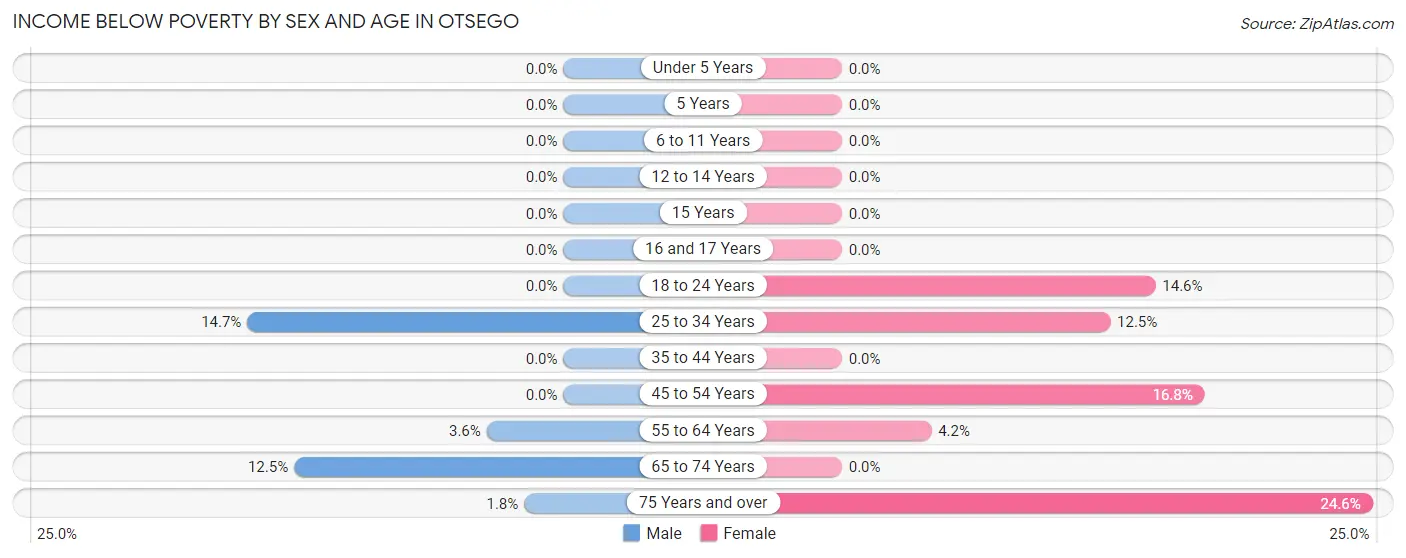
| Age Bracket | Male | Female |
| Under 5 Years | 0 (0.0%) | 0 (0.0%) |
| 5 Years | 0 (0.0%) | 0 (0.0%) |
| 6 to 11 Years | 0 (0.0%) | 0 (0.0%) |
| 12 to 14 Years | 0 (0.0%) | 0 (0.0%) |
| 15 Years | 0 (0.0%) | 0 (0.0%) |
| 16 and 17 Years | 0 (0.0%) | 0 (0.0%) |
| 18 to 24 Years | 0 (0.0%) | 32 (14.5%) |
| 25 to 34 Years | 33 (14.7%) | 30 (12.4%) |
| 35 to 44 Years | 0 (0.0%) | 0 (0.0%) |
| 45 to 54 Years | 0 (0.0%) | 33 (16.8%) |
| 55 to 64 Years | 13 (3.6%) | 19 (4.2%) |
| 65 to 74 Years | 14 (12.5%) | 0 (0.0%) |
| 75 Years and over | 2 (1.8%) | 67 (24.6%) |
| Total | 62 (3.5%) | 181 (7.9%) |
Income Above Poverty by Sex and Age in Otsego
According to the poverty statistics in Otsego, males aged under 5 years and females aged under 5 years are the age groups that are most secure financially, with 100.0% of males and 100.0% of females in these age groups living above the poverty line.
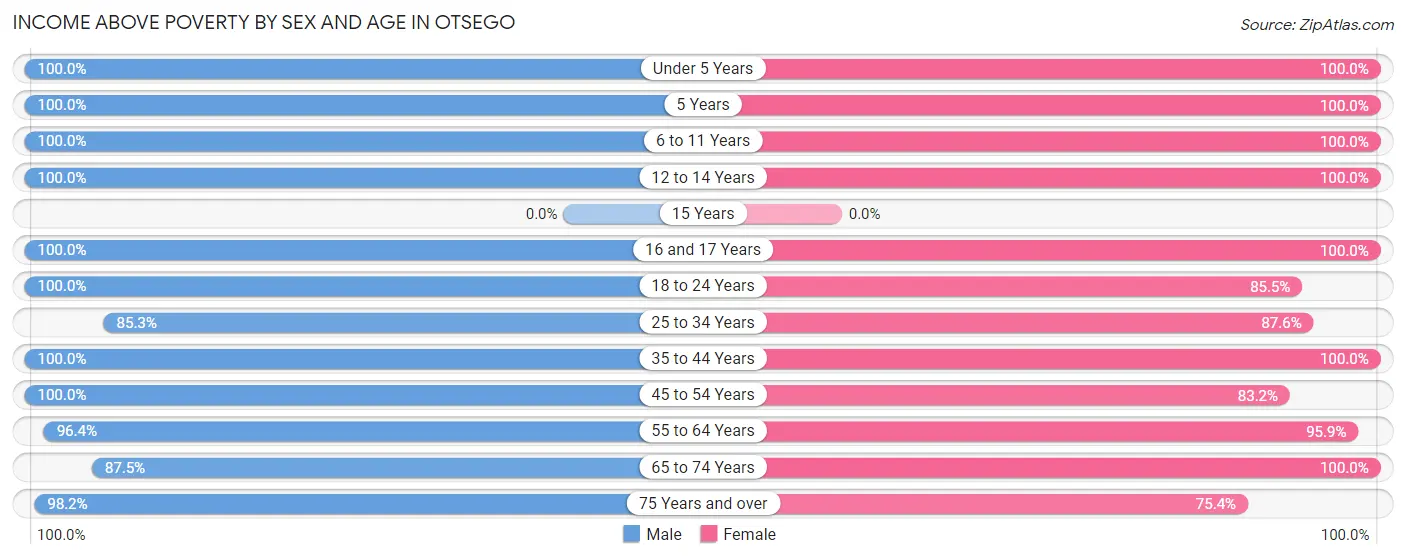
| Age Bracket | Male | Female |
| Under 5 Years | 78 (100.0%) | 74 (100.0%) |
| 5 Years | 53 (100.0%) | 29 (100.0%) |
| 6 to 11 Years | 144 (100.0%) | 208 (100.0%) |
| 12 to 14 Years | 158 (100.0%) | 65 (100.0%) |
| 15 Years | 0 (0.0%) | 0 (0.0%) |
| 16 and 17 Years | 20 (100.0%) | 7 (100.0%) |
| 18 to 24 Years | 106 (100.0%) | 188 (85.5%) |
| 25 to 34 Years | 192 (85.3%) | 211 (87.5%) |
| 35 to 44 Years | 240 (100.0%) | 411 (100.0%) |
| 45 to 54 Years | 167 (100.0%) | 163 (83.2%) |
| 55 to 64 Years | 352 (96.4%) | 439 (95.9%) |
| 65 to 74 Years | 98 (87.5%) | 124 (100.0%) |
| 75 Years and over | 108 (98.2%) | 205 (75.4%) |
| Total | 1,716 (96.5%) | 2,124 (92.1%) |
Income Below Poverty Among Married-Couple Families in Otsego
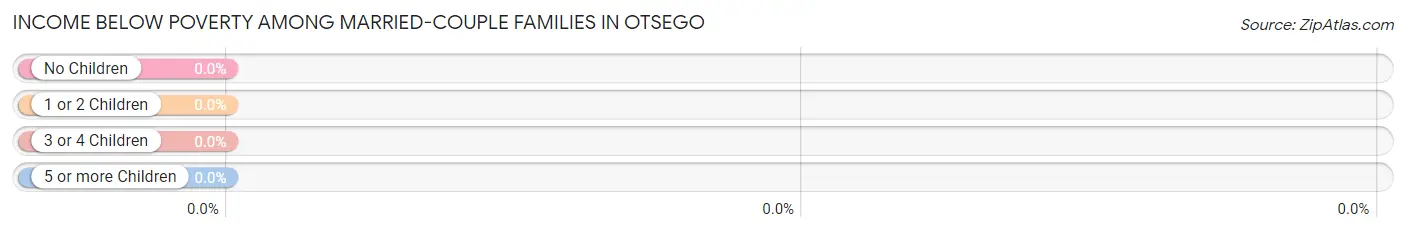
| Children | Above Poverty | Below Poverty |
| No Children | 446 (100.0%) | 0 (0.0%) |
| 1 or 2 Children | 414 (100.0%) | 0 (0.0%) |
| 3 or 4 Children | 34 (100.0%) | 0 (0.0%) |
| 5 or more Children | 0 (0.0%) | 0 (0.0%) |
| Total | 894 (100.0%) | 0 (0.0%) |
Income Below Poverty Among Single-Parent Households in Otsego
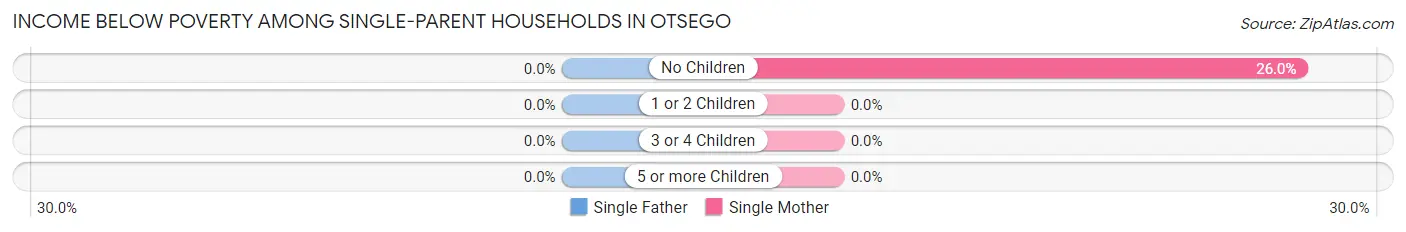
| Children | Single Father | Single Mother |
| No Children | 0 (0.0%) | 27 (26.0%) |
| 1 or 2 Children | 0 (0.0%) | 0 (0.0%) |
| 3 or 4 Children | 0 (0.0%) | 0 (0.0%) |
| 5 or more Children | 0 (0.0%) | 0 (0.0%) |
| Total | 0 (0.0%) | 27 (12.1%) |
Income Below Poverty Among Married-Couple vs Single-Parent Households in Otsego
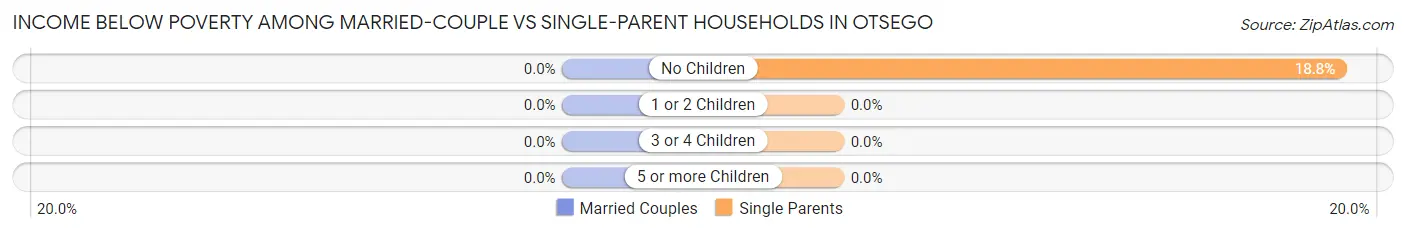
| Children | Married-Couple Families | Single-Parent Households |
| No Children | 0 (0.0%) | 27 (18.8%) |
| 1 or 2 Children | 0 (0.0%) | 0 (0.0%) |
| 3 or 4 Children | 0 (0.0%) | 0 (0.0%) |
| 5 or more Children | 0 (0.0%) | 0 (0.0%) |
| Total | 0 (0.0%) | 27 (9.8%) |
Race in Otsego
The most populous races in Otsego are White / Caucasian (3,172 | 77.7%), Some other Race (425 | 10.4%), and Two or more Races (406 | 9.9%).
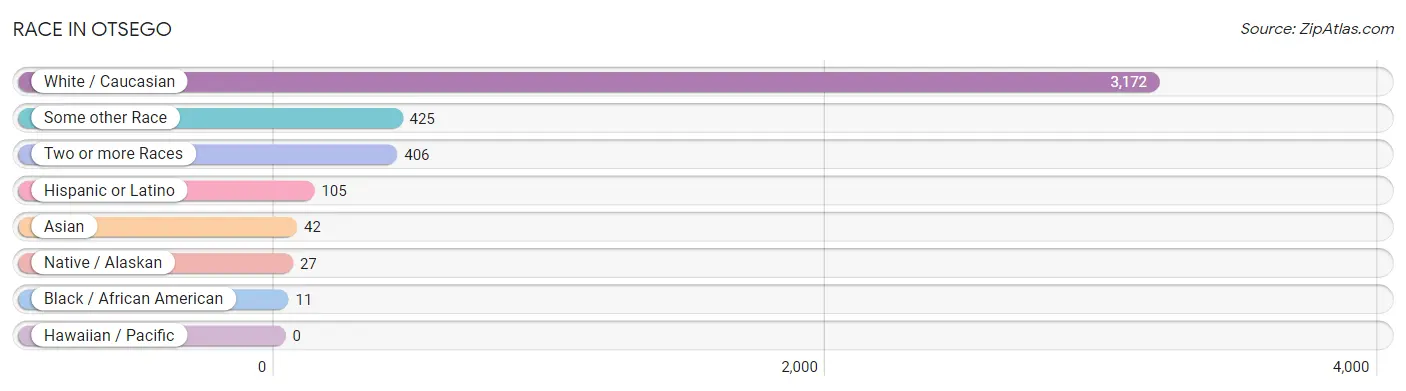
| Race | # Population | % Population |
| Asian | 42 | 1.0% |
| Black / African American | 11 | 0.3% |
| Hawaiian / Pacific | 0 | 0.0% |
| Hispanic or Latino | 105 | 2.6% |
| Native / Alaskan | 27 | 0.7% |
| White / Caucasian | 3,172 | 77.7% |
| Two or more Races | 406 | 9.9% |
| Some other Race | 425 | 10.4% |
| Total | 4,083 | 100.0% |
Ancestry in Otsego
The most populous ancestries reported in Otsego are Irish (660 | 16.2%), English (578 | 14.2%), German (501 | 12.3%), Dutch (305 | 7.5%), and European (215 | 5.3%), together accounting for 55.3% of all Otsego residents.
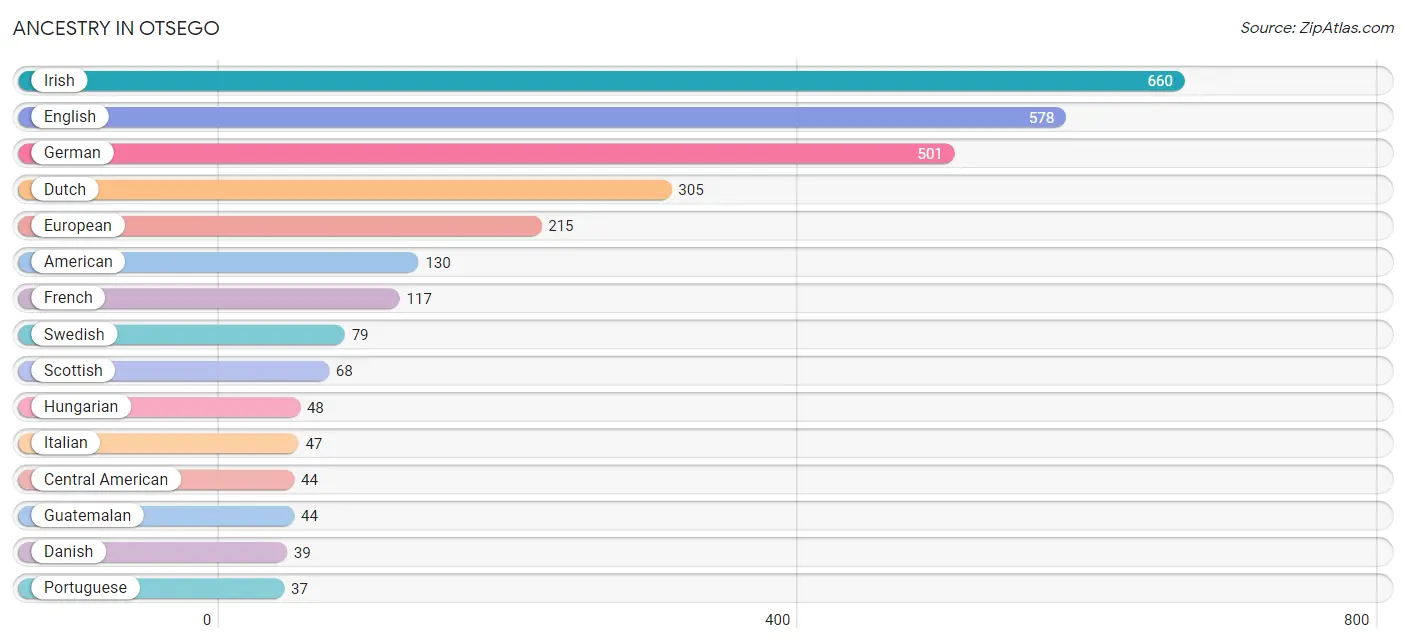
| Ancestry | # Population | % Population |
| American | 130 | 3.2% |
| Central American | 44 | 1.1% |
| Croatian | 15 | 0.4% |
| Czech | 27 | 0.7% |
| Danish | 39 | 1.0% |
| Dutch | 305 | 7.5% |
| English | 578 | 14.2% |
| European | 215 | 5.3% |
| Finnish | 12 | 0.3% |
| French | 117 | 2.9% |
| French Canadian | 14 | 0.3% |
| German | 501 | 12.3% |
| Guatemalan | 44 | 1.1% |
| Hungarian | 48 | 1.2% |
| Irish | 660 | 16.2% |
| Italian | 47 | 1.1% |
| Korean | 26 | 0.6% |
| Mexican | 27 | 0.7% |
| Pakistani | 22 | 0.5% |
| Pennsylvania German | 9 | 0.2% |
| Polish | 34 | 0.8% |
| Portuguese | 37 | 0.9% |
| Potawatomi | 27 | 0.7% |
| Scotch-Irish | 19 | 0.5% |
| Scottish | 68 | 1.7% |
| Slovak | 10 | 0.2% |
| Swedish | 79 | 1.9% |
| Welsh | 13 | 0.3% | View All 28 Rows |
Immigrants in Otsego
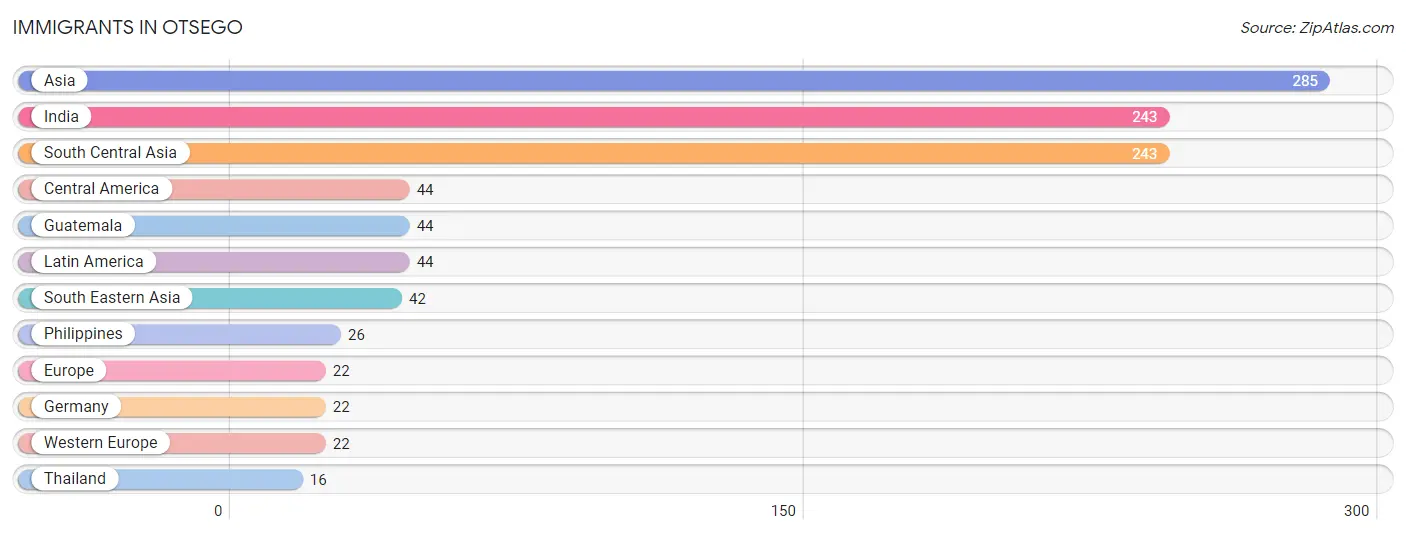
The most numerous immigrant groups reported in Otsego came from Asia (285 | 7.0%), India (243 | 5.9%), South Central Asia (243 | 5.9%), Central America (44 | 1.1%), and Guatemala (44 | 1.1%), together accounting for 21.0% of all Otsego residents.
| Immigration Origin | # Population | % Population |
| Asia | 285 | 7.0% |
| Central America | 44 | 1.1% |
| Europe | 22 | 0.5% |
| Germany | 22 | 0.5% |
| Guatemala | 44 | 1.1% |
| India | 243 | 5.9% |
| Latin America | 44 | 1.1% |
| Philippines | 26 | 0.6% |
| South Central Asia | 243 | 5.9% |
| South Eastern Asia | 42 | 1.0% |
| Thailand | 16 | 0.4% |
| Western Europe | 22 | 0.5% | View All 12 Rows |
Sex and Age in Otsego
Sex and Age in Otsego
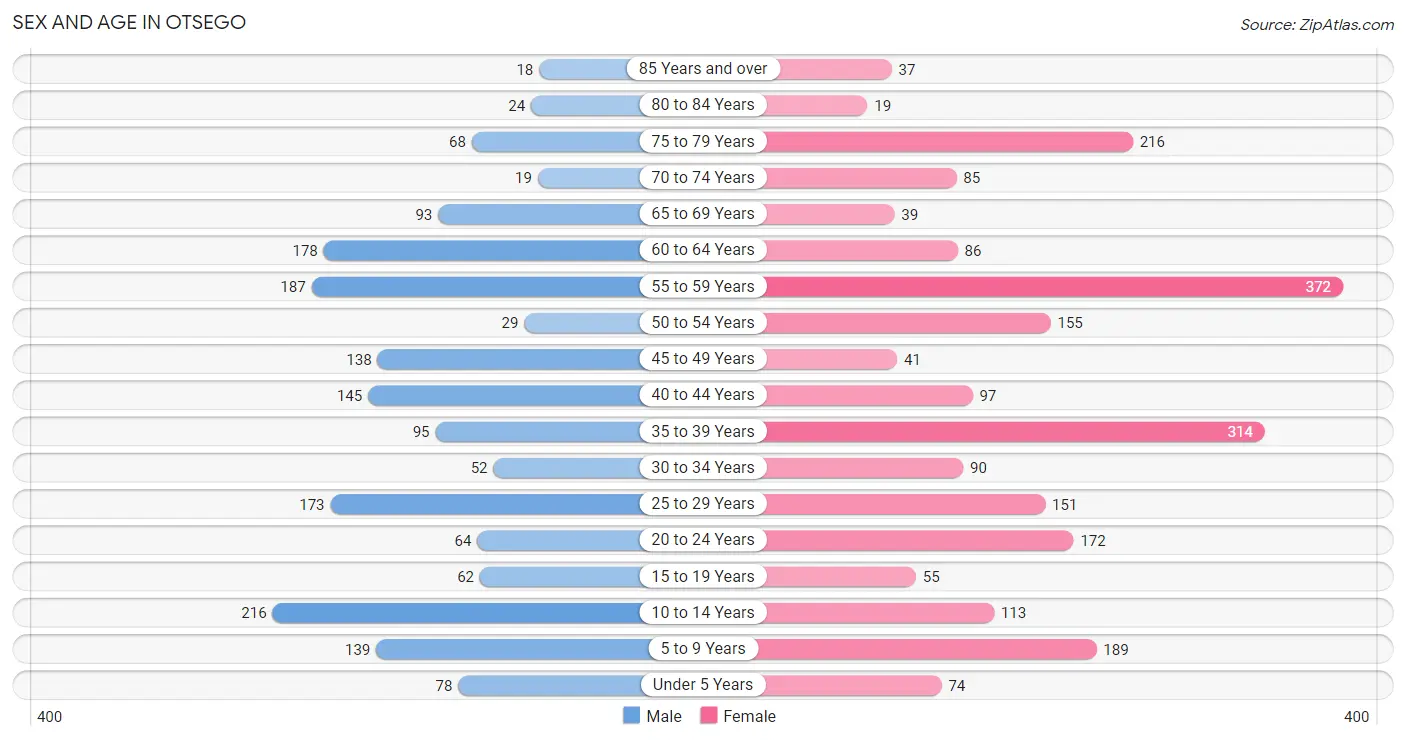
The most populous age groups in Otsego are 10 to 14 Years (216 | 12.1%) for men and 55 to 59 Years (372 | 16.1%) for women.
| Age Bracket | Male | Female |
| Under 5 Years | 78 (4.4%) | 74 (3.2%) |
| 5 to 9 Years | 139 (7.8%) | 189 (8.2%) |
| 10 to 14 Years | 216 (12.1%) | 113 (4.9%) |
| 15 to 19 Years | 62 (3.5%) | 55 (2.4%) |
| 20 to 24 Years | 64 (3.6%) | 172 (7.5%) |
| 25 to 29 Years | 173 (9.7%) | 151 (6.6%) |
| 30 to 34 Years | 52 (2.9%) | 90 (3.9%) |
| 35 to 39 Years | 95 (5.3%) | 314 (13.6%) |
| 40 to 44 Years | 145 (8.2%) | 97 (4.2%) |
| 45 to 49 Years | 138 (7.8%) | 41 (1.8%) |
| 50 to 54 Years | 29 (1.6%) | 155 (6.7%) |
| 55 to 59 Years | 187 (10.5%) | 372 (16.1%) |
| 60 to 64 Years | 178 (10.0%) | 86 (3.7%) |
| 65 to 69 Years | 93 (5.2%) | 39 (1.7%) |
| 70 to 74 Years | 19 (1.1%) | 85 (3.7%) |
| 75 to 79 Years | 68 (3.8%) | 216 (9.4%) |
| 80 to 84 Years | 24 (1.3%) | 19 (0.8%) |
| 85 Years and over | 18 (1.0%) | 37 (1.6%) |
| Total | 1,778 (100.0%) | 2,305 (100.0%) |
Families and Households in Otsego
Median Family Size in Otsego
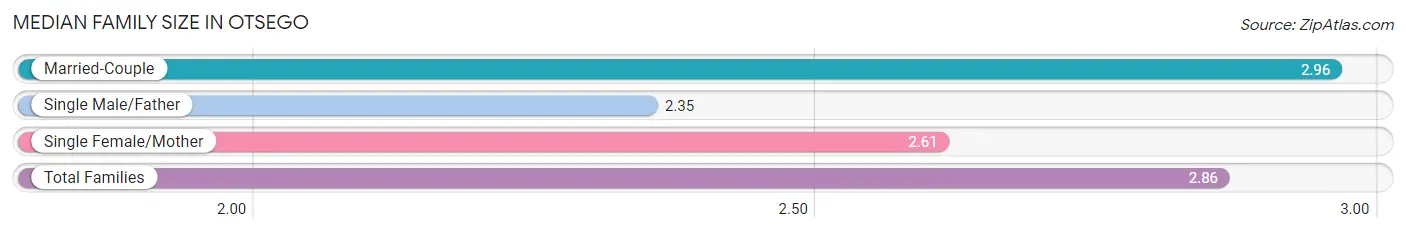
The median family size in Otsego is 2.86 persons per family, with married-couple families (894 | 76.5%) accounting for the largest median family size of 2.96 persons per family. On the other hand, single male/father families (52 | 4.4%) represent the smallest median family size with 2.35 persons per family.
| Family Type | # Families | Family Size |
| Married-Couple | 894 (76.5%) | 2.96 |
| Single Male/Father | 52 (4.4%) | 2.35 |
| Single Female/Mother | 223 (19.1%) | 2.61 |
| Total Families | 1,169 (100.0%) | 2.86 |
Median Household Size in Otsego
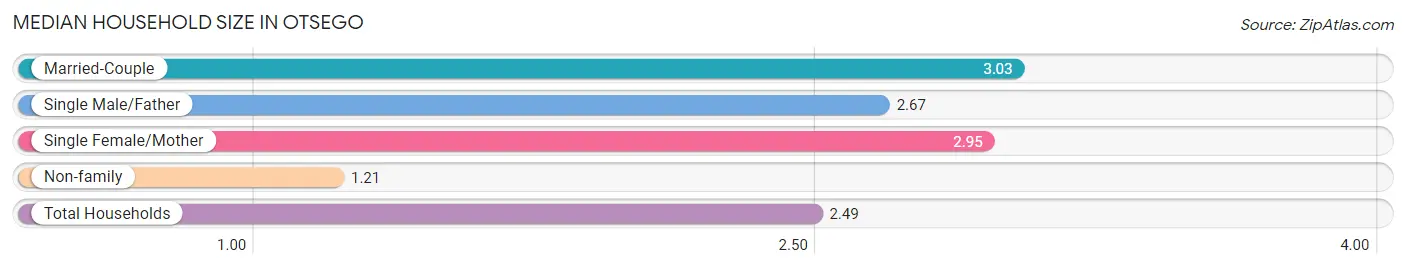
The median household size in Otsego is 2.49 persons per household, with married-couple households (894 | 54.5%) accounting for the largest median household size of 3.03 persons per household. non-family households (472 | 28.8%) represent the smallest median household size with 1.21 persons per household.
| Household Type | # Households | Household Size |
| Married-Couple | 894 (54.5%) | 3.03 |
| Single Male/Father | 52 (3.2%) | 2.67 |
| Single Female/Mother | 223 (13.6%) | 2.95 |
| Non-family | 472 (28.8%) | 1.21 |
| Total Households | 1,641 (100.0%) | 2.49 |
Household Size by Marriage Status in Otsego
Out of a total of 1,641 households in Otsego, 1,169 (71.2%) are family households, while 472 (28.8%) are nonfamily households. The most numerous type of family households are 2-person households, comprising 444, and the most common type of nonfamily households are 1-person households, comprising 373.
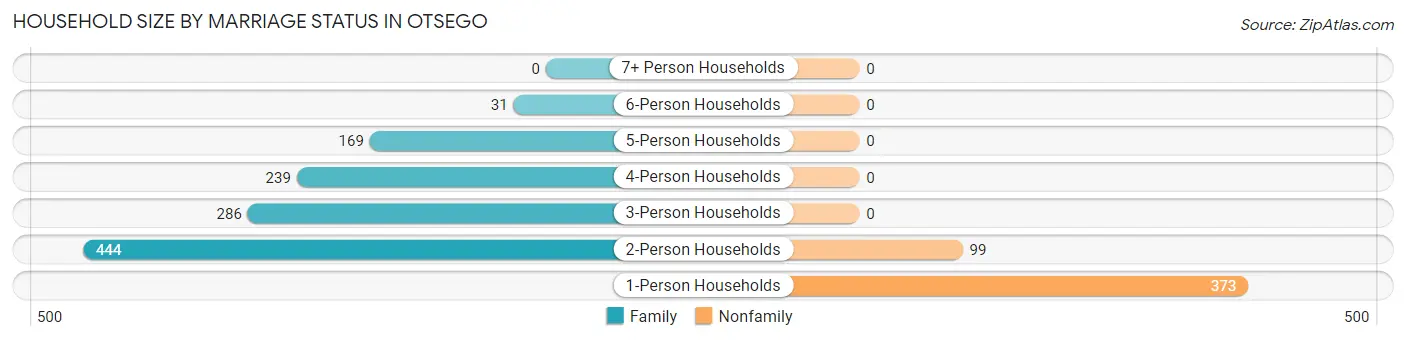
| Household Size | Family Households | Nonfamily Households |
| 1-Person Households | - | 373 (22.7%) |
| 2-Person Households | 444 (27.1%) | 99 (6.0%) |
| 3-Person Households | 286 (17.4%) | 0 (0.0%) |
| 4-Person Households | 239 (14.6%) | 0 (0.0%) |
| 5-Person Households | 169 (10.3%) | 0 (0.0%) |
| 6-Person Households | 31 (1.9%) | 0 (0.0%) |
| 7+ Person Households | 0 (0.0%) | 0 (0.0%) |
| Total | 1,169 (71.2%) | 472 (28.8%) |
Female Fertility in Otsego
Fertility by Age in Otsego
Average fertility rate in Otsego is 78.0 births per 1,000 women. Women in the age bracket of 20 to 34 years have the highest fertility rate with 182.0 births per 1,000 women. Women in the age bracket of 20 to 34 years acount for 100.0% of all women with births.
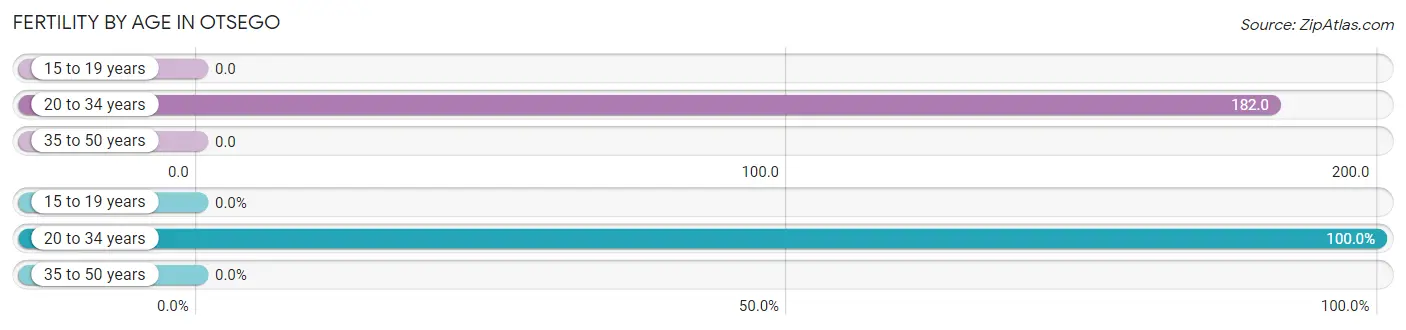
| Age Bracket | Women with Births | Births / 1,000 Women |
| 15 to 19 years | 0 (0.0%) | 0.0 |
| 20 to 34 years | 75 (100.0%) | 182.0 |
| 35 to 50 years | 0 (0.0%) | 0.0 |
| Total | 75 (100.0%) | 78.0 |
Fertility by Age by Marriage Status in Otsego
28.0% of women with births (75) in Otsego are married. The highest percentage of unmarried women with births falls into 20 to 34 years age bracket with 72.0% of them unmarried at the time of birth, while the lowest percentage of unmarried women with births belong to 20 to 34 years age bracket with 72.0% of them unmarried.
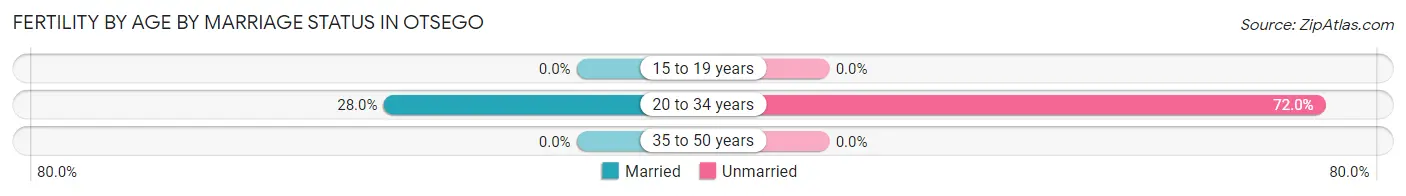
| Age Bracket | Married | Unmarried |
| 15 to 19 years | 0 (0.0%) | 0 (0.0%) |
| 20 to 34 years | 21 (28.0%) | 54 (72.0%) |
| 35 to 50 years | 0 (0.0%) | 0 (0.0%) |
| Total | 21 (28.0%) | 54 (72.0%) |
Fertility by Education in Otsego
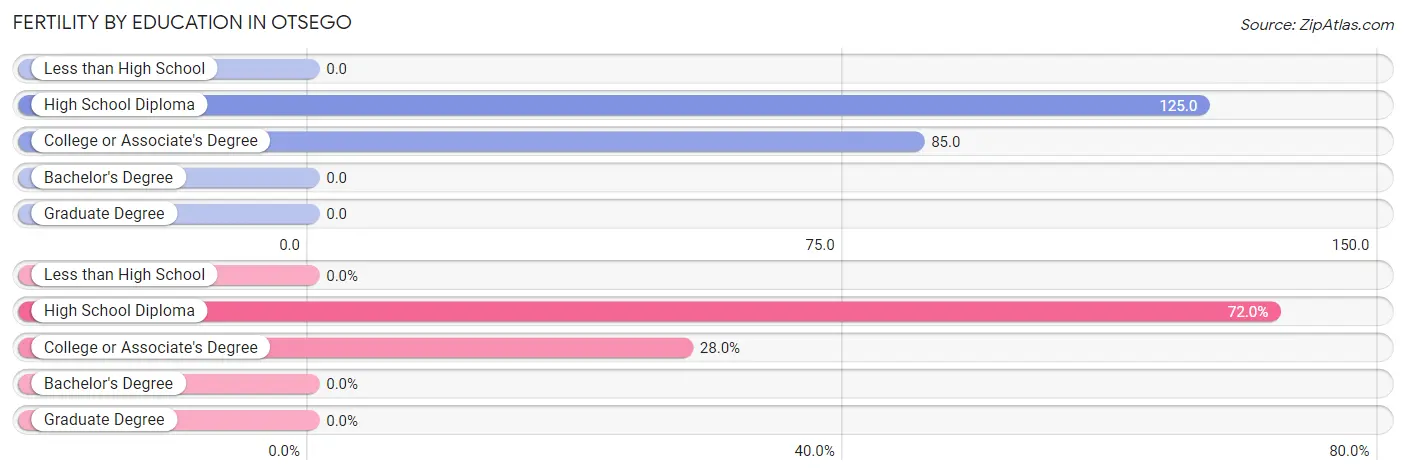
| Educational Attainment | Women with Births | Births / 1,000 Women |
| Less than High School | 0 (0.0%) | 0.0 |
| High School Diploma | 54 (72.0%) | 125.0 |
| College or Associate's Degree | 21 (28.0%) | 85.0 |
| Bachelor's Degree | 0 (0.0%) | 0.0 |
| Graduate Degree | 0 (0.0%) | 0.0 |
| Total | 75 (100.0%) | 78.0 |
Fertility by Education by Marriage Status in Otsego
72.0% of women with births in Otsego are unmarried. Women with the educational attainment of college or associate's degree are most likely to be married with 100.0% of them married at childbirth, while women with the educational attainment of high school diploma are least likely to be married with 100.0% of them unmarried at childbirth.
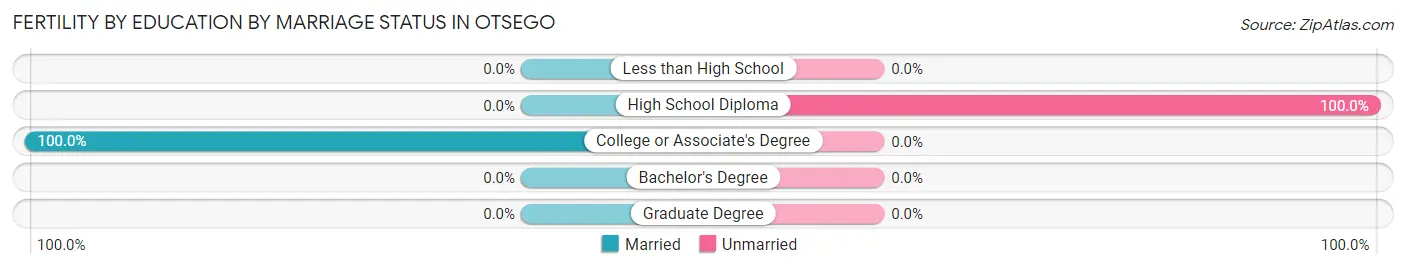
| Educational Attainment | Married | Unmarried |
| Less than High School | 0 (0.0%) | 0 (0.0%) |
| High School Diploma | 0 (0.0%) | 54 (100.0%) |
| College or Associate's Degree | 21 (100.0%) | 0 (0.0%) |
| Bachelor's Degree | 0 (0.0%) | 0 (0.0%) |
| Graduate Degree | 0 (0.0%) | 0 (0.0%) |
| Total | 21 (28.0%) | 54 (72.0%) |
Employment Characteristics in Otsego
Employment by Class of Employer in Otsego
Among the 1,669 employed individuals in Otsego, private company employees (1,379 | 82.6%), not-for-profit organizations (155 | 9.3%), and local government employees (72 | 4.3%) make up the most common classes of employment.
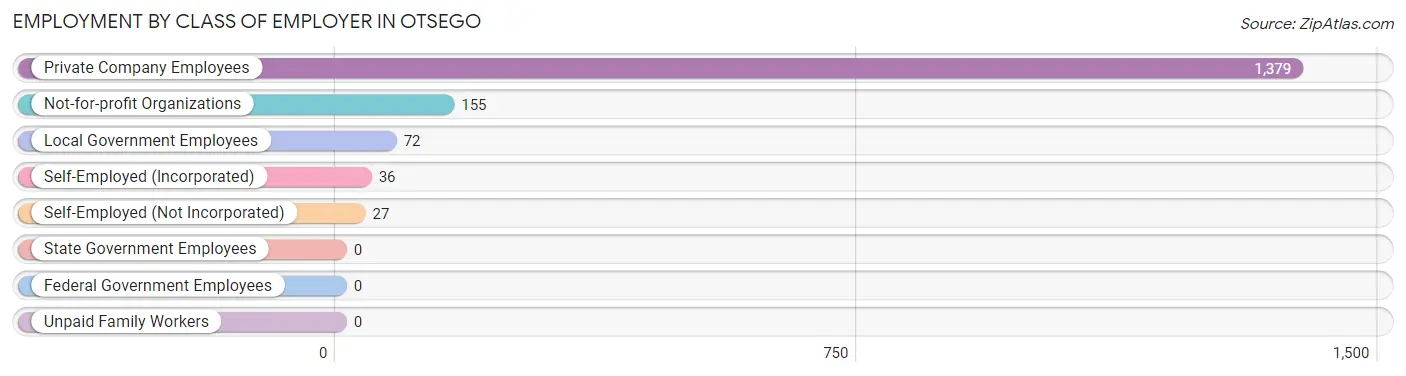
| Employer Class | # Employees | % Employees |
| Private Company Employees | 1,379 | 82.6% |
| Self-Employed (Incorporated) | 36 | 2.2% |
| Self-Employed (Not Incorporated) | 27 | 1.6% |
| Not-for-profit Organizations | 155 | 9.3% |
| Local Government Employees | 72 | 4.3% |
| State Government Employees | 0 | 0.0% |
| Federal Government Employees | 0 | 0.0% |
| Unpaid Family Workers | 0 | 0.0% |
| Total | 1,669 | 100.0% |
Employment Status by Age in Otsego
According to the labor force statistics for Otsego, out of the total population over 16 years of age (3,274), 57.7% or 1,889 individuals are in the labor force, with 7.8% or 147 of them unemployed. The age group with the highest labor force participation rate is 25 to 29 years, with 90.7% or 294 individuals in the labor force. Within the labor force, the 20 to 24 years age range has the highest percentage of unemployed individuals, with 29.2% or 54 of them being unemployed.
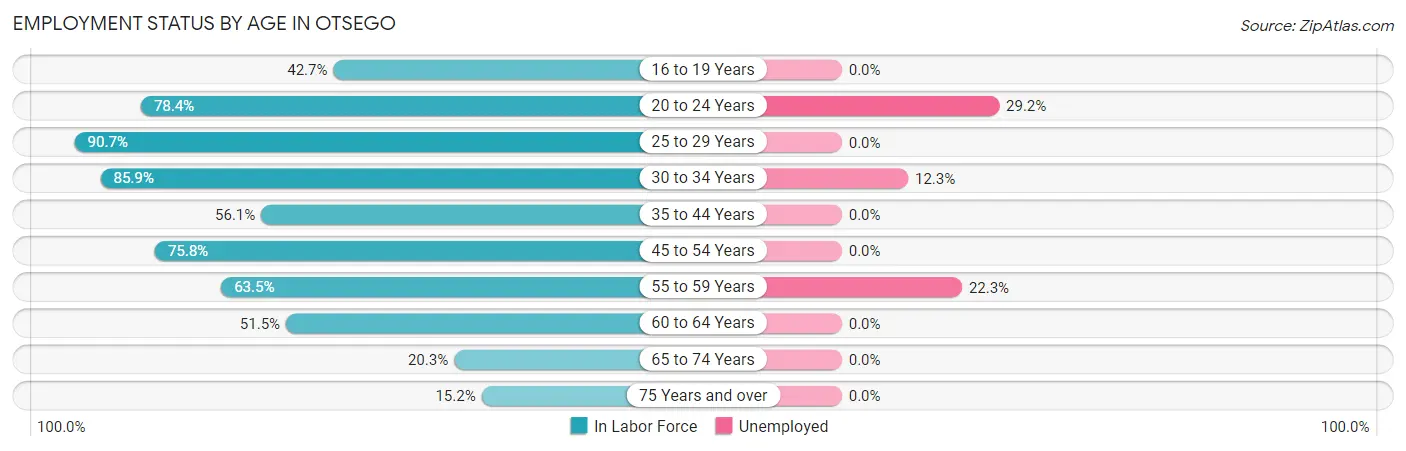
| Age Bracket | In Labor Force | Unemployed |
| 16 to 19 Years | 50 (42.7%) | 0 (0.0%) |
| 20 to 24 Years | 185 (78.4%) | 54 (29.2%) |
| 25 to 29 Years | 294 (90.7%) | 0 (0.0%) |
| 30 to 34 Years | 122 (85.9%) | 15 (12.3%) |
| 35 to 44 Years | 365 (56.1%) | 0 (0.0%) |
| 45 to 54 Years | 275 (75.8%) | 0 (0.0%) |
| 55 to 59 Years | 355 (63.5%) | 79 (22.3%) |
| 60 to 64 Years | 136 (51.5%) | 0 (0.0%) |
| 65 to 74 Years | 48 (20.3%) | 0 (0.0%) |
| 75 Years and over | 58 (15.2%) | 0 (0.0%) |
| Total | 1,889 (57.7%) | 147 (7.8%) |
Employment Status by Educational Attainment in Otsego
According to labor force statistics for Otsego, 67.2% of individuals (1,548) out of the total population between 25 and 64 years of age (2,303) are in the labor force, with 6.1% or 94 of them being unemployed. The group with the highest labor force participation rate are those with the educational attainment of bachelor's degree or higher, with 100.0% or 256 individuals in the labor force. Within the labor force, individuals with less than high school education have the highest percentage of unemployment, with 15.7% or 13 of them being unemployed.
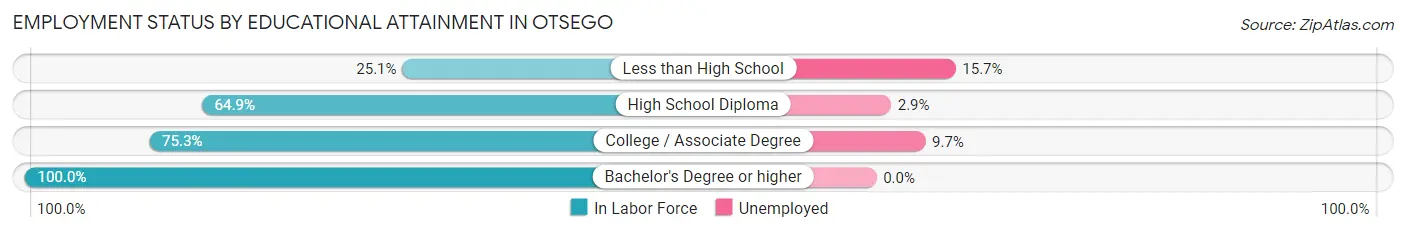
| Educational Attainment | In Labor Force | Unemployed |
| Less than High School | 83 (25.1%) | 52 (15.7%) |
| High School Diploma | 525 (64.9%) | 23 (2.9%) |
| College / Associate Degree | 683 (75.3%) | 88 (9.7%) |
| Bachelor's Degree or higher | 256 (100.0%) | 0 (0.0%) |
| Total | 1,548 (67.2%) | 140 (6.1%) |
Employment Occupations by Sex in Otsego
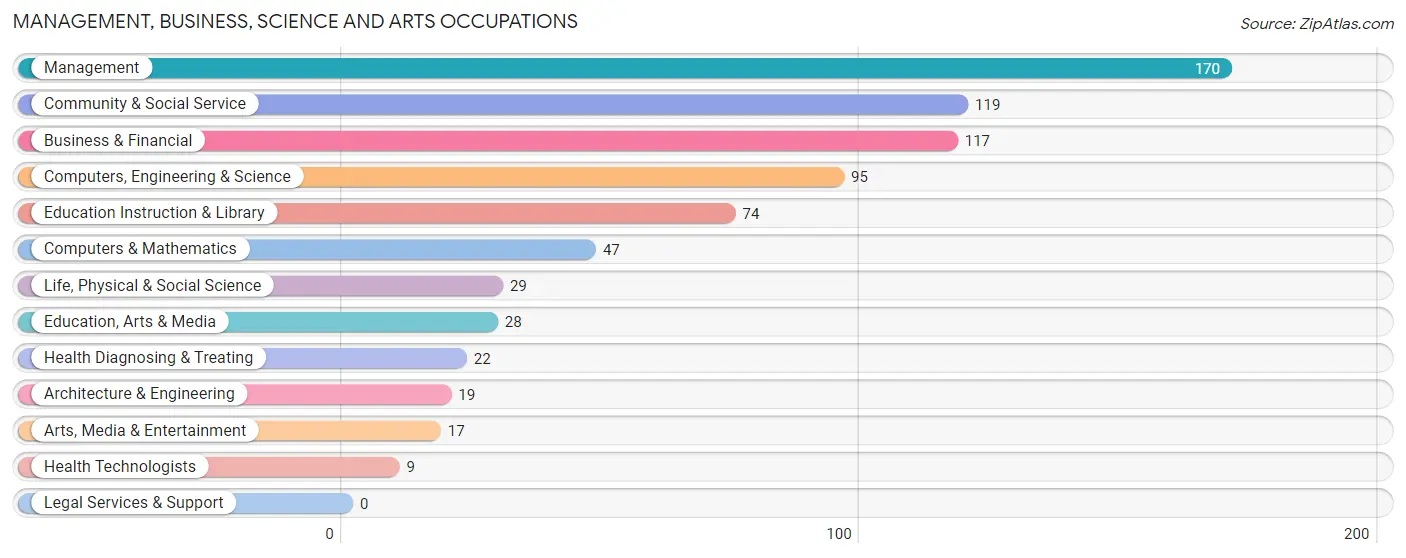
Management, Business, Science and Arts Occupations
The most common Management, Business, Science and Arts occupations in Otsego are Management (170 | 9.8%), Community & Social Service (119 | 6.8%), Business & Financial (117 | 6.7%), Computers, Engineering & Science (95 | 5.5%), and Education Instruction & Library (74 | 4.3%).
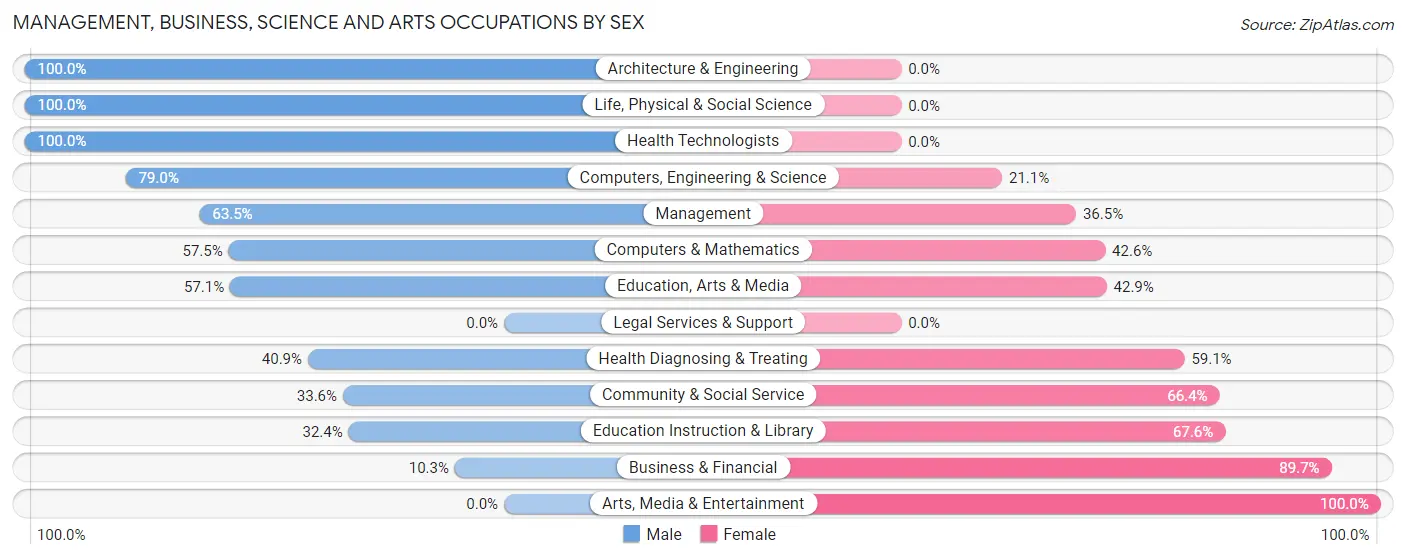
Management, Business, Science and Arts Occupations by Sex
Within the Management, Business, Science and Arts occupations in Otsego, the most male-oriented occupations are Architecture & Engineering (100.0%), Life, Physical & Social Science (100.0%), and Health Technologists (100.0%), while the most female-oriented occupations are Arts, Media & Entertainment (100.0%), Business & Financial (89.7%), and Education Instruction & Library (67.6%).
| Occupation | Male | Female |
| Management | 108 (63.5%) | 62 (36.5%) |
| Business & Financial | 12 (10.3%) | 105 (89.7%) |
| Computers, Engineering & Science | 75 (78.9%) | 20 (21.0%) |
| Computers & Mathematics | 27 (57.5%) | 20 (42.5%) |
| Architecture & Engineering | 19 (100.0%) | 0 (0.0%) |
| Life, Physical & Social Science | 29 (100.0%) | 0 (0.0%) |
| Community & Social Service | 40 (33.6%) | 79 (66.4%) |
| Education, Arts & Media | 16 (57.1%) | 12 (42.9%) |
| Legal Services & Support | 0 (0.0%) | 0 (0.0%) |
| Education Instruction & Library | 24 (32.4%) | 50 (67.6%) |
| Arts, Media & Entertainment | 0 (0.0%) | 17 (100.0%) |
| Health Diagnosing & Treating | 9 (40.9%) | 13 (59.1%) |
| Health Technologists | 9 (100.0%) | 0 (0.0%) |
| Total (Category) | 244 (46.7%) | 279 (53.3%) |
| Total (Overall) | 916 (52.6%) | 824 (47.4%) |
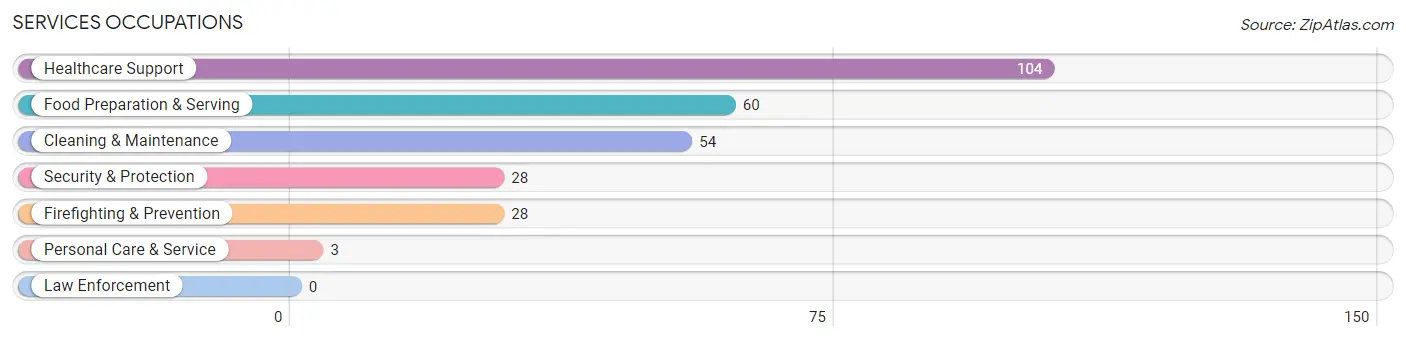
Services Occupations
The most common Services occupations in Otsego are Healthcare Support (104 | 6.0%), Food Preparation & Serving (60 | 3.5%), Cleaning & Maintenance (54 | 3.1%), Security & Protection (28 | 1.6%), and Firefighting & Prevention (28 | 1.6%).
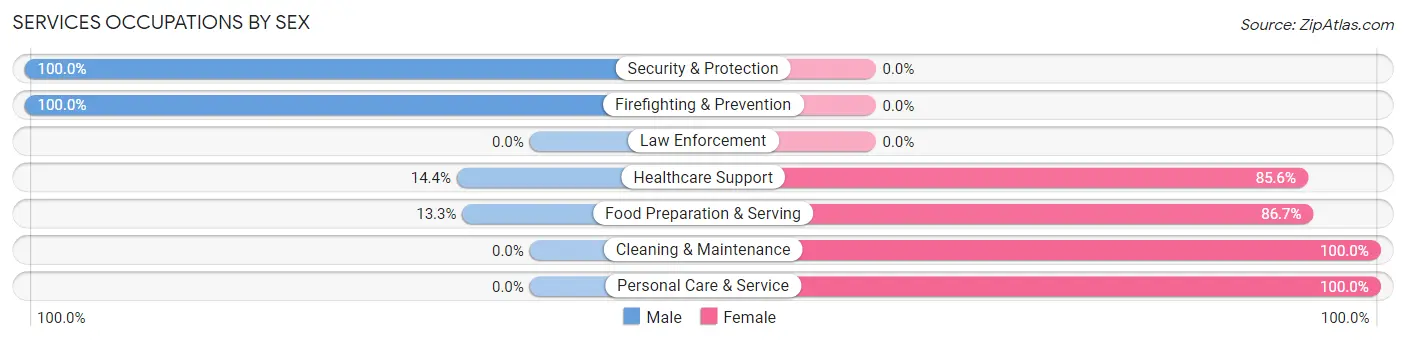
Services Occupations by Sex
Within the Services occupations in Otsego, the most male-oriented occupations are Security & Protection (100.0%), Firefighting & Prevention (100.0%), and Healthcare Support (14.4%), while the most female-oriented occupations are Cleaning & Maintenance (100.0%), Personal Care & Service (100.0%), and Food Preparation & Serving (86.7%).
| Occupation | Male | Female |
| Healthcare Support | 15 (14.4%) | 89 (85.6%) |
| Security & Protection | 28 (100.0%) | 0 (0.0%) |
| Firefighting & Prevention | 28 (100.0%) | 0 (0.0%) |
| Law Enforcement | 0 (0.0%) | 0 (0.0%) |
| Food Preparation & Serving | 8 (13.3%) | 52 (86.7%) |
| Cleaning & Maintenance | 0 (0.0%) | 54 (100.0%) |
| Personal Care & Service | 0 (0.0%) | 3 (100.0%) |
| Total (Category) | 51 (20.5%) | 198 (79.5%) |
| Total (Overall) | 916 (52.6%) | 824 (47.4%) |
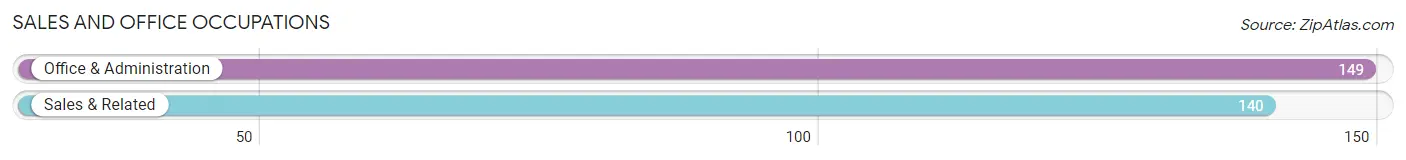
Sales and Office Occupations
The most common Sales and Office occupations in Otsego are Office & Administration (149 | 8.6%), and Sales & Related (140 | 8.1%).
Sales and Office Occupations by Sex
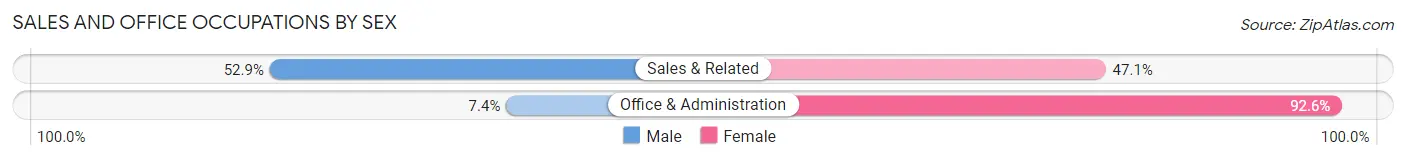
| Occupation | Male | Female |
| Sales & Related | 74 (52.9%) | 66 (47.1%) |
| Office & Administration | 11 (7.4%) | 138 (92.6%) |
| Total (Category) | 85 (29.4%) | 204 (70.6%) |
| Total (Overall) | 916 (52.6%) | 824 (47.4%) |
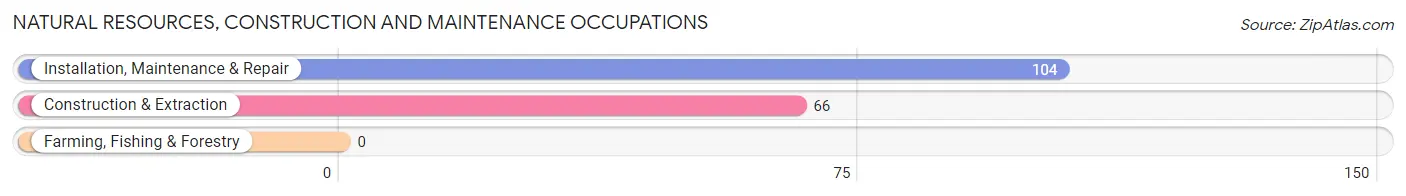
Natural Resources, Construction and Maintenance Occupations
The most common Natural Resources, Construction and Maintenance occupations in Otsego are Installation, Maintenance & Repair (104 | 6.0%), and Construction & Extraction (66 | 3.8%).
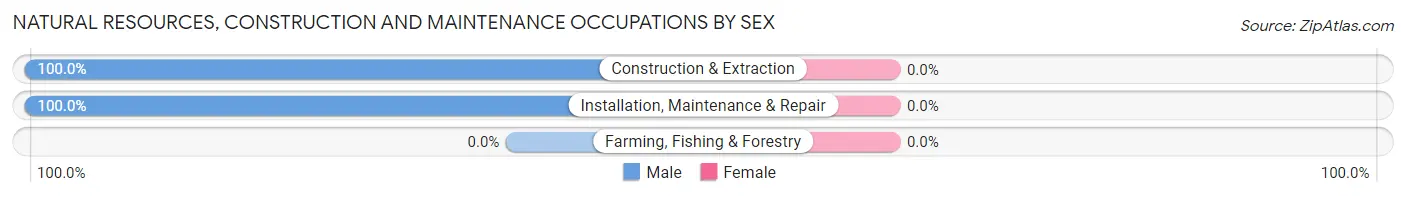
Natural Resources, Construction and Maintenance Occupations by Sex
| Occupation | Male | Female |
| Farming, Fishing & Forestry | 0 (0.0%) | 0 (0.0%) |
| Construction & Extraction | 66 (100.0%) | 0 (0.0%) |
| Installation, Maintenance & Repair | 104 (100.0%) | 0 (0.0%) |
| Total (Category) | 170 (100.0%) | 0 (0.0%) |
| Total (Overall) | 916 (52.6%) | 824 (47.4%) |
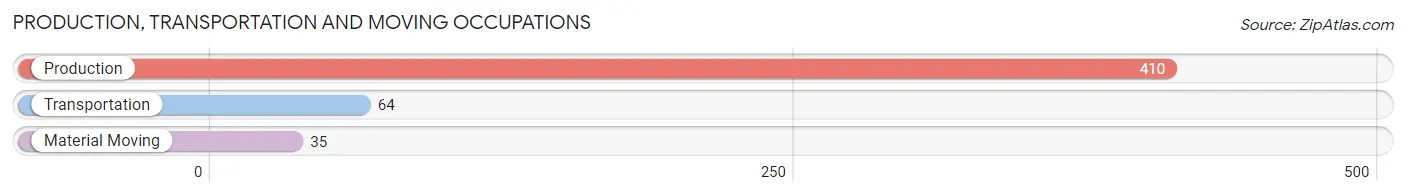
Production, Transportation and Moving Occupations
The most common Production, Transportation and Moving occupations in Otsego are Production (410 | 23.6%), Transportation (64 | 3.7%), and Material Moving (35 | 2.0%).
Production, Transportation and Moving Occupations by Sex
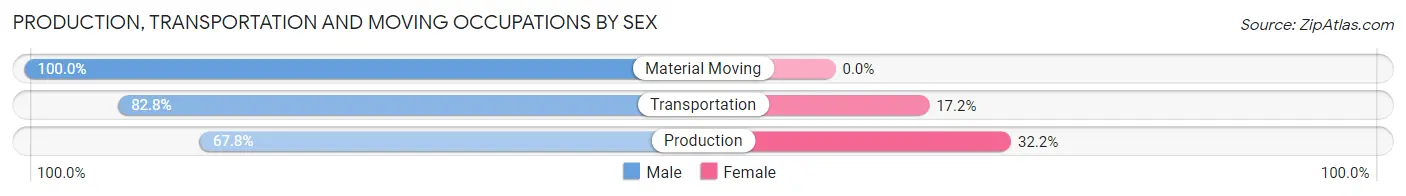
| Occupation | Male | Female |
| Production | 278 (67.8%) | 132 (32.2%) |
| Transportation | 53 (82.8%) | 11 (17.2%) |
| Material Moving | 35 (100.0%) | 0 (0.0%) |
| Total (Category) | 366 (71.9%) | 143 (28.1%) |
| Total (Overall) | 916 (52.6%) | 824 (47.4%) |
Employment Industries by Sex in Otsego
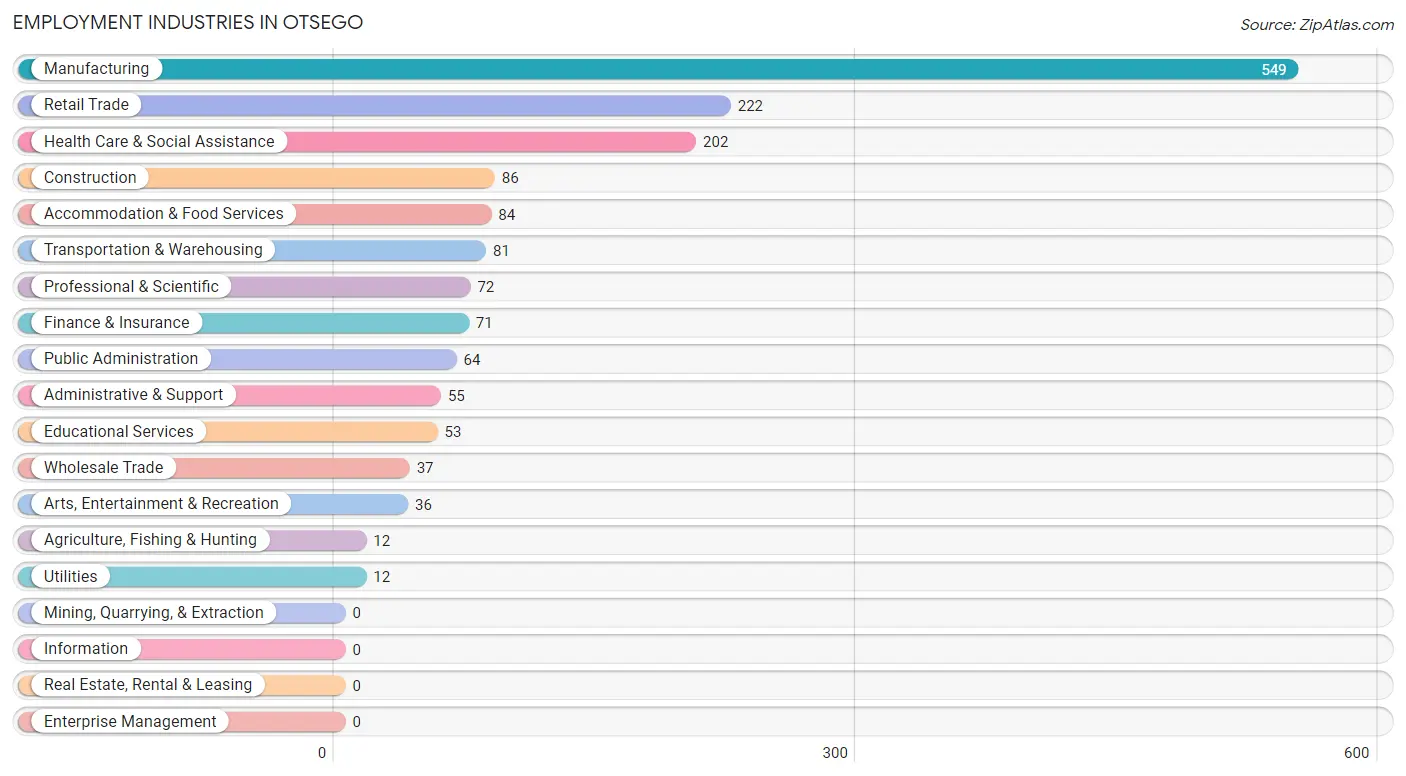
Employment Industries in Otsego
The major employment industries in Otsego include Manufacturing (549 | 31.6%), Retail Trade (222 | 12.8%), Health Care & Social Assistance (202 | 11.6%), Construction (86 | 4.9%), and Accommodation & Food Services (84 | 4.8%).
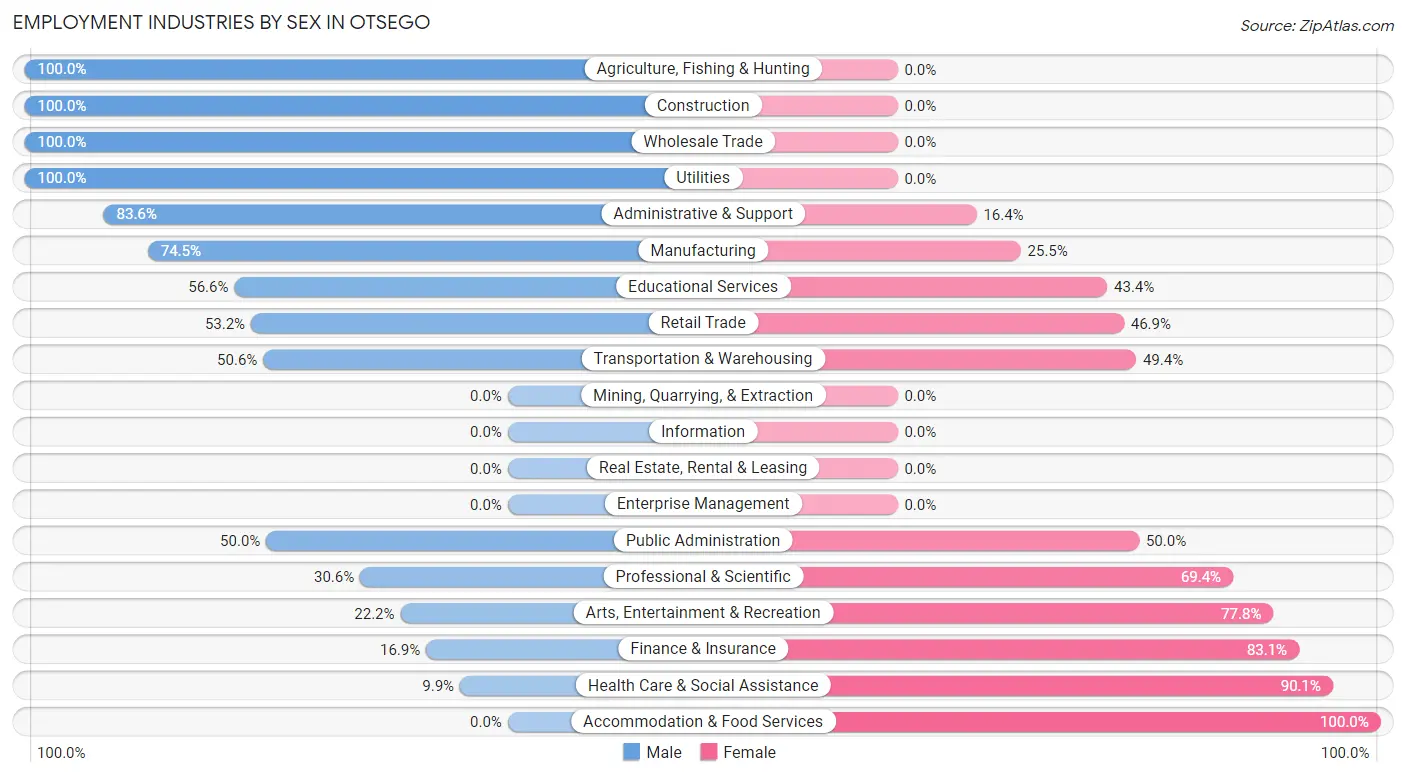
Employment Industries by Sex in Otsego
The Otsego industries that see more men than women are Agriculture, Fishing & Hunting (100.0%), Construction (100.0%), and Wholesale Trade (100.0%), whereas the industries that tend to have a higher number of women are Accommodation & Food Services (100.0%), Health Care & Social Assistance (90.1%), and Finance & Insurance (83.1%).
| Industry | Male | Female |
| Agriculture, Fishing & Hunting | 12 (100.0%) | 0 (0.0%) |
| Mining, Quarrying, & Extraction | 0 (0.0%) | 0 (0.0%) |
| Construction | 86 (100.0%) | 0 (0.0%) |
| Manufacturing | 409 (74.5%) | 140 (25.5%) |
| Wholesale Trade | 37 (100.0%) | 0 (0.0%) |
| Retail Trade | 118 (53.1%) | 104 (46.9%) |
| Transportation & Warehousing | 41 (50.6%) | 40 (49.4%) |
| Utilities | 12 (100.0%) | 0 (0.0%) |
| Information | 0 (0.0%) | 0 (0.0%) |
| Finance & Insurance | 12 (16.9%) | 59 (83.1%) |
| Real Estate, Rental & Leasing | 0 (0.0%) | 0 (0.0%) |
| Professional & Scientific | 22 (30.6%) | 50 (69.4%) |
| Enterprise Management | 0 (0.0%) | 0 (0.0%) |
| Administrative & Support | 46 (83.6%) | 9 (16.4%) |
| Educational Services | 30 (56.6%) | 23 (43.4%) |
| Health Care & Social Assistance | 20 (9.9%) | 182 (90.1%) |
| Arts, Entertainment & Recreation | 8 (22.2%) | 28 (77.8%) |
| Accommodation & Food Services | 0 (0.0%) | 84 (100.0%) |
| Public Administration | 32 (50.0%) | 32 (50.0%) |
| Total | 916 (52.6%) | 824 (47.4%) |
Education in Otsego
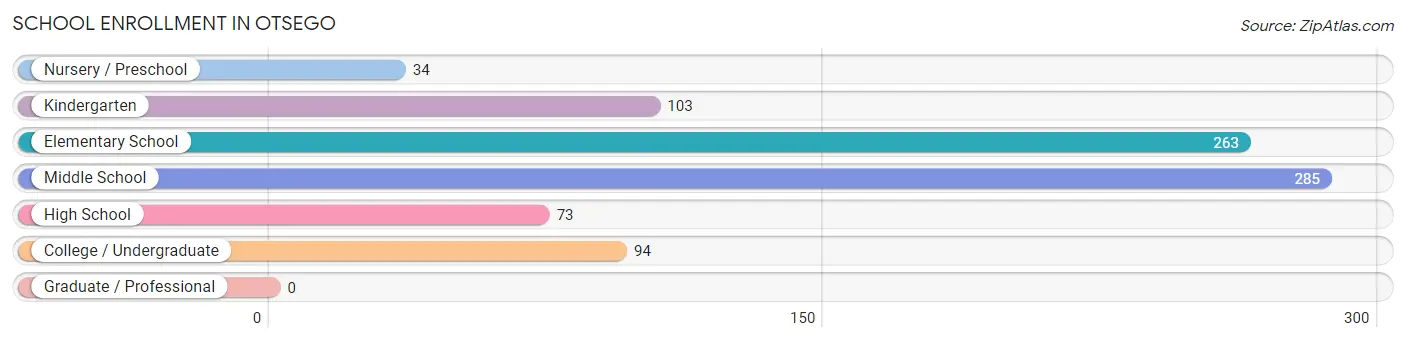
School Enrollment in Otsego
The most common levels of schooling among the 852 students in Otsego are middle school (285 | 33.5%), elementary school (263 | 30.9%), and kindergarten (103 | 12.1%).
| School Level | # Students | % Students |
| Nursery / Preschool | 34 | 4.0% |
| Kindergarten | 103 | 12.1% |
| Elementary School | 263 | 30.9% |
| Middle School | 285 | 33.5% |
| High School | 73 | 8.6% |
| College / Undergraduate | 94 | 11.0% |
| Graduate / Professional | 0 | 0.0% |
| Total | 852 | 100.0% |
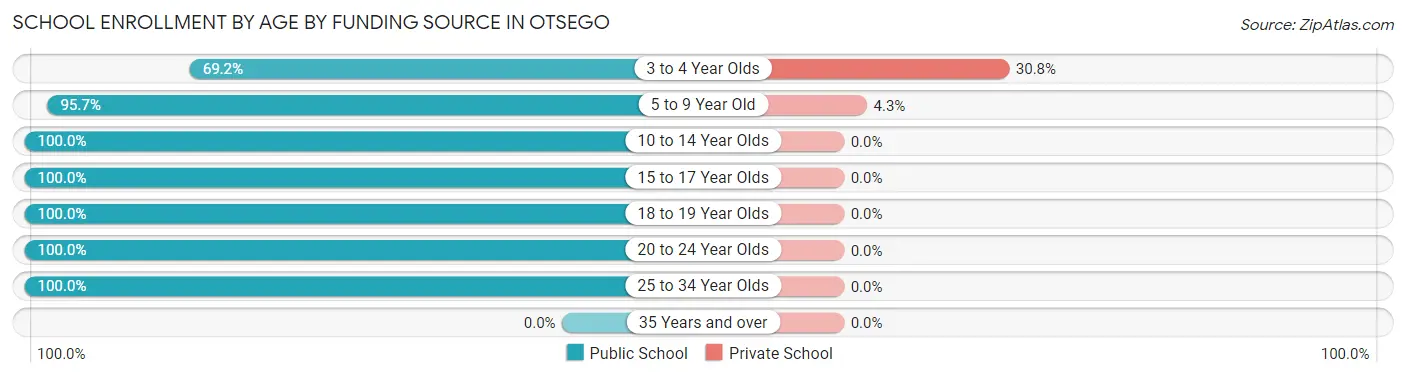
School Enrollment by Age by Funding Source in Otsego
Out of a total of 852 students who are enrolled in schools in Otsego, 26 (3.1%) attend a private institution, while the remaining 826 (96.9%) are enrolled in public schools. The age group of 3 to 4 year olds has the highest likelihood of being enrolled in private schools, with 12 (30.8% in the age bracket) enrolled. Conversely, the age group of 10 to 14 year olds has the lowest likelihood of being enrolled in a private school, with 329 (100.0% in the age bracket) attending a public institution.
| Age Bracket | Public School | Private School |
| 3 to 4 Year Olds | 27 (69.2%) | 12 (30.8%) |
| 5 to 9 Year Old | 314 (95.7%) | 14 (4.3%) |
| 10 to 14 Year Olds | 329 (100.0%) | 0 (0.0%) |
| 15 to 17 Year Olds | 19 (100.0%) | 0 (0.0%) |
| 18 to 19 Year Olds | 42 (100.0%) | 0 (0.0%) |
| 20 to 24 Year Olds | 57 (100.0%) | 0 (0.0%) |
| 25 to 34 Year Olds | 38 (100.0%) | 0 (0.0%) |
| 35 Years and over | 0 (0.0%) | 0 (0.0%) |
| Total | 826 (96.9%) | 26 (3.1%) |
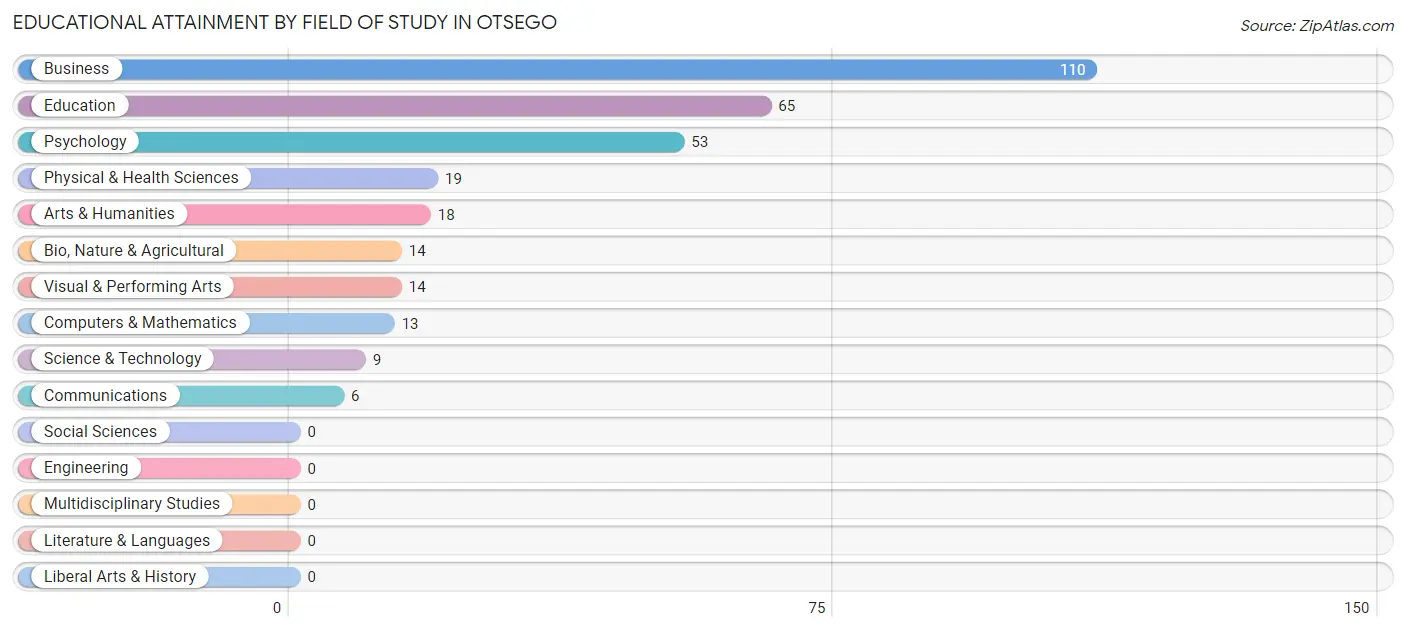
Educational Attainment by Field of Study in Otsego
Business (110 | 34.3%), education (65 | 20.3%), psychology (53 | 16.5%), physical & health sciences (19 | 5.9%), and arts & humanities (18 | 5.6%) are the most common fields of study among 321 individuals in Otsego who have obtained a bachelor's degree or higher.
| Field of Study | # Graduates | % Graduates |
| Computers & Mathematics | 13 | 4.1% |
| Bio, Nature & Agricultural | 14 | 4.4% |
| Physical & Health Sciences | 19 | 5.9% |
| Psychology | 53 | 16.5% |
| Social Sciences | 0 | 0.0% |
| Engineering | 0 | 0.0% |
| Multidisciplinary Studies | 0 | 0.0% |
| Science & Technology | 9 | 2.8% |
| Business | 110 | 34.3% |
| Education | 65 | 20.3% |
| Literature & Languages | 0 | 0.0% |
| Liberal Arts & History | 0 | 0.0% |
| Visual & Performing Arts | 14 | 4.4% |
| Communications | 6 | 1.9% |
| Arts & Humanities | 18 | 5.6% |
| Total | 321 | 100.0% |
Transportation & Commute in Otsego
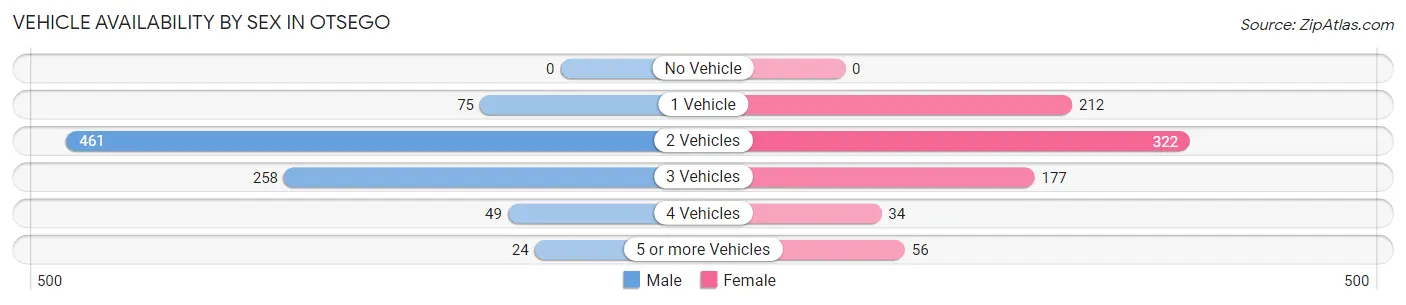
Vehicle Availability by Sex in Otsego
The most prevalent vehicle ownership categories in Otsego are males with 2 vehicles (461, accounting for 53.2%) and females with 2 vehicles (322, making up 57.6%).
| Vehicles Available | Male | Female |
| No Vehicle | 0 (0.0%) | 0 (0.0%) |
| 1 Vehicle | 75 (8.6%) | 212 (26.5%) |
| 2 Vehicles | 461 (53.2%) | 322 (40.2%) |
| 3 Vehicles | 258 (29.8%) | 177 (22.1%) |
| 4 Vehicles | 49 (5.7%) | 34 (4.2%) |
| 5 or more Vehicles | 24 (2.8%) | 56 (7.0%) |
| Total | 867 (100.0%) | 801 (100.0%) |
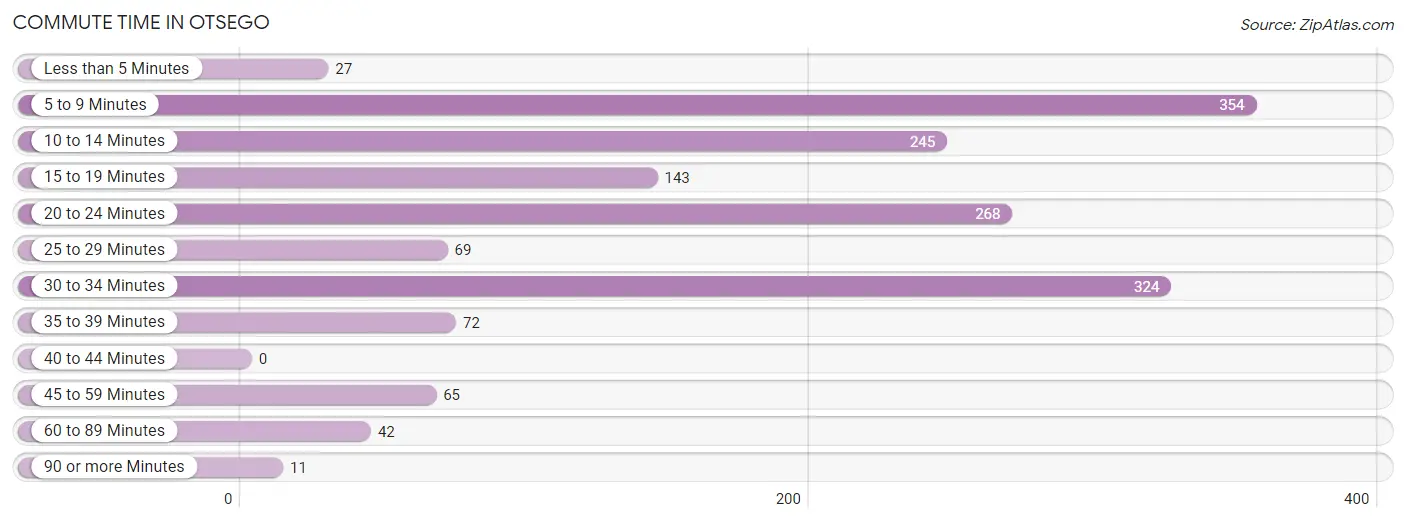
Commute Time in Otsego
The most frequently occuring commute durations in Otsego are 5 to 9 minutes (354 commuters, 21.8%), 30 to 34 minutes (324 commuters, 20.0%), and 20 to 24 minutes (268 commuters, 16.5%).
| Commute Time | # Commuters | % Commuters |
| Less than 5 Minutes | 27 | 1.7% |
| 5 to 9 Minutes | 354 | 21.8% |
| 10 to 14 Minutes | 245 | 15.1% |
| 15 to 19 Minutes | 143 | 8.8% |
| 20 to 24 Minutes | 268 | 16.5% |
| 25 to 29 Minutes | 69 | 4.3% |
| 30 to 34 Minutes | 324 | 20.0% |
| 35 to 39 Minutes | 72 | 4.4% |
| 40 to 44 Minutes | 0 | 0.0% |
| 45 to 59 Minutes | 65 | 4.0% |
| 60 to 89 Minutes | 42 | 2.6% |
| 90 or more Minutes | 11 | 0.7% |
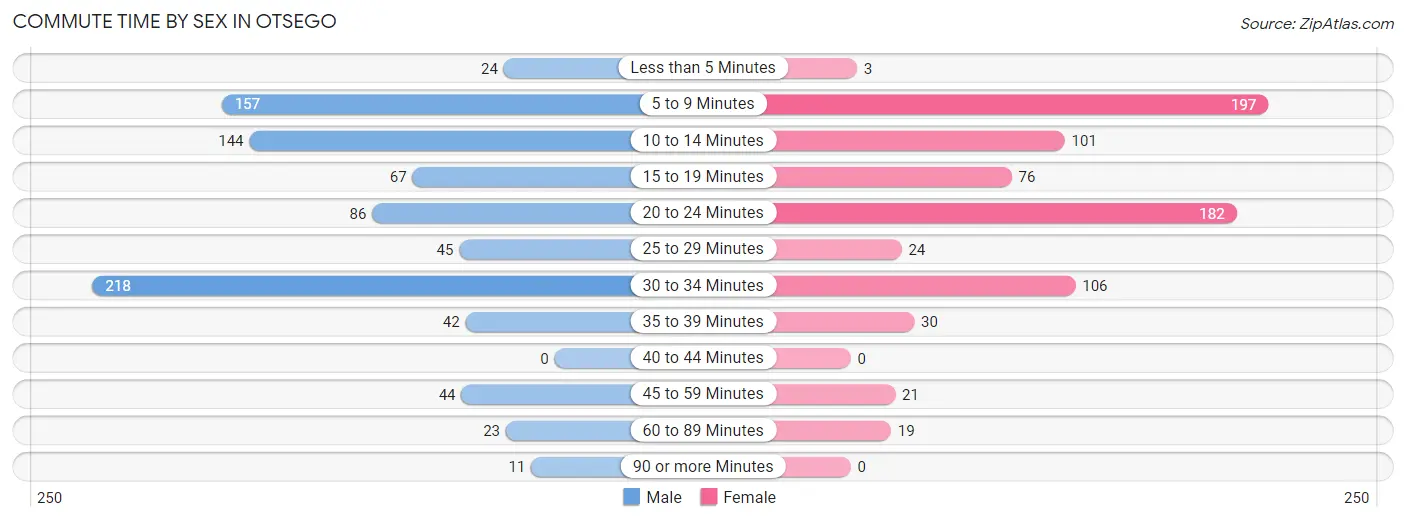
Commute Time by Sex in Otsego
The most common commute times in Otsego are 30 to 34 minutes (218 commuters, 25.3%) for males and 5 to 9 minutes (197 commuters, 26.0%) for females.
| Commute Time | Male | Female |
| Less than 5 Minutes | 24 (2.8%) | 3 (0.4%) |
| 5 to 9 Minutes | 157 (18.2%) | 197 (26.0%) |
| 10 to 14 Minutes | 144 (16.7%) | 101 (13.3%) |
| 15 to 19 Minutes | 67 (7.8%) | 76 (10.0%) |
| 20 to 24 Minutes | 86 (10.0%) | 182 (24.0%) |
| 25 to 29 Minutes | 45 (5.2%) | 24 (3.2%) |
| 30 to 34 Minutes | 218 (25.3%) | 106 (14.0%) |
| 35 to 39 Minutes | 42 (4.9%) | 30 (4.0%) |
| 40 to 44 Minutes | 0 (0.0%) | 0 (0.0%) |
| 45 to 59 Minutes | 44 (5.1%) | 21 (2.8%) |
| 60 to 89 Minutes | 23 (2.7%) | 19 (2.5%) |
| 90 or more Minutes | 11 (1.3%) | 0 (0.0%) |
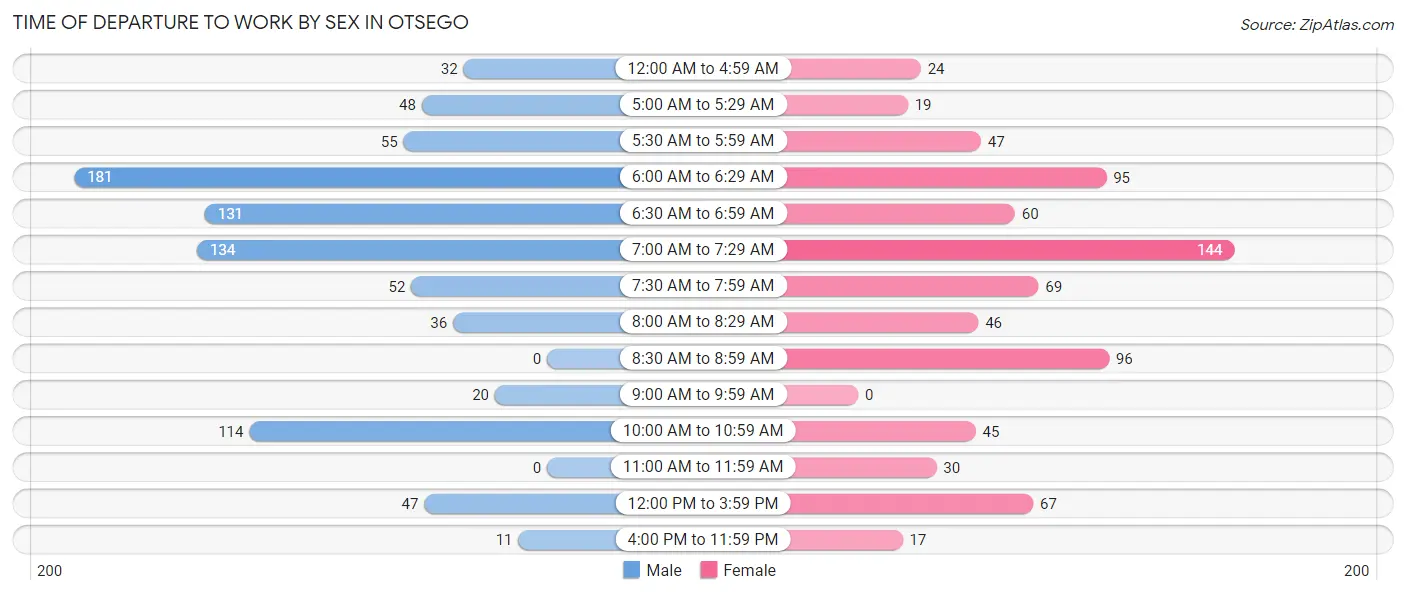
Time of Departure to Work by Sex in Otsego
The most frequent times of departure to work in Otsego are 6:00 AM to 6:29 AM (181, 21.0%) for males and 7:00 AM to 7:29 AM (144, 19.0%) for females.
| Time of Departure | Male | Female |
| 12:00 AM to 4:59 AM | 32 (3.7%) | 24 (3.2%) |
| 5:00 AM to 5:29 AM | 48 (5.6%) | 19 (2.5%) |
| 5:30 AM to 5:59 AM | 55 (6.4%) | 47 (6.2%) |
| 6:00 AM to 6:29 AM | 181 (21.0%) | 95 (12.5%) |
| 6:30 AM to 6:59 AM | 131 (15.2%) | 60 (7.9%) |
| 7:00 AM to 7:29 AM | 134 (15.6%) | 144 (19.0%) |
| 7:30 AM to 7:59 AM | 52 (6.0%) | 69 (9.1%) |
| 8:00 AM to 8:29 AM | 36 (4.2%) | 46 (6.1%) |
| 8:30 AM to 8:59 AM | 0 (0.0%) | 96 (12.7%) |
| 9:00 AM to 9:59 AM | 20 (2.3%) | 0 (0.0%) |
| 10:00 AM to 10:59 AM | 114 (13.2%) | 45 (5.9%) |
| 11:00 AM to 11:59 AM | 0 (0.0%) | 30 (4.0%) |
| 12:00 PM to 3:59 PM | 47 (5.5%) | 67 (8.8%) |
| 4:00 PM to 11:59 PM | 11 (1.3%) | 17 (2.2%) |
| Total | 861 (100.0%) | 759 (100.0%) |
Housing Occupancy in Otsego
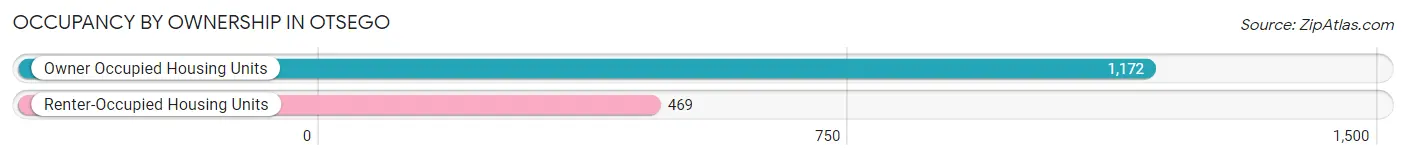
Occupancy by Ownership in Otsego
Of the total 1,641 dwellings in Otsego, owner-occupied units account for 1,172 (71.4%), while renter-occupied units make up 469 (28.6%).
| Occupancy | # Housing Units | % Housing Units |
| Owner Occupied Housing Units | 1,172 | 71.4% |
| Renter-Occupied Housing Units | 469 | 28.6% |
| Total Occupied Housing Units | 1,641 | 100.0% |
Occupancy by Household Size in Otsego
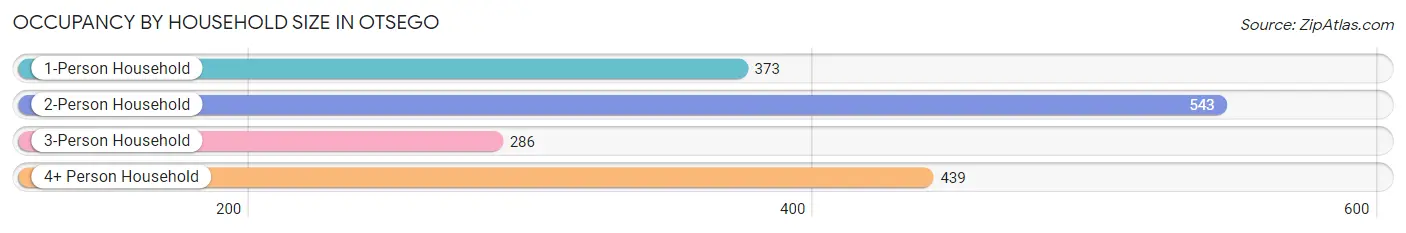
| Household Size | # Housing Units | % Housing Units |
| 1-Person Household | 373 | 22.7% |
| 2-Person Household | 543 | 33.1% |
| 3-Person Household | 286 | 17.4% |
| 4+ Person Household | 439 | 26.8% |
| Total Housing Units | 1,641 | 100.0% |
Occupancy by Ownership by Household Size in Otsego
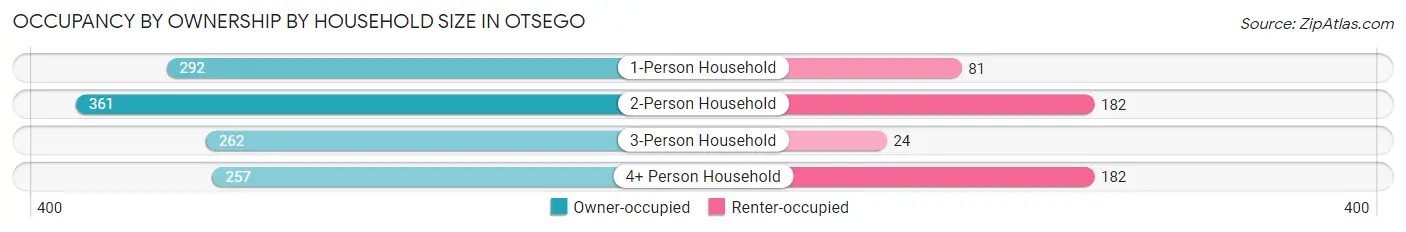
| Household Size | Owner-occupied | Renter-occupied |
| 1-Person Household | 292 (78.3%) | 81 (21.7%) |
| 2-Person Household | 361 (66.5%) | 182 (33.5%) |
| 3-Person Household | 262 (91.6%) | 24 (8.4%) |
| 4+ Person Household | 257 (58.5%) | 182 (41.5%) |
| Total Housing Units | 1,172 (71.4%) | 469 (28.6%) |
Occupancy by Educational Attainment in Otsego
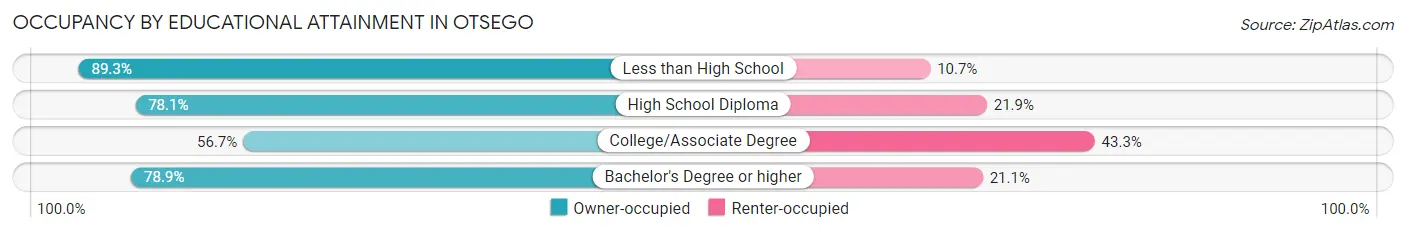
| Household Size | Owner-occupied | Renter-occupied |
| Less than High School | 225 (89.3%) | 27 (10.7%) |
| High School Diploma | 395 (78.1%) | 111 (21.9%) |
| College/Associate Degree | 369 (56.7%) | 282 (43.3%) |
| Bachelor's Degree or higher | 183 (78.9%) | 49 (21.1%) |
Occupancy by Age of Householder in Otsego
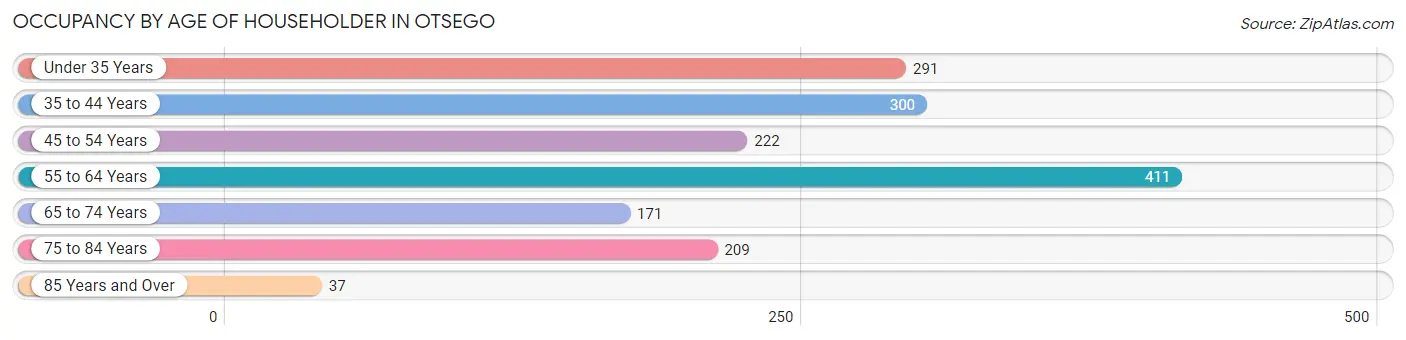
| Age Bracket | # Households | % Households |
| Under 35 Years | 291 | 17.7% |
| 35 to 44 Years | 300 | 18.3% |
| 45 to 54 Years | 222 | 13.5% |
| 55 to 64 Years | 411 | 25.1% |
| 65 to 74 Years | 171 | 10.4% |
| 75 to 84 Years | 209 | 12.7% |
| 85 Years and Over | 37 | 2.2% |
| Total | 1,641 | 100.0% |
Housing Finances in Otsego
Median Income by Occupancy in Otsego
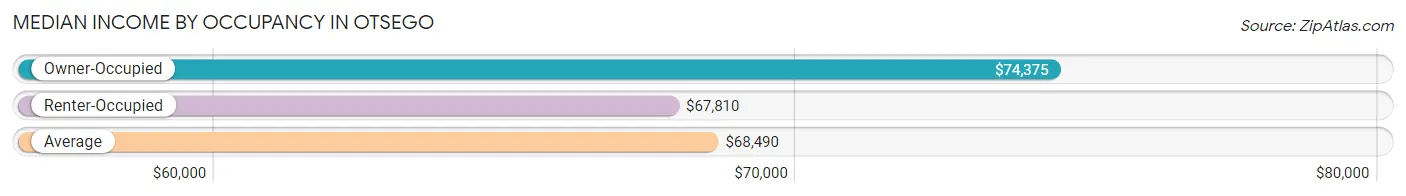
| Occupancy Type | # Households | Median Income |
| Owner-Occupied | 1,172 (71.4%) | $74,375 |
| Renter-Occupied | 469 (28.6%) | $67,810 |
| Average | 1,641 (100.0%) | $68,490 |
Occupancy by Householder Income Bracket in Otsego
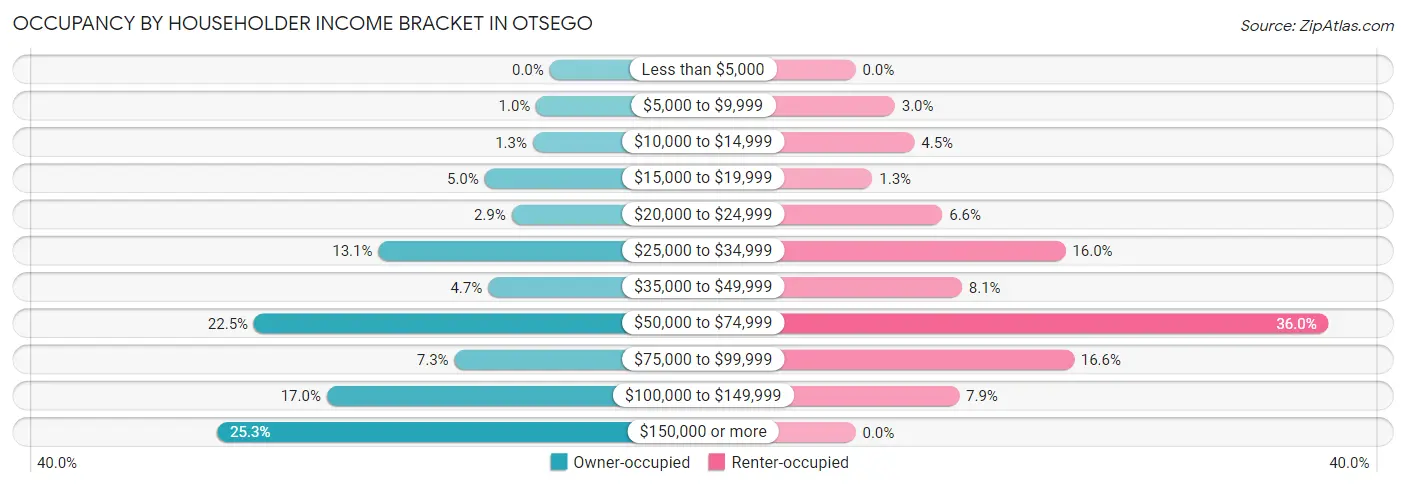
| Income Bracket | Owner-occupied | Renter-occupied |
| Less than $5,000 | 0 (0.0%) | 0 (0.0%) |
| $5,000 to $9,999 | 12 (1.0%) | 14 (3.0%) |
| $10,000 to $14,999 | 15 (1.3%) | 21 (4.5%) |
| $15,000 to $19,999 | 58 (5.0%) | 6 (1.3%) |
| $20,000 to $24,999 | 34 (2.9%) | 31 (6.6%) |
| $25,000 to $34,999 | 153 (13.1%) | 75 (16.0%) |
| $35,000 to $49,999 | 55 (4.7%) | 38 (8.1%) |
| $50,000 to $74,999 | 264 (22.5%) | 169 (36.0%) |
| $75,000 to $99,999 | 85 (7.2%) | 78 (16.6%) |
| $100,000 to $149,999 | 199 (17.0%) | 37 (7.9%) |
| $150,000 or more | 297 (25.3%) | 0 (0.0%) |
| Total | 1,172 (100.0%) | 469 (100.0%) |
Monthly Housing Cost Tiers in Otsego
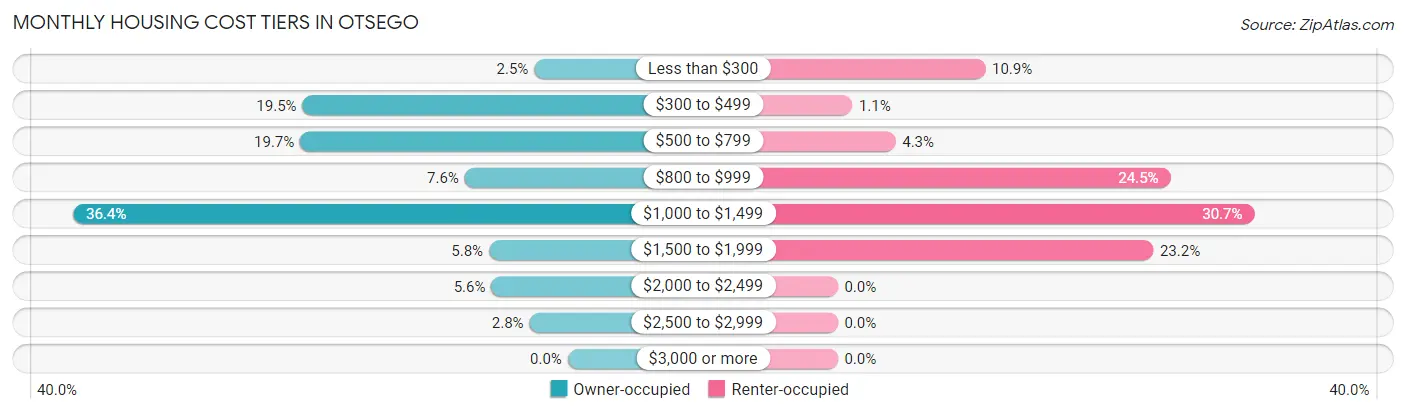
| Monthly Cost | Owner-occupied | Renter-occupied |
| Less than $300 | 29 (2.5%) | 51 (10.9%) |
| $300 to $499 | 229 (19.5%) | 5 (1.1%) |
| $500 to $799 | 231 (19.7%) | 20 (4.3%) |
| $800 to $999 | 89 (7.6%) | 115 (24.5%) |
| $1,000 to $1,499 | 427 (36.4%) | 144 (30.7%) |
| $1,500 to $1,999 | 68 (5.8%) | 109 (23.2%) |
| $2,000 to $2,499 | 66 (5.6%) | 0 (0.0%) |
| $2,500 to $2,999 | 33 (2.8%) | 0 (0.0%) |
| $3,000 or more | 0 (0.0%) | 0 (0.0%) |
| Total | 1,172 (100.0%) | 469 (100.0%) |
Physical Housing Characteristics in Otsego
Housing Structures in Otsego
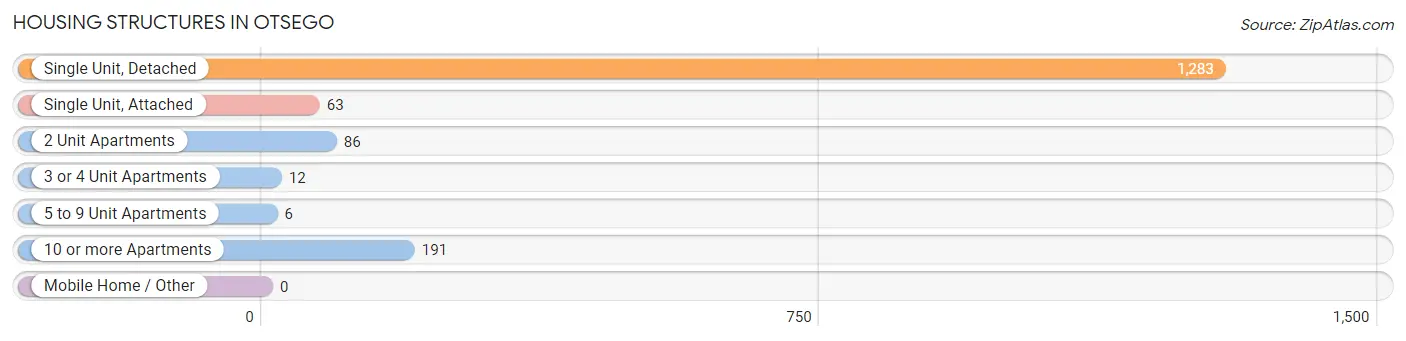
| Structure Type | # Housing Units | % Housing Units |
| Single Unit, Detached | 1,283 | 78.2% |
| Single Unit, Attached | 63 | 3.8% |
| 2 Unit Apartments | 86 | 5.2% |
| 3 or 4 Unit Apartments | 12 | 0.7% |
| 5 to 9 Unit Apartments | 6 | 0.4% |
| 10 or more Apartments | 191 | 11.6% |
| Mobile Home / Other | 0 | 0.0% |
| Total | 1,641 | 100.0% |
Housing Structures by Occupancy in Otsego
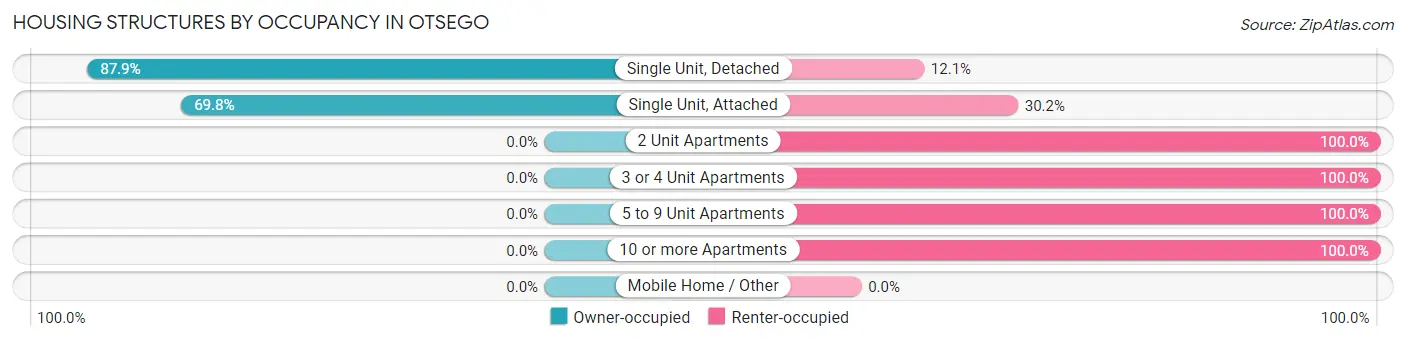
| Structure Type | Owner-occupied | Renter-occupied |
| Single Unit, Detached | 1,128 (87.9%) | 155 (12.1%) |
| Single Unit, Attached | 44 (69.8%) | 19 (30.2%) |
| 2 Unit Apartments | 0 (0.0%) | 86 (100.0%) |
| 3 or 4 Unit Apartments | 0 (0.0%) | 12 (100.0%) |
| 5 to 9 Unit Apartments | 0 (0.0%) | 6 (100.0%) |
| 10 or more Apartments | 0 (0.0%) | 191 (100.0%) |
| Mobile Home / Other | 0 (0.0%) | 0 (0.0%) |
| Total | 1,172 (71.4%) | 469 (28.6%) |
Housing Structures by Number of Rooms in Otsego
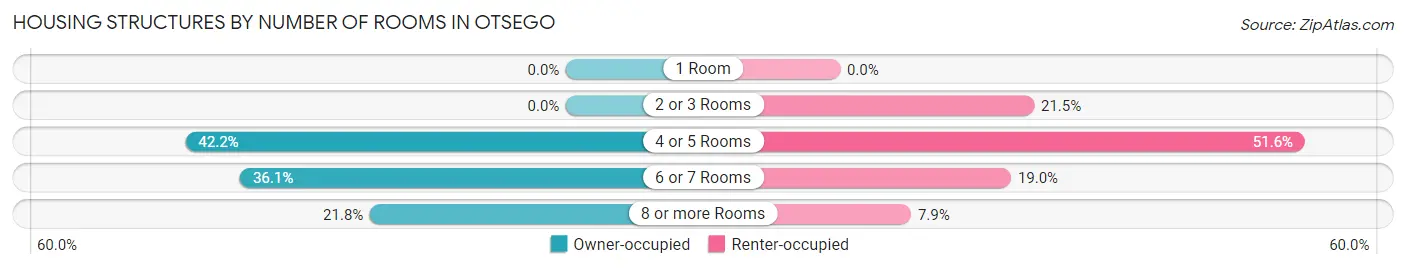
| Number of Rooms | Owner-occupied | Renter-occupied |
| 1 Room | 0 (0.0%) | 0 (0.0%) |
| 2 or 3 Rooms | 0 (0.0%) | 101 (21.5%) |
| 4 or 5 Rooms | 494 (42.1%) | 242 (51.6%) |
| 6 or 7 Rooms | 423 (36.1%) | 89 (19.0%) |
| 8 or more Rooms | 255 (21.8%) | 37 (7.9%) |
| Total | 1,172 (100.0%) | 469 (100.0%) |
Housing Structure by Heating Type in Otsego
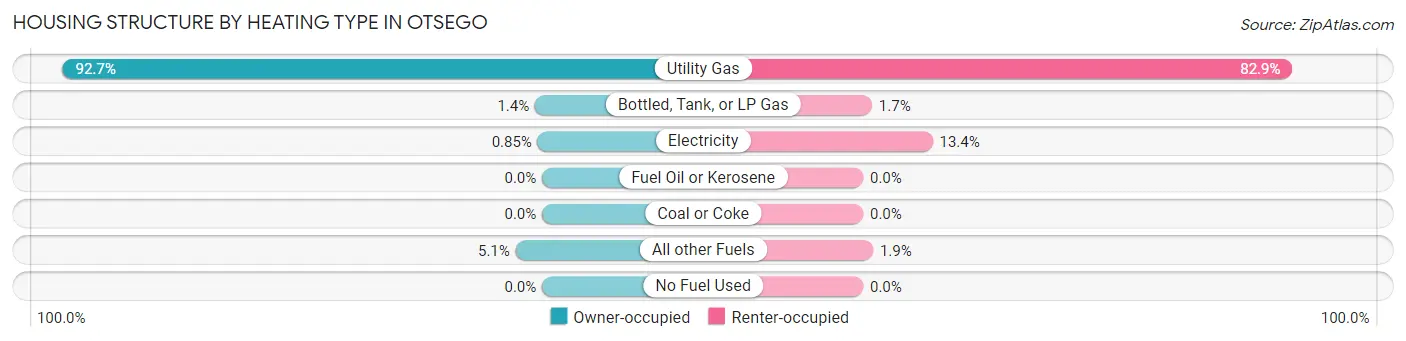
| Heating Type | Owner-occupied | Renter-occupied |
| Utility Gas | 1,086 (92.7%) | 389 (82.9%) |
| Bottled, Tank, or LP Gas | 16 (1.4%) | 8 (1.7%) |
| Electricity | 10 (0.9%) | 63 (13.4%) |
| Fuel Oil or Kerosene | 0 (0.0%) | 0 (0.0%) |
| Coal or Coke | 0 (0.0%) | 0 (0.0%) |
| All other Fuels | 60 (5.1%) | 9 (1.9%) |
| No Fuel Used | 0 (0.0%) | 0 (0.0%) |
| Total | 1,172 (100.0%) | 469 (100.0%) |
Household Vehicle Usage in Otsego
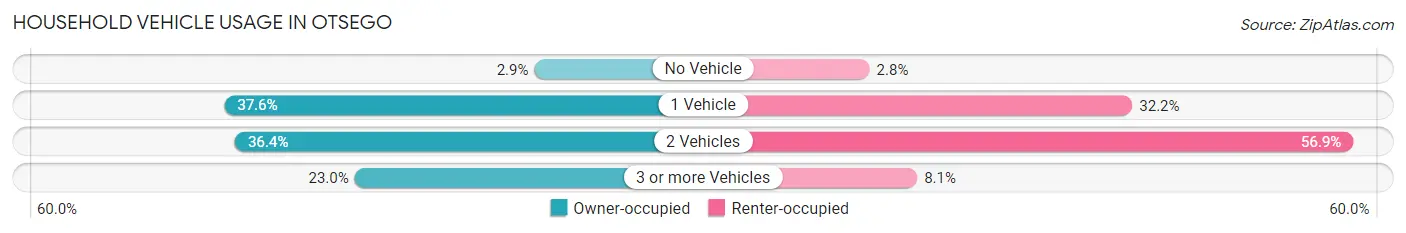
| Vehicles per Household | Owner-occupied | Renter-occupied |
| No Vehicle | 34 (2.9%) | 13 (2.8%) |
| 1 Vehicle | 441 (37.6%) | 151 (32.2%) |
| 2 Vehicles | 427 (36.4%) | 267 (56.9%) |
| 3 or more Vehicles | 270 (23.0%) | 38 (8.1%) |
| Total | 1,172 (100.0%) | 469 (100.0%) |
Real Estate & Mortgages in Otsego
Real Estate and Mortgage Overview in Otsego
| Characteristic | Without Mortgage | With Mortgage |
| Housing Units | 392 | 780 |
| Median Property Value | $108,900 | $172,200 |
| Median Household Income | $50,389 | $286 |
| Monthly Housing Costs | $469 | $0 |
| Real Estate Taxes | $2,132 | $73 |
Property Value by Mortgage Status in Otsego
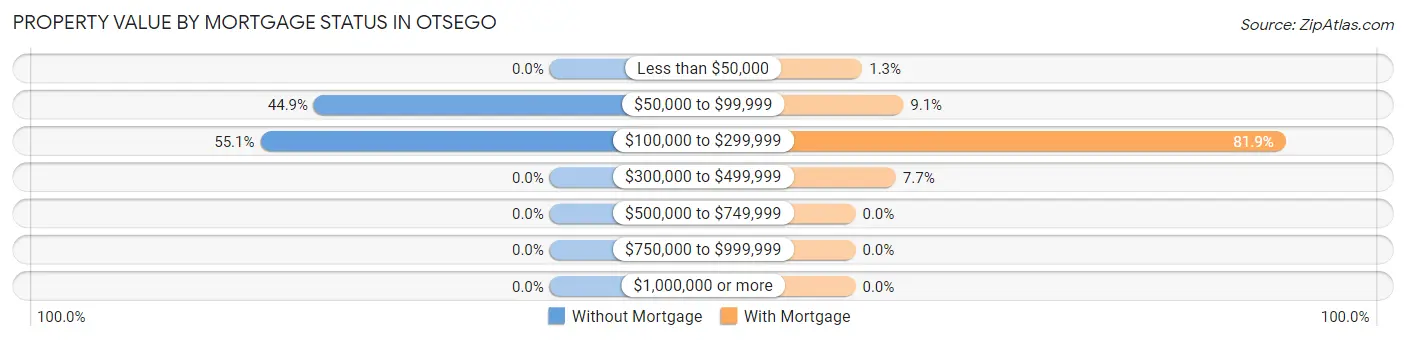
| Property Value | Without Mortgage | With Mortgage |
| Less than $50,000 | 0 (0.0%) | 10 (1.3%) |
| $50,000 to $99,999 | 176 (44.9%) | 71 (9.1%) |
| $100,000 to $299,999 | 216 (55.1%) | 639 (81.9%) |
| $300,000 to $499,999 | 0 (0.0%) | 60 (7.7%) |
| $500,000 to $749,999 | 0 (0.0%) | 0 (0.0%) |
| $750,000 to $999,999 | 0 (0.0%) | 0 (0.0%) |
| $1,000,000 or more | 0 (0.0%) | 0 (0.0%) |
| Total | 392 (100.0%) | 780 (100.0%) |
Household Income by Mortgage Status in Otsego
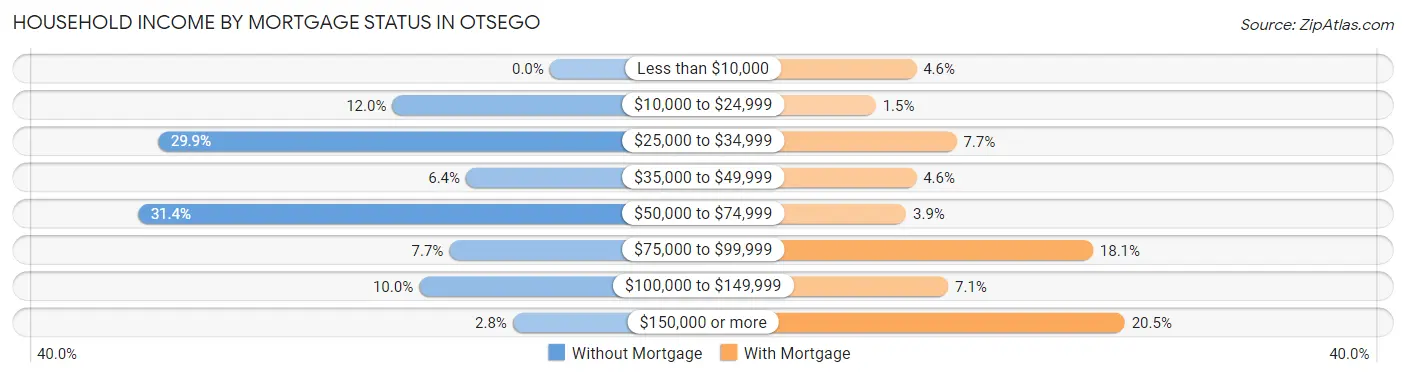
| Household Income | Without Mortgage | With Mortgage |
| Less than $10,000 | 0 (0.0%) | 36 (4.6%) |
| $10,000 to $24,999 | 47 (12.0%) | 12 (1.5%) |
| $25,000 to $34,999 | 117 (29.8%) | 60 (7.7%) |
| $35,000 to $49,999 | 25 (6.4%) | 36 (4.6%) |
| $50,000 to $74,999 | 123 (31.4%) | 30 (3.8%) |
| $75,000 to $99,999 | 30 (7.6%) | 141 (18.1%) |
| $100,000 to $149,999 | 39 (10.0%) | 55 (7.0%) |
| $150,000 or more | 11 (2.8%) | 160 (20.5%) |
| Total | 392 (100.0%) | 780 (100.0%) |
Property Value to Household Income Ratio in Otsego
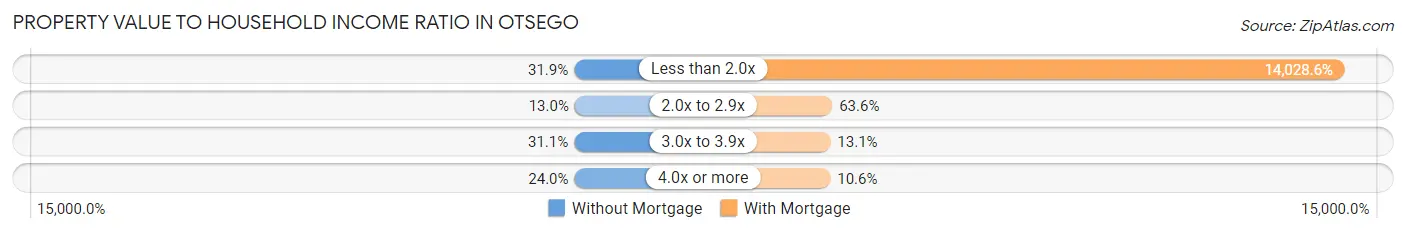
| Value-to-Income Ratio | Without Mortgage | With Mortgage |
| Less than 2.0x | 125 (31.9%) | 109,423 (14,028.6%) |
| 2.0x to 2.9x | 51 (13.0%) | 496 (63.6%) |
| 3.0x to 3.9x | 122 (31.1%) | 102 (13.1%) |
| 4.0x or more | 94 (24.0%) | 83 (10.6%) |
| Total | 392 (100.0%) | 780 (100.0%) |
Real Estate Taxes by Mortgage Status in Otsego
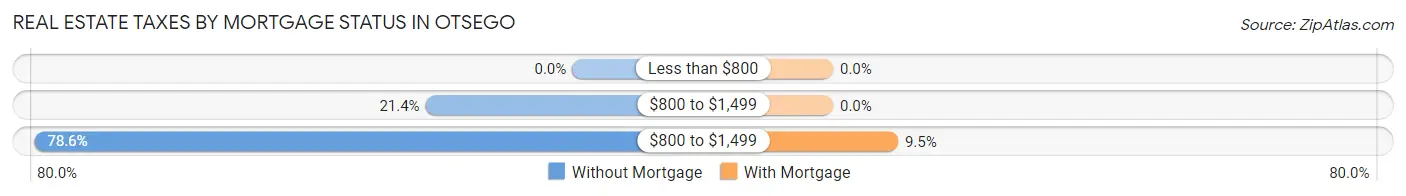
| Property Taxes | Without Mortgage | With Mortgage |
| Less than $800 | 0 (0.0%) | 0 (0.0%) |
| $800 to $1,499 | 84 (21.4%) | 0 (0.0%) |
| $800 to $1,499 | 308 (78.6%) | 74 (9.5%) |
| Total | 392 (100.0%) | 780 (100.0%) |
Health & Disability in Otsego
Health Insurance Coverage by Age in Otsego
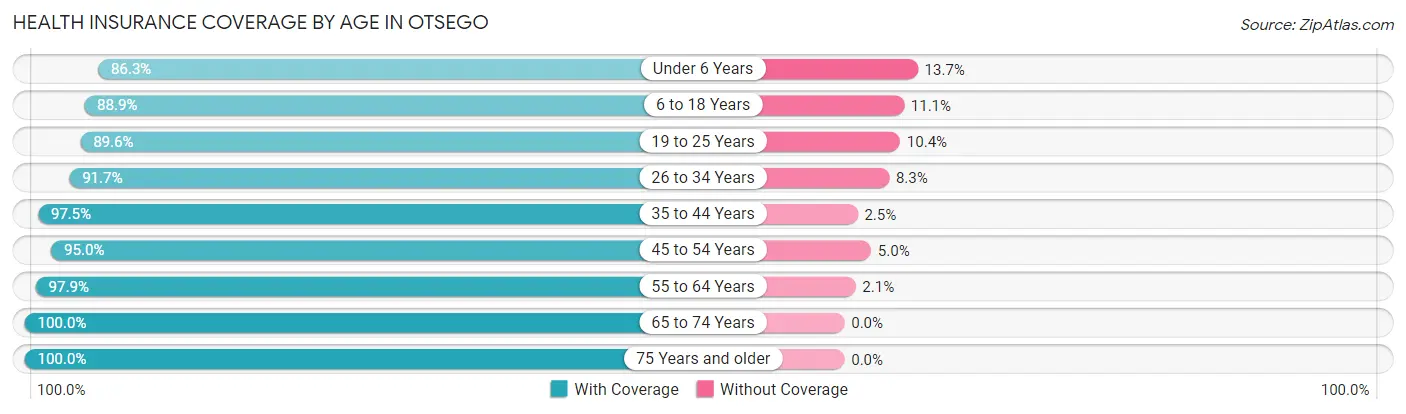
| Age Bracket | With Coverage | Without Coverage |
| Under 6 Years | 202 (86.3%) | 32 (13.7%) |
| 6 to 18 Years | 600 (88.9%) | 75 (11.1%) |
| 19 to 25 Years | 311 (89.6%) | 36 (10.4%) |
| 26 to 34 Years | 341 (91.7%) | 31 (8.3%) |
| 35 to 44 Years | 635 (97.5%) | 16 (2.5%) |
| 45 to 54 Years | 345 (95.0%) | 18 (5.0%) |
| 55 to 64 Years | 806 (97.9%) | 17 (2.1%) |
| 65 to 74 Years | 236 (100.0%) | 0 (0.0%) |
| 75 Years and older | 382 (100.0%) | 0 (0.0%) |
| Total | 3,858 (94.5%) | 225 (5.5%) |
Health Insurance Coverage by Citizenship Status in Otsego
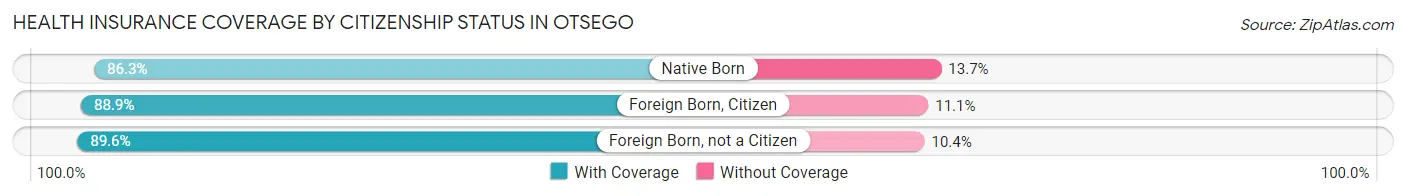
| Citizenship Status | With Coverage | Without Coverage |
| Native Born | 202 (86.3%) | 32 (13.7%) |
| Foreign Born, Citizen | 600 (88.9%) | 75 (11.1%) |
| Foreign Born, not a Citizen | 311 (89.6%) | 36 (10.4%) |
Health Insurance Coverage by Household Income in Otsego
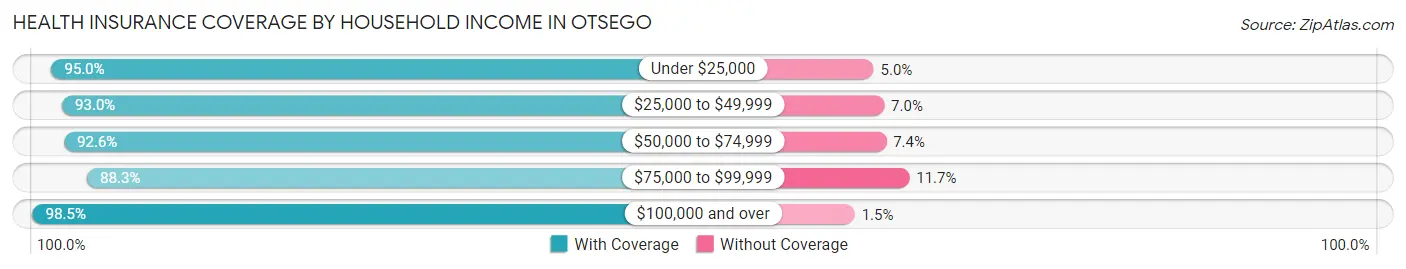
| Household Income | With Coverage | Without Coverage |
| Under $25,000 | 303 (95.0%) | 16 (5.0%) |
| $25,000 to $49,999 | 425 (93.0%) | 32 (7.0%) |
| $50,000 to $74,999 | 1,117 (92.6%) | 89 (7.4%) |
| $75,000 to $99,999 | 490 (88.3%) | 65 (11.7%) |
| $100,000 and over | 1,519 (98.5%) | 23 (1.5%) |
Public vs Private Health Insurance Coverage by Age in Otsego
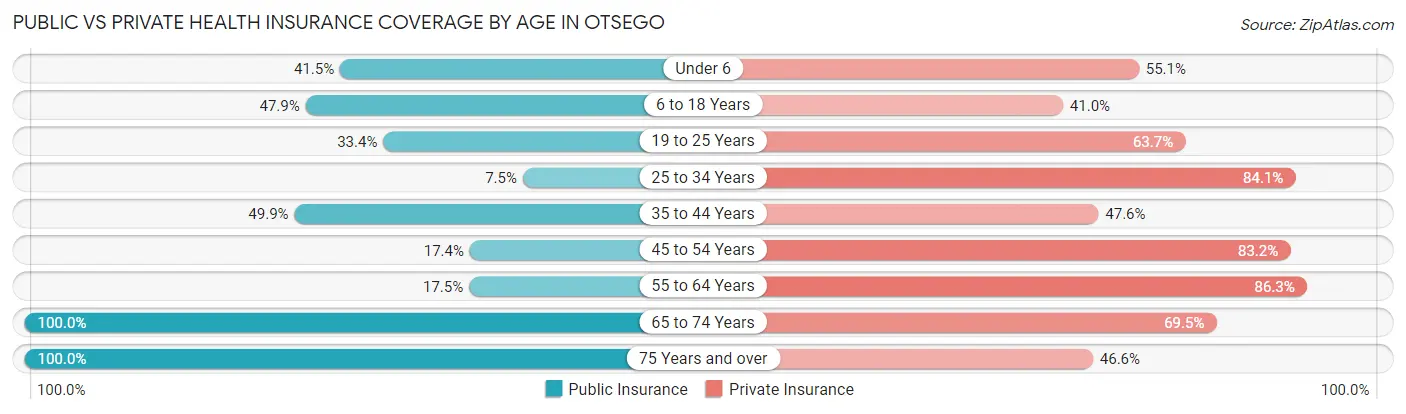
| Age Bracket | Public Insurance | Private Insurance |
| Under 6 | 97 (41.4%) | 129 (55.1%) |
| 6 to 18 Years | 323 (47.8%) | 277 (41.0%) |
| 19 to 25 Years | 116 (33.4%) | 221 (63.7%) |
| 25 to 34 Years | 28 (7.5%) | 313 (84.1%) |
| 35 to 44 Years | 325 (49.9%) | 310 (47.6%) |
| 45 to 54 Years | 63 (17.4%) | 302 (83.2%) |
| 55 to 64 Years | 144 (17.5%) | 710 (86.3%) |
| 65 to 74 Years | 236 (100.0%) | 164 (69.5%) |
| 75 Years and over | 382 (100.0%) | 178 (46.6%) |
| Total | 1,714 (42.0%) | 2,604 (63.8%) |
Disability Status by Sex by Age in Otsego
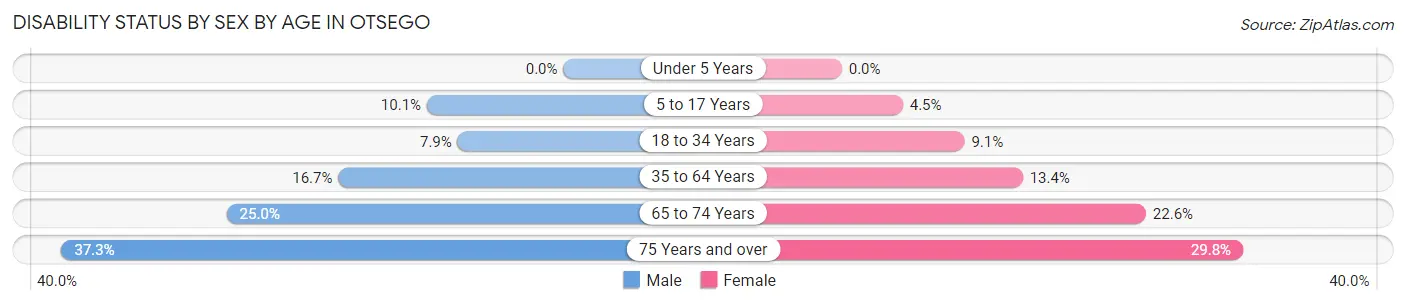
| Age Bracket | Male | Female |
| Under 5 Years | 0 (0.0%) | 0 (0.0%) |
| 5 to 17 Years | 38 (10.1%) | 14 (4.5%) |
| 18 to 34 Years | 26 (7.9%) | 42 (9.1%) |
| 35 to 64 Years | 129 (16.7%) | 143 (13.4%) |
| 65 to 74 Years | 28 (25.0%) | 28 (22.6%) |
| 75 Years and over | 41 (37.3%) | 81 (29.8%) |
Disability Class by Sex by Age in Otsego
Disability Class: Hearing Difficulty
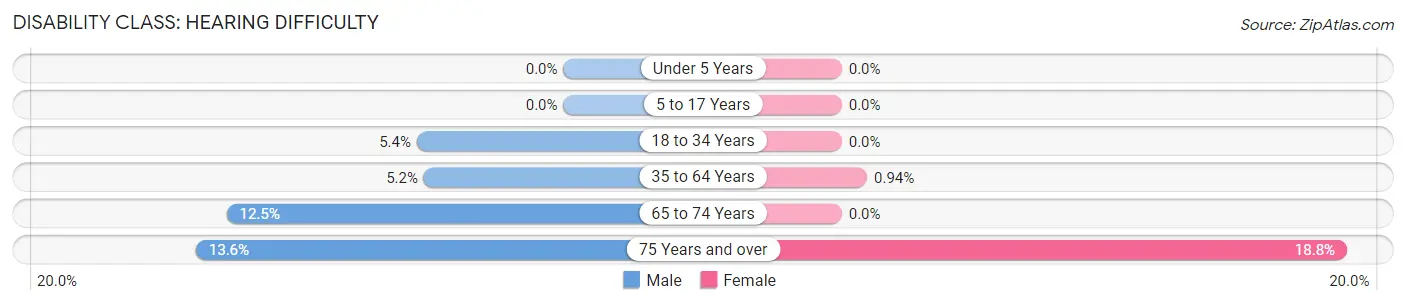
| Age Bracket | Male | Female |
| Under 5 Years | 0 (0.0%) | 0 (0.0%) |
| 5 to 17 Years | 0 (0.0%) | 0 (0.0%) |
| 18 to 34 Years | 18 (5.4%) | 0 (0.0%) |
| 35 to 64 Years | 40 (5.2%) | 10 (0.9%) |
| 65 to 74 Years | 14 (12.5%) | 0 (0.0%) |
| 75 Years and over | 15 (13.6%) | 51 (18.8%) |
Disability Class: Vision Difficulty
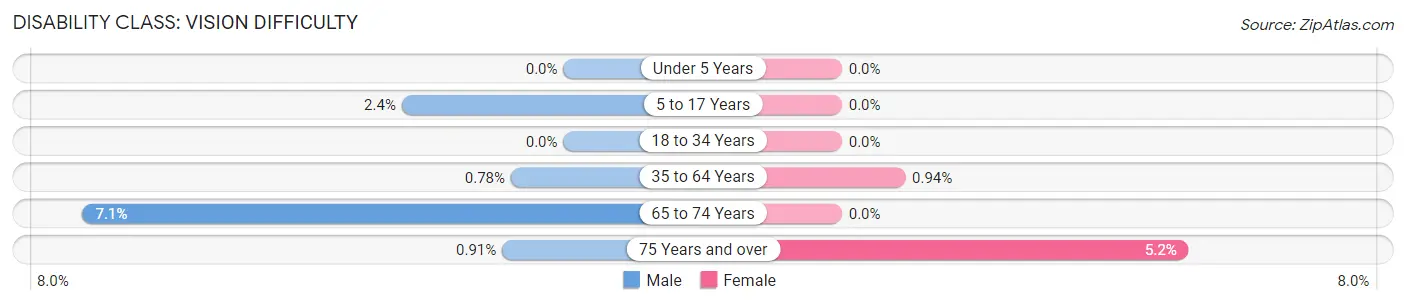
| Age Bracket | Male | Female |
| Under 5 Years | 0 (0.0%) | 0 (0.0%) |
| 5 to 17 Years | 9 (2.4%) | 0 (0.0%) |
| 18 to 34 Years | 0 (0.0%) | 0 (0.0%) |
| 35 to 64 Years | 6 (0.8%) | 10 (0.9%) |
| 65 to 74 Years | 8 (7.1%) | 0 (0.0%) |
| 75 Years and over | 1 (0.9%) | 14 (5.1%) |
Disability Class: Cognitive Difficulty
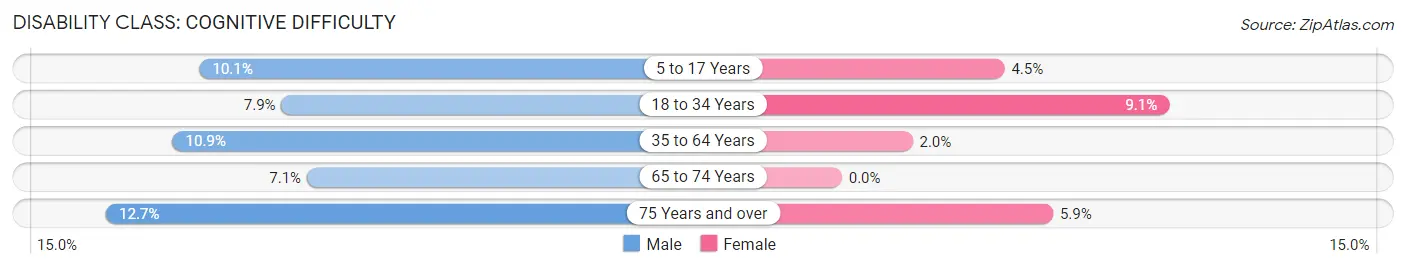
| Age Bracket | Male | Female |
| 5 to 17 Years | 38 (10.1%) | 14 (4.5%) |
| 18 to 34 Years | 26 (7.9%) | 42 (9.1%) |
| 35 to 64 Years | 84 (10.9%) | 21 (2.0%) |
| 65 to 74 Years | 8 (7.1%) | 0 (0.0%) |
| 75 Years and over | 14 (12.7%) | 16 (5.9%) |
Disability Class: Ambulatory Difficulty
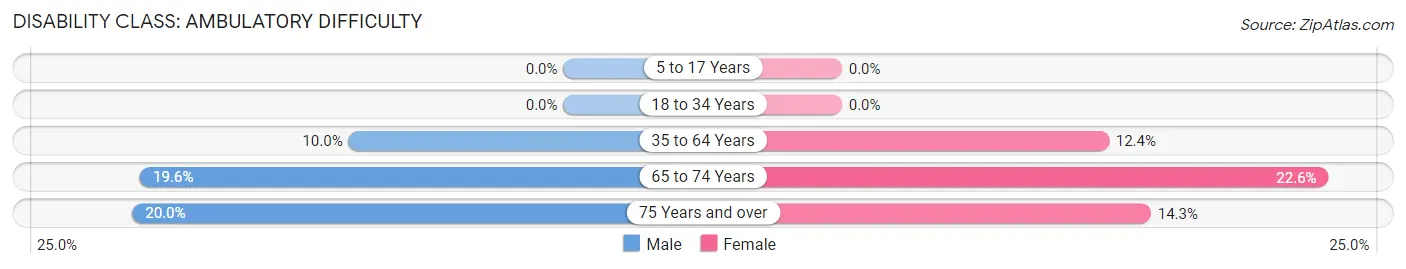
| Age Bracket | Male | Female |
| 5 to 17 Years | 0 (0.0%) | 0 (0.0%) |
| 18 to 34 Years | 0 (0.0%) | 0 (0.0%) |
| 35 to 64 Years | 77 (10.0%) | 132 (12.4%) |
| 65 to 74 Years | 22 (19.6%) | 28 (22.6%) |
| 75 Years and over | 22 (20.0%) | 39 (14.3%) |
Disability Class: Self-Care Difficulty
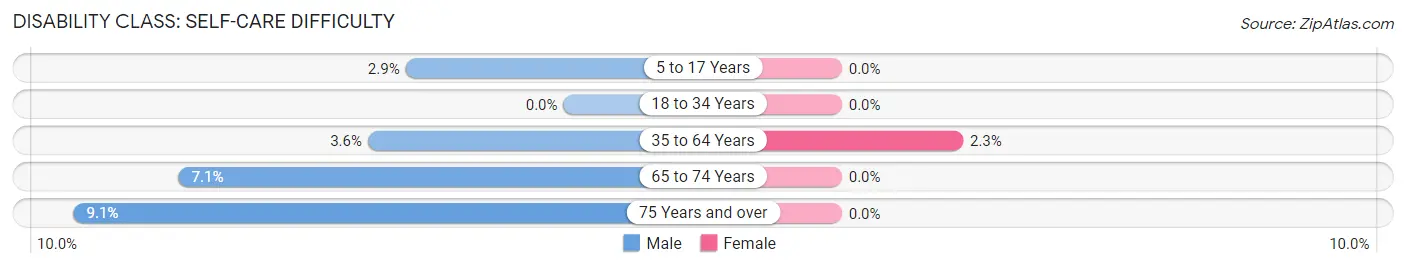
| Age Bracket | Male | Female |
| 5 to 17 Years | 11 (2.9%) | 0 (0.0%) |
| 18 to 34 Years | 0 (0.0%) | 0 (0.0%) |
| 35 to 64 Years | 28 (3.6%) | 24 (2.2%) |
| 65 to 74 Years | 8 (7.1%) | 0 (0.0%) |
| 75 Years and over | 10 (9.1%) | 0 (0.0%) |
Technology Access in Otsego
Computing Device Access in Otsego
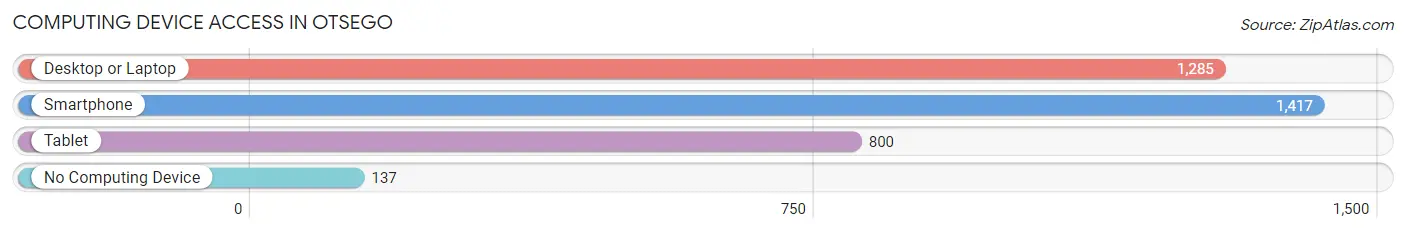
| Device Type | # Households | % Households |
| Desktop or Laptop | 1,285 | 78.3% |
| Smartphone | 1,417 | 86.4% |
| Tablet | 800 | 48.7% |
| No Computing Device | 137 | 8.4% |
| Total | 1,641 | 100.0% |
Internet Access in Otsego
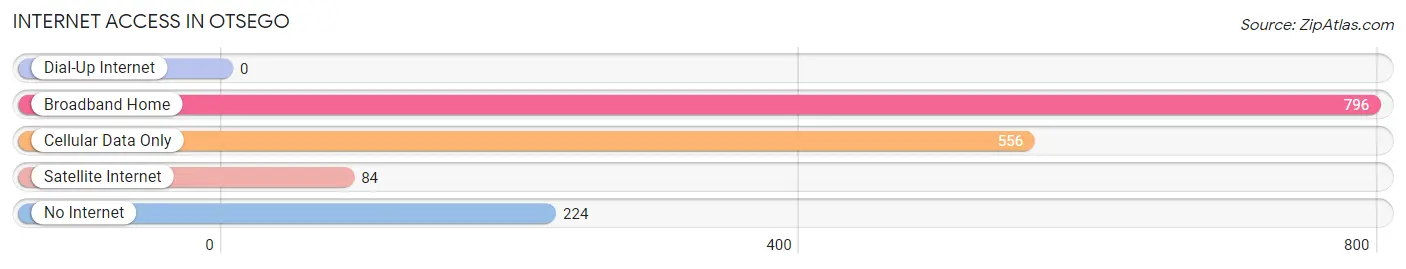
| Internet Type | # Households | % Households |
| Dial-Up Internet | 0 | 0.0% |
| Broadband Home | 796 | 48.5% |
| Cellular Data Only | 556 | 33.9% |
| Satellite Internet | 84 | 5.1% |
| No Internet | 224 | 13.7% |
| Total | 1,641 | 100.0% |
Otsego Summary
Otsego is a city located in the state of Michigan in the United States. It is located in the county of Otsego and is part of the Grand Rapids-Wyoming Metropolitan Statistical Area. The city has a population of approximately 4,000 people and is located in the northern part of the state.
History
Otsego was first settled in 1837 by a group of settlers from New York. The city was named after the Otsego County in New York. The settlers were attracted to the area due to its fertile soil and abundant natural resources. The city was incorporated in 1867 and has since grown to become a thriving community.
Geography
Otsego is located in the northern part of Michigan, in the county of Otsego. It is situated on the banks of the Kalamazoo River and is surrounded by rolling hills and forests. The city is located approximately 30 miles north of Grand Rapids and is part of the Grand Rapids-Wyoming Metropolitan Statistical Area.
Economy
Otsego’s economy is largely based on agriculture and manufacturing. The city is home to several large agricultural operations, including dairy farms, fruit orchards, and vegetable farms. The city is also home to several manufacturing companies, including automotive parts suppliers, furniture makers, and food processing plants.
Demographics
As of the 2010 census, the population of Otsego was 4,000. The racial makeup of the city was 95.3% White, 0.7% African American, 0.3% Native American, 0.7% Asian, 0.1% Pacific Islander, 1.2% from other races, and 1.9% from two or more races. Hispanic or Latino of any race were 3.2% of the population.
The median income for a household in the city was $41,250, and the median income for a family was $50,000. The per capita income for the city was $20,845. About 11.2% of families and 14.2% of the population were below the poverty line, including 19.2% of those under age 18 and 8.2% of those age 65 or over.
Conclusion
Otsego is a city located in the northern part of Michigan. It has a population of approximately 4,000 people and is part of the Grand Rapids-Wyoming Metropolitan Statistical Area. The city’s economy is largely based on agriculture and manufacturing, and the city is home to several large agricultural operations and manufacturing companies. The racial makeup of the city is predominantly White, with a small percentage of African American, Native American, Asian, and Pacific Islander residents. The median income for a household in the city is $41,250, and the per capita income is $20,845.
Common Questions
What is Per Capita Income in Otsego?
Per Capita income in Otsego is $29,059.
What is the Median Family Income in Otsego?
Median Family Income in Otsego is $77,591.
What is the Median Household income in Otsego?
Median Household Income in Otsego is $68,490.
What is Income or Wage Gap in Otsego?
Income or Wage Gap in Otsego is 54.2%.
Women in Otsego earn 45.8 cents for every dollar earned by a man.
What is Inequality or Gini Index in Otsego?
Inequality or Gini Index in Otsego is 0.37.
What is the Total Population of Otsego?
Total Population of Otsego is 4,083.
What is the Total Male Population of Otsego?
Total Male Population of Otsego is 1,778.
What is the Total Female Population of Otsego?
Total Female Population of Otsego is 2,305.
What is the Ratio of Males per 100 Females in Otsego?
There are 77.14 Males per 100 Females in Otsego.
What is the Ratio of Females per 100 Males in Otsego?
There are 129.64 Females per 100 Males in Otsego.
What is the Median Population Age in Otsego?
Median Population Age in Otsego is 40.1 Years.
What is the Average Family Size in Otsego
Average Family Size in Otsego is 2.9 People.
What is the Average Household Size in Otsego
Average Household Size in Otsego is 2.5 People.
How Large is the Labor Force in Otsego?
There are 1,889 People in the Labor Forcein in Otsego.
What is the Percentage of People in the Labor Force in Otsego?
57.7% of People are in the Labor Force in Otsego.
What is the Unemployment Rate in Otsego?
Unemployment Rate in Otsego is 7.8%.