Trenton, MI Map & Demographics
Trenton Map
Trenton Overview
$45,167
PER CAPITA INCOME
$101,766
AVG FAMILY INCOME
$74,267
AVG HOUSEHOLD INCOME
43.8%
WAGE / INCOME GAP [ % ]
56.2¢/ $1
WAGE / INCOME GAP [ $ ]
0.45
INEQUALITY / GINI INDEX
18,420
TOTAL POPULATION
9,013
MALE POPULATION
9,407
FEMALE POPULATION
95.81
MALES / 100 FEMALES
104.37
FEMALES / 100 MALES
49.1
MEDIAN AGE
3.0
AVG FAMILY SIZE
2.3
AVG HOUSEHOLD SIZE
8,841
LABOR FORCE [ PEOPLE ]
57.5%
PERCENT IN LABOR FORCE
3.3%
UNEMPLOYMENT RATE
Trenton Zip Codes
Trenton Area Codes
Income in Trenton
Income Overview in Trenton
Per Capita Income in Trenton is $45,167, while median incomes of families and households are $101,766 and $74,267 respectively.
| Characteristic | Number | Measure |
| Per Capita Income | 18,420 | $45,167 |
| Median Family Income | 4,926 | $101,766 |
| Mean Family Income | 4,926 | $119,791 |
| Median Household Income | 8,053 | $74,267 |
| Mean Household Income | 8,053 | $98,918 |
| Income Deficit | 4,926 | $0 |
| Wage / Income Gap (%) | 18,420 | 43.77% |
| Wage / Income Gap ($) | 18,420 | 56.23¢ per $1 |
| Gini / Inequality Index | 18,420 | 0.45 |
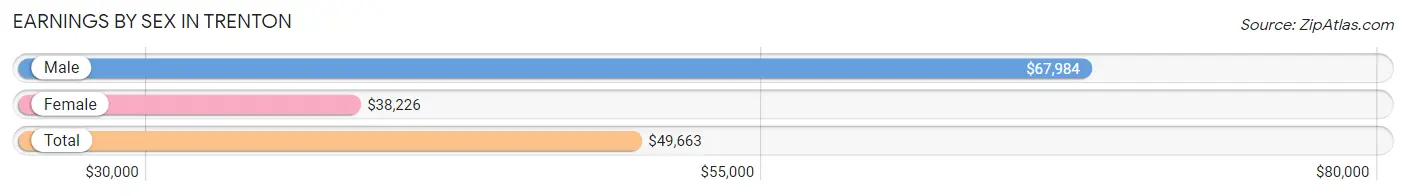
Earnings by Sex in Trenton
Average Earnings in Trenton are $49,663, $67,984 for men and $38,226 for women, a difference of 43.8%.
| Sex | Number | Average Earnings |
| Male | 4,766 (50.5%) | $67,984 |
| Female | 4,676 (49.5%) | $38,226 |
| Total | 9,442 (100.0%) | $49,663 |
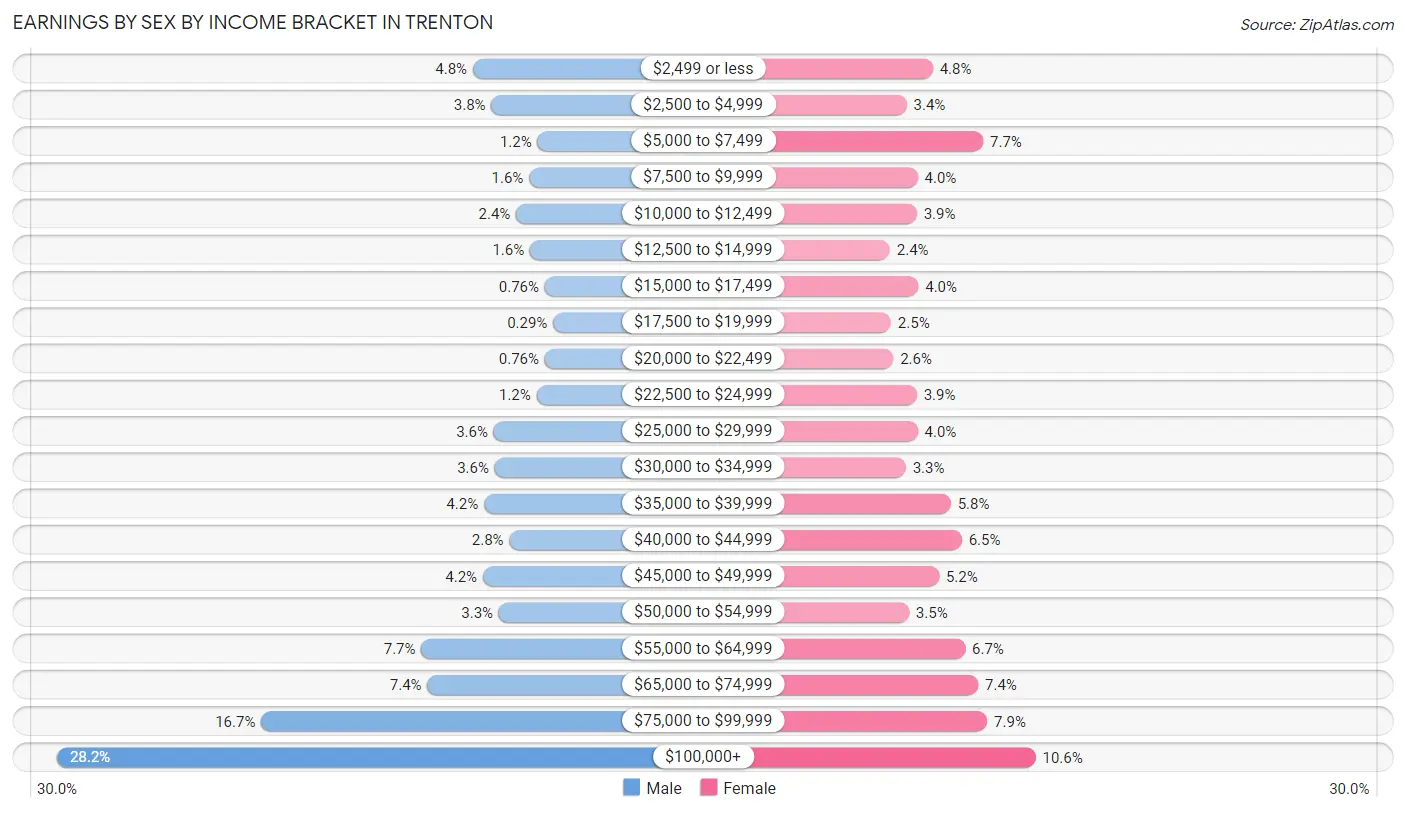
Earnings by Sex by Income Bracket in Trenton
The most common earnings brackets in Trenton are $100,000+ for men (1,343 | 28.2%) and $100,000+ for women (496 | 10.6%).
| Income | Male | Female |
| $2,499 or less | 229 (4.8%) | 226 (4.8%) |
| $2,500 to $4,999 | 179 (3.8%) | 157 (3.4%) |
| $5,000 to $7,499 | 56 (1.2%) | 358 (7.7%) |
| $7,500 to $9,999 | 78 (1.6%) | 186 (4.0%) |
| $10,000 to $12,499 | 113 (2.4%) | 184 (3.9%) |
| $12,500 to $14,999 | 76 (1.6%) | 113 (2.4%) |
| $15,000 to $17,499 | 36 (0.8%) | 188 (4.0%) |
| $17,500 to $19,999 | 14 (0.3%) | 116 (2.5%) |
| $20,000 to $22,499 | 36 (0.8%) | 122 (2.6%) |
| $22,500 to $24,999 | 58 (1.2%) | 184 (3.9%) |
| $25,000 to $29,999 | 173 (3.6%) | 186 (4.0%) |
| $30,000 to $34,999 | 170 (3.6%) | 155 (3.3%) |
| $35,000 to $39,999 | 199 (4.2%) | 273 (5.8%) |
| $40,000 to $44,999 | 131 (2.8%) | 302 (6.5%) |
| $45,000 to $49,999 | 202 (4.2%) | 242 (5.2%) |
| $50,000 to $54,999 | 159 (3.3%) | 163 (3.5%) |
| $55,000 to $64,999 | 367 (7.7%) | 311 (6.7%) |
| $65,000 to $74,999 | 351 (7.4%) | 345 (7.4%) |
| $75,000 to $99,999 | 796 (16.7%) | 369 (7.9%) |
| $100,000+ | 1,343 (28.2%) | 496 (10.6%) |
| Total | 4,766 (100.0%) | 4,676 (100.0%) |
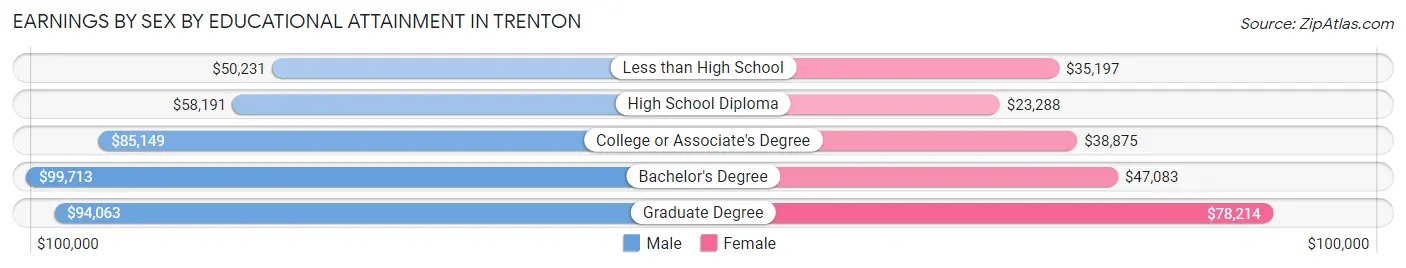
Earnings by Sex by Educational Attainment in Trenton
Average earnings in Trenton are $76,106 for men and $42,264 for women, a difference of 44.5%. Men with an educational attainment of bachelor's degree enjoy the highest average annual earnings of $99,713, while those with less than high school education earn the least with $50,231. Women with an educational attainment of graduate degree earn the most with the average annual earnings of $78,214, while those with high school diploma education have the smallest earnings of $23,288.
| Educational Attainment | Male Income | Female Income |
| Less than High School | $50,231 | $35,197 |
| High School Diploma | $58,191 | $23,288 |
| College or Associate's Degree | $85,149 | $38,875 |
| Bachelor's Degree | $99,713 | $47,083 |
| Graduate Degree | $94,063 | $78,214 |
| Total | $76,106 | $42,264 |
Family Income in Trenton
Family Income Brackets in Trenton
According to the Trenton family income data, there are 1,478 families falling into the $100,000 to $149,999 income range, which is the most common income bracket and makes up 30.0% of all families. Conversely, the $10,000 to $14,999 income bracket is the least frequent group with only 30 families (0.6%) belonging to this category.
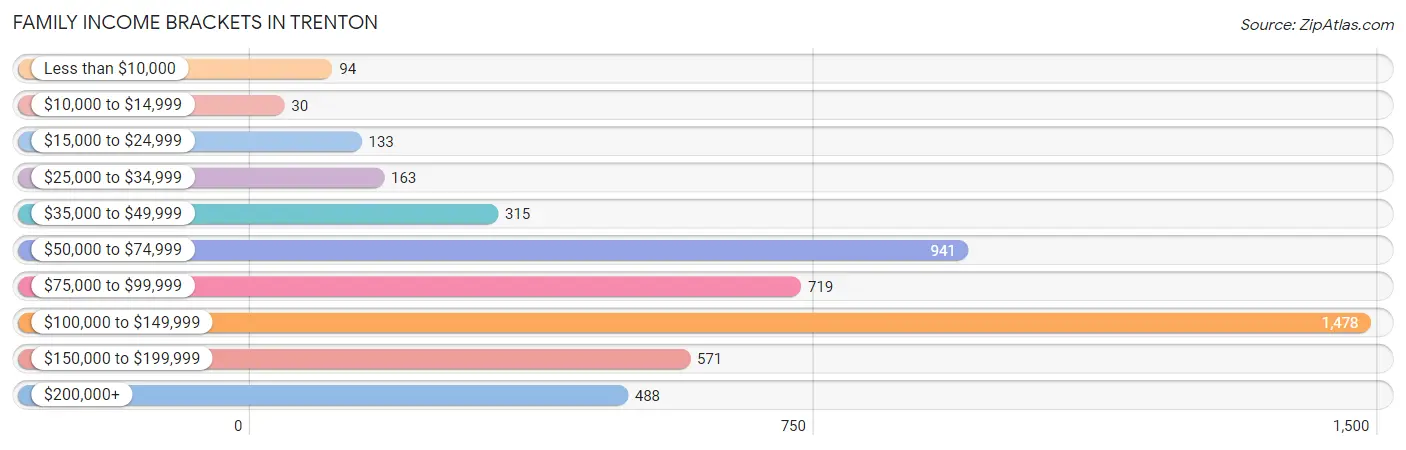
| Income Bracket | # Families | % Families |
| Less than $10,000 | 94 | 1.9% |
| $10,000 to $14,999 | 30 | 0.6% |
| $15,000 to $24,999 | 133 | 2.7% |
| $25,000 to $34,999 | 163 | 3.3% |
| $35,000 to $49,999 | 315 | 6.4% |
| $50,000 to $74,999 | 941 | 19.1% |
| $75,000 to $99,999 | 719 | 14.6% |
| $100,000 to $149,999 | 1,478 | 30.0% |
| $150,000 to $199,999 | 571 | 11.6% |
| $200,000+ | 488 | 9.9% |
Family Income by Famaliy Size in Trenton
7+ person families (43 | 0.9%) account for the highest median family income in Trenton with $193,320 per family, while 3-person families (1,346 | 27.3%) have the highest median income of $39,028 per family member.
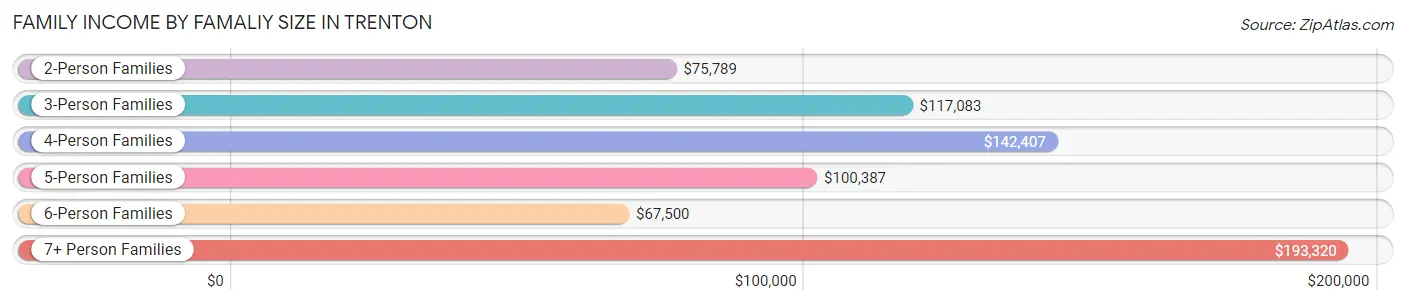
| Income Bracket | # Families | Median Income |
| 2-Person Families | 2,516 (51.1%) | $75,789 |
| 3-Person Families | 1,346 (27.3%) | $117,083 |
| 4-Person Families | 666 (13.5%) | $142,407 |
| 5-Person Families | 303 (6.1%) | $100,387 |
| 6-Person Families | 52 (1.1%) | $67,500 |
| 7+ Person Families | 43 (0.9%) | $193,320 |
| Total | 4,926 (100.0%) | $101,766 |
Family Income by Number of Earners in Trenton
The median family income in Trenton is $101,766, with families comprising 3+ earners (671) having the highest median family income of $145,662, while families with no earners (1,054) have the lowest median family income of $65,000, accounting for 13.6% and 21.4% of families, respectively.
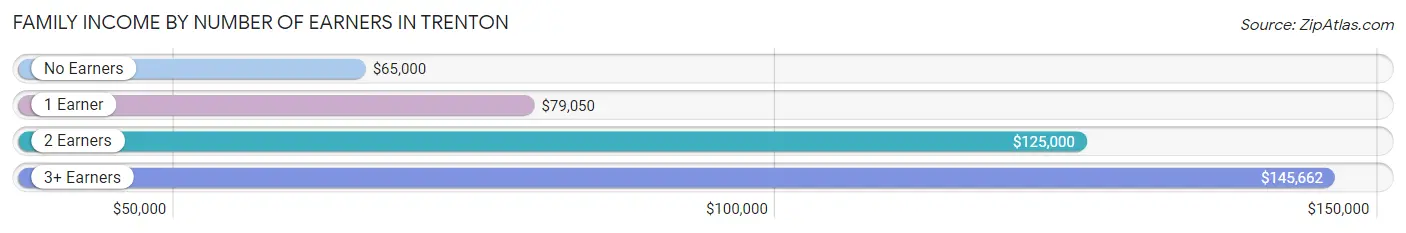
| Number of Earners | # Families | Median Income |
| No Earners | 1,054 (21.4%) | $65,000 |
| 1 Earner | 1,417 (28.8%) | $79,050 |
| 2 Earners | 1,784 (36.2%) | $125,000 |
| 3+ Earners | 671 (13.6%) | $145,662 |
| Total | 4,926 (100.0%) | $101,766 |
Household Income in Trenton
Household Income Brackets in Trenton
With 1,796 households falling in the category, the $100,000 to $149,999 income range is the most frequent in Trenton, accounting for 22.3% of all households. In contrast, only 145 households (1.8%) fall into the $10,000 to $14,999 income bracket, making it the least populous group.
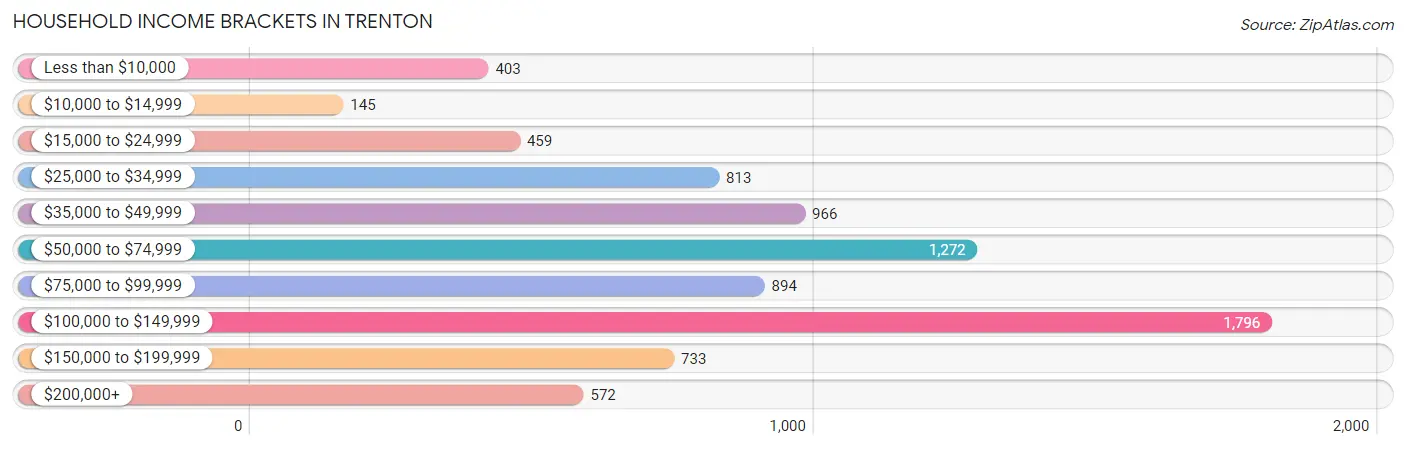
| Income Bracket | # Households | % Households |
| Less than $10,000 | 403 | 5.0% |
| $10,000 to $14,999 | 145 | 1.8% |
| $15,000 to $24,999 | 459 | 5.7% |
| $25,000 to $34,999 | 813 | 10.1% |
| $35,000 to $49,999 | 966 | 12.0% |
| $50,000 to $74,999 | 1,272 | 15.8% |
| $75,000 to $99,999 | 894 | 11.1% |
| $100,000 to $149,999 | 1,796 | 22.3% |
| $150,000 to $199,999 | 733 | 9.1% |
| $200,000+ | 572 | 7.1% |
Household Income by Householder Age in Trenton
The median household income in Trenton is $74,267, with the highest median household income of $105,000 found in the 25 to 44 years age bracket for the primary householder. A total of 1,630 households (20.2%) fall into this category. Meanwhile, the 65+ years age bracket for the primary householder has the lowest median household income of $47,888, with 3,135 households (38.9%) in this group.
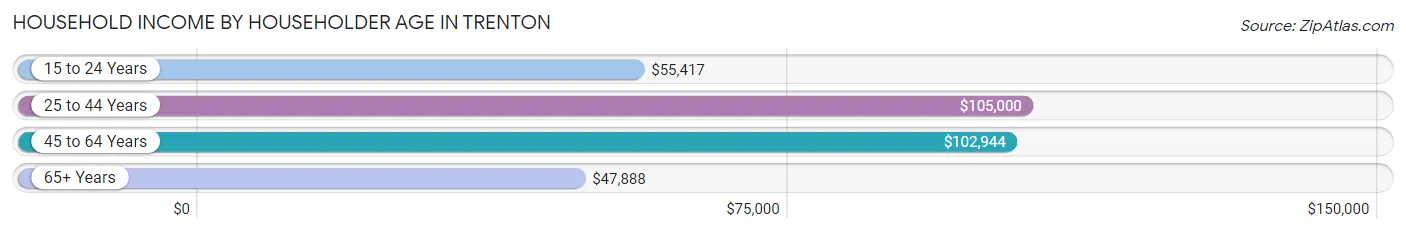
| Income Bracket | # Households | Median Income |
| 15 to 24 Years | 45 (0.6%) | $55,417 |
| 25 to 44 Years | 1,630 (20.2%) | $105,000 |
| 45 to 64 Years | 3,243 (40.3%) | $102,944 |
| 65+ Years | 3,135 (38.9%) | $47,888 |
| Total | 8,053 (100.0%) | $74,267 |
Poverty in Trenton
Income Below Poverty by Sex and Age in Trenton
With 5.7% poverty level for males and 7.8% for females among the residents of Trenton, 16 and 17 year old males and 75 year old and over females are the most vulnerable to poverty, with 42 males (16.3%) and 168 females (13.3%) in their respective age groups living below the poverty level.
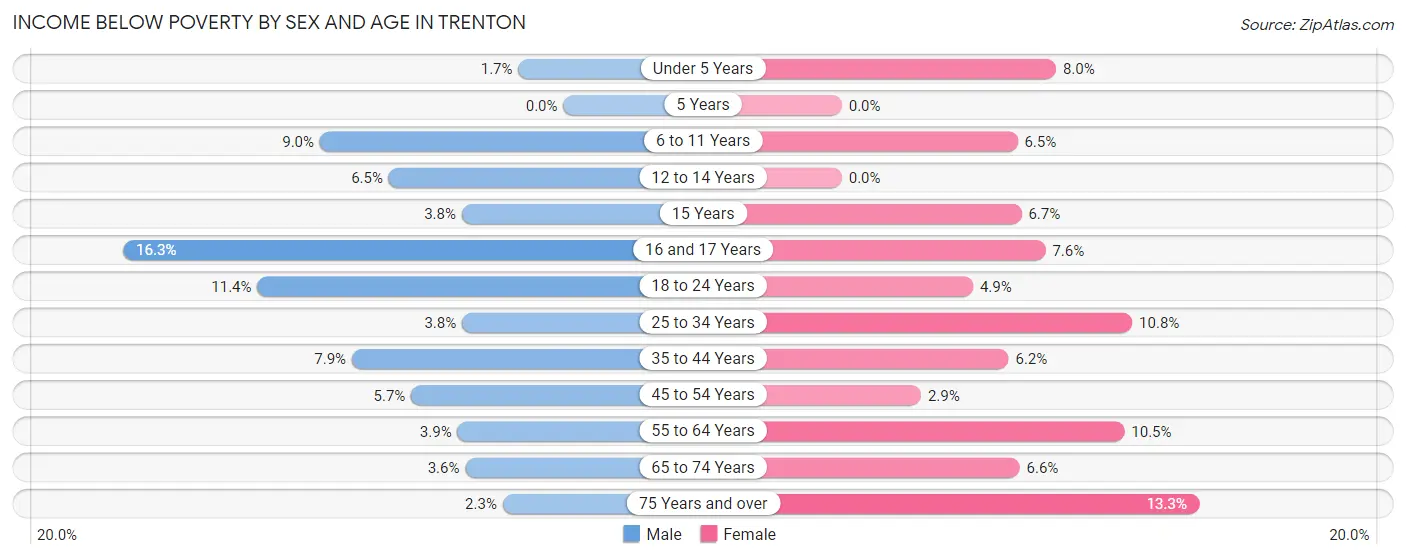
| Age Bracket | Male | Female |
| Under 5 Years | 8 (1.7%) | 24 (8.0%) |
| 5 Years | 0 (0.0%) | 0 (0.0%) |
| 6 to 11 Years | 61 (9.0%) | 29 (6.5%) |
| 12 to 14 Years | 26 (6.5%) | 0 (0.0%) |
| 15 Years | 6 (3.8%) | 10 (6.7%) |
| 16 and 17 Years | 42 (16.3%) | 22 (7.6%) |
| 18 to 24 Years | 75 (11.4%) | 25 (4.9%) |
| 25 to 34 Years | 32 (3.8%) | 86 (10.8%) |
| 35 to 44 Years | 66 (7.9%) | 63 (6.2%) |
| 45 to 54 Years | 82 (5.7%) | 34 (2.9%) |
| 55 to 64 Years | 55 (3.9%) | 171 (10.5%) |
| 65 to 74 Years | 38 (3.6%) | 89 (6.6%) |
| 75 Years and over | 15 (2.2%) | 168 (13.3%) |
| Total | 506 (5.7%) | 721 (7.8%) |
Income Above Poverty by Sex and Age in Trenton
According to the poverty statistics in Trenton, males aged 5 years and females aged 5 years are the age groups that are most secure financially, with 100.0% of males and 100.0% of females in these age groups living above the poverty line.
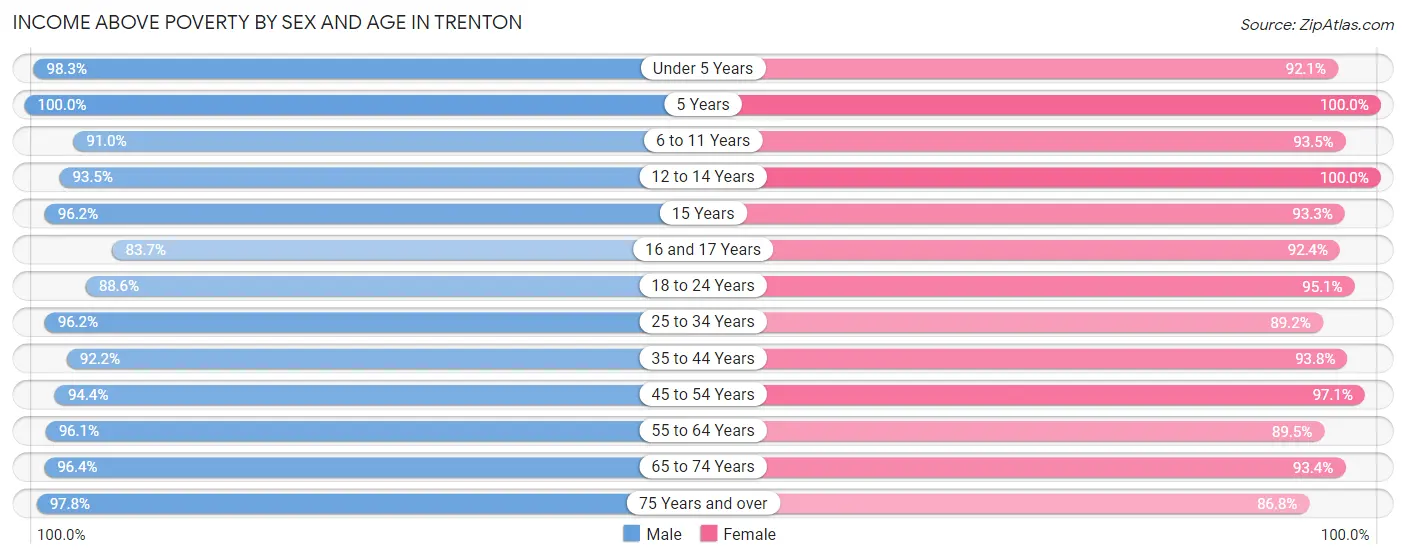
| Age Bracket | Male | Female |
| Under 5 Years | 472 (98.3%) | 278 (92.0%) |
| 5 Years | 60 (100.0%) | 182 (100.0%) |
| 6 to 11 Years | 614 (91.0%) | 416 (93.5%) |
| 12 to 14 Years | 375 (93.5%) | 180 (100.0%) |
| 15 Years | 153 (96.2%) | 140 (93.3%) |
| 16 and 17 Years | 215 (83.7%) | 269 (92.4%) |
| 18 to 24 Years | 585 (88.6%) | 488 (95.1%) |
| 25 to 34 Years | 819 (96.2%) | 712 (89.2%) |
| 35 to 44 Years | 775 (92.1%) | 955 (93.8%) |
| 45 to 54 Years | 1,370 (94.4%) | 1,123 (97.1%) |
| 55 to 64 Years | 1,344 (96.1%) | 1,459 (89.5%) |
| 65 to 74 Years | 1,005 (96.4%) | 1,259 (93.4%) |
| 75 Years and over | 653 (97.8%) | 1,100 (86.8%) |
| Total | 8,440 (94.3%) | 8,561 (92.2%) |
Income Below Poverty Among Married-Couple Families in Trenton
The poverty statistics for married-couple families in Trenton show that 1.1% or 41 of the total 3,699 families live below the poverty line. Families with 3 or 4 children have the highest poverty rate of 4.9%, comprising of 12 families. On the other hand, families with 1 or 2 children have the lowest poverty rate of 0.0%, which includes 0 families.
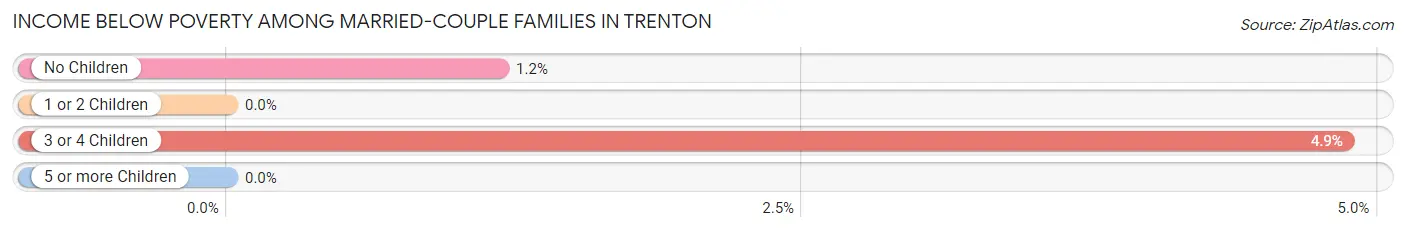
| Children | Above Poverty | Below Poverty |
| No Children | 2,420 (98.8%) | 29 (1.2%) |
| 1 or 2 Children | 960 (100.0%) | 0 (0.0%) |
| 3 or 4 Children | 235 (95.1%) | 12 (4.9%) |
| 5 or more Children | 43 (100.0%) | 0 (0.0%) |
| Total | 3,658 (98.9%) | 41 (1.1%) |
Income Below Poverty Among Single-Parent Households in Trenton
According to the poverty data in Trenton, 4.3% or 18 single-father households and 16.9% or 136 single-mother households are living below the poverty line. Among single-father households, those with 1 or 2 children have the highest poverty rate, with 9 households (4.5%) experiencing poverty. Likewise, among single-mother households, those with 1 or 2 children have the highest poverty rate, with 108 households (23.9%) falling below the poverty line.
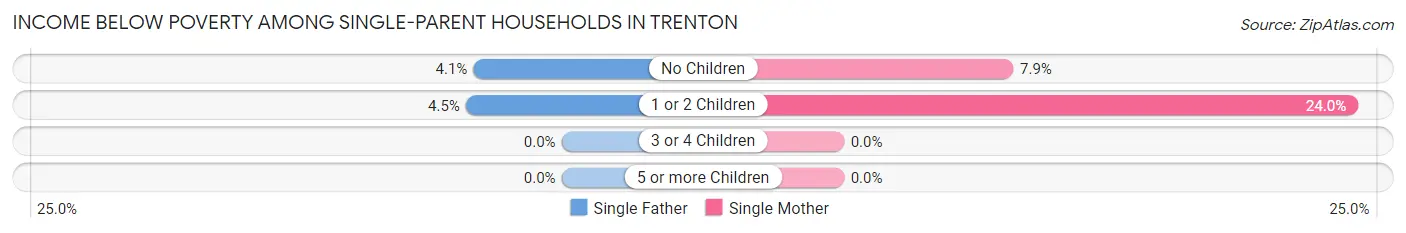
| Children | Single Father | Single Mother |
| No Children | 9 (4.1%) | 28 (7.9%) |
| 1 or 2 Children | 9 (4.5%) | 108 (23.9%) |
| 3 or 4 Children | 0 (0.0%) | 0 (0.0%) |
| 5 or more Children | 0 (0.0%) | 0 (0.0%) |
| Total | 18 (4.3%) | 136 (16.9%) |
Income Below Poverty Among Married-Couple vs Single-Parent Households in Trenton
The poverty data for Trenton shows that 41 of the married-couple family households (1.1%) and 154 of the single-parent households (12.6%) are living below the poverty level. Within the married-couple family households, those with 3 or 4 children have the highest poverty rate, with 12 households (4.9%) falling below the poverty line. Among the single-parent households, those with 1 or 2 children have the highest poverty rate, with 117 household (17.9%) living below poverty.
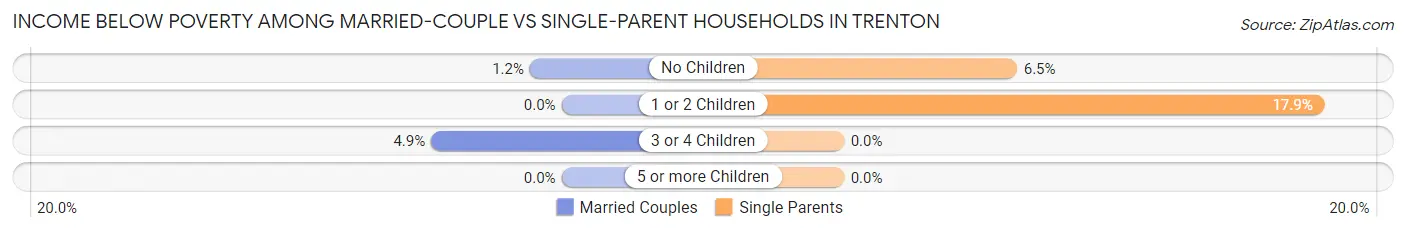
| Children | Married-Couple Families | Single-Parent Households |
| No Children | 29 (1.2%) | 37 (6.5%) |
| 1 or 2 Children | 0 (0.0%) | 117 (17.9%) |
| 3 or 4 Children | 12 (4.9%) | 0 (0.0%) |
| 5 or more Children | 0 (0.0%) | 0 (0.0%) |
| Total | 41 (1.1%) | 154 (12.6%) |
Race in Trenton
The most populous races in Trenton are White / Caucasian (16,889 | 91.7%), Hispanic or Latino (879 | 4.8%), and Two or more Races (878 | 4.8%).
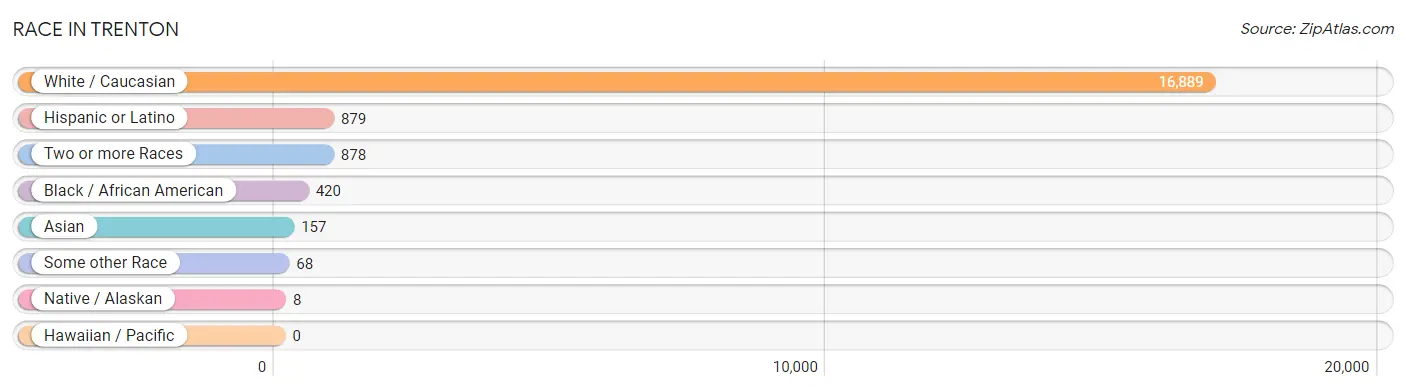
| Race | # Population | % Population |
| Asian | 157 | 0.9% |
| Black / African American | 420 | 2.3% |
| Hawaiian / Pacific | 0 | 0.0% |
| Hispanic or Latino | 879 | 4.8% |
| Native / Alaskan | 8 | 0.0% |
| White / Caucasian | 16,889 | 91.7% |
| Two or more Races | 878 | 4.8% |
| Some other Race | 68 | 0.4% |
| Total | 18,420 | 100.0% |
Ancestry in Trenton
The most populous ancestries reported in Trenton are German (3,628 | 19.7%), Irish (2,616 | 14.2%), Polish (2,497 | 13.6%), Italian (2,237 | 12.1%), and English (1,997 | 10.8%), together accounting for 70.4% of all Trenton residents.
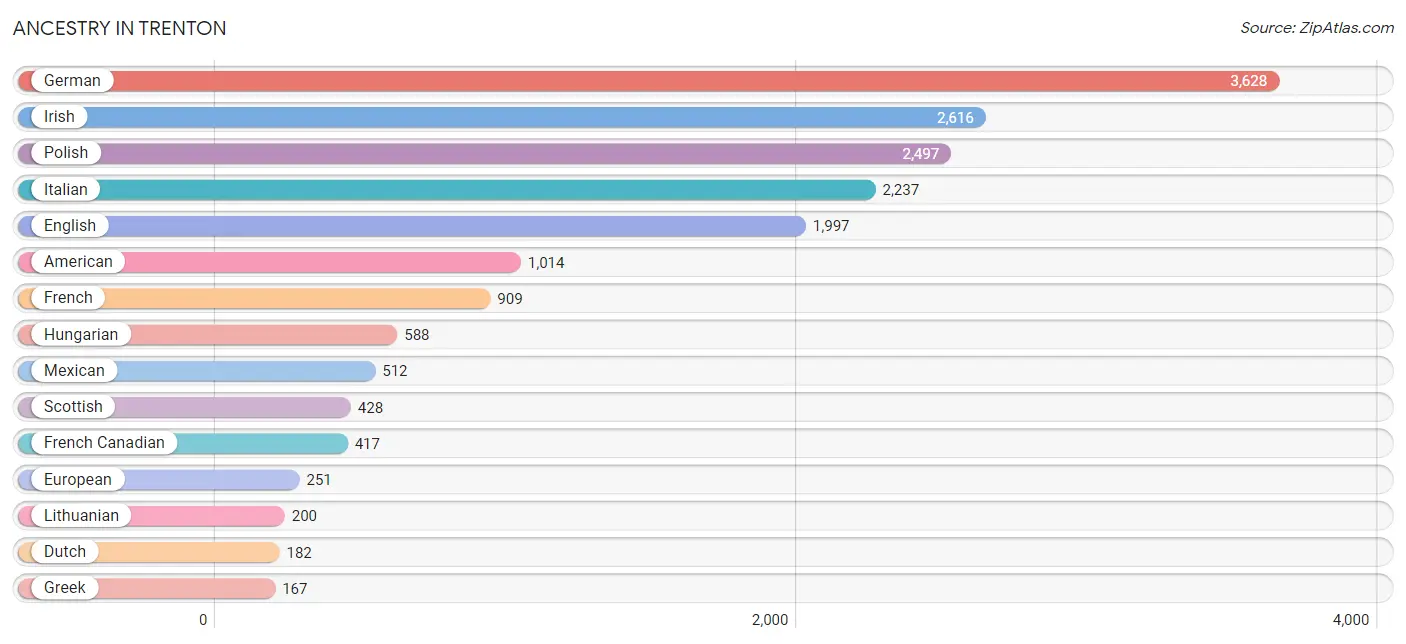
| Ancestry | # Population | % Population |
| African | 11 | 0.1% |
| Albanian | 43 | 0.2% |
| American | 1,014 | 5.5% |
| Arab | 90 | 0.5% |
| Argentinean | 19 | 0.1% |
| Armenian | 73 | 0.4% |
| Austrian | 151 | 0.8% |
| Belgian | 32 | 0.2% |
| Blackfeet | 11 | 0.1% |
| Brazilian | 135 | 0.7% |
| British | 92 | 0.5% |
| Bulgarian | 9 | 0.1% |
| Burmese | 157 | 0.9% |
| Canadian | 68 | 0.4% |
| Central American | 69 | 0.4% |
| Central American Indian | 8 | 0.0% |
| Cherokee | 42 | 0.2% |
| Colombian | 17 | 0.1% |
| Croatian | 9 | 0.1% |
| Cypriot | 7 | 0.0% |
| Czech | 60 | 0.3% |
| Czechoslovakian | 16 | 0.1% |
| Dutch | 182 | 1.0% |
| Eastern European | 50 | 0.3% |
| English | 1,997 | 10.8% |
| European | 251 | 1.4% |
| Finnish | 119 | 0.6% |
| French | 909 | 4.9% |
| French Canadian | 417 | 2.3% |
| German | 3,628 | 19.7% |
| Greek | 167 | 0.9% |
| Guatemalan | 69 | 0.4% |
| Hungarian | 588 | 3.2% |
| Indian (Asian) | 72 | 0.4% |
| Irish | 2,616 | 14.2% |
| Iroquois | 5 | 0.0% |
| Italian | 2,237 | 12.1% |
| Korean | 39 | 0.2% |
| Lebanese | 75 | 0.4% |
| Lithuanian | 200 | 1.1% |
| Macedonian | 27 | 0.2% |
| Maltese | 112 | 0.6% |
| Mexican | 512 | 2.8% |
| Native Hawaiian | 23 | 0.1% |
| Northern European | 34 | 0.2% |
| Norwegian | 24 | 0.1% |
| Ottawa | 9 | 0.1% |
| Pakistani | 87 | 0.5% |
| Polish | 2,497 | 13.6% |
| Puerto Rican | 100 | 0.5% |
| Romanian | 43 | 0.2% |
| Russian | 86 | 0.5% |
| Scandinavian | 32 | 0.2% |
| Scotch-Irish | 151 | 0.8% |
| Scottish | 428 | 2.3% |
| Serbian | 58 | 0.3% |
| Slavic | 24 | 0.1% |
| Slovak | 108 | 0.6% |
| South American | 36 | 0.2% |
| Spaniard | 108 | 0.6% |
| Spanish | 43 | 0.2% |
| Subsaharan African | 11 | 0.1% |
| Swedish | 10 | 0.1% |
| Syrian | 8 | 0.0% |
| Ukrainian | 49 | 0.3% |
| Welsh | 98 | 0.5% |
| Yugoslavian | 141 | 0.8% | View All 67 Rows |
Immigrants in Trenton
The most numerous immigrant groups reported in Trenton came from Europe (309 | 1.7%), Asia (204 | 1.1%), Eastern Europe (140 | 0.8%), South Central Asia (119 | 0.6%), and Iran (109 | 0.6%), together accounting for 4.8% of all Trenton residents.
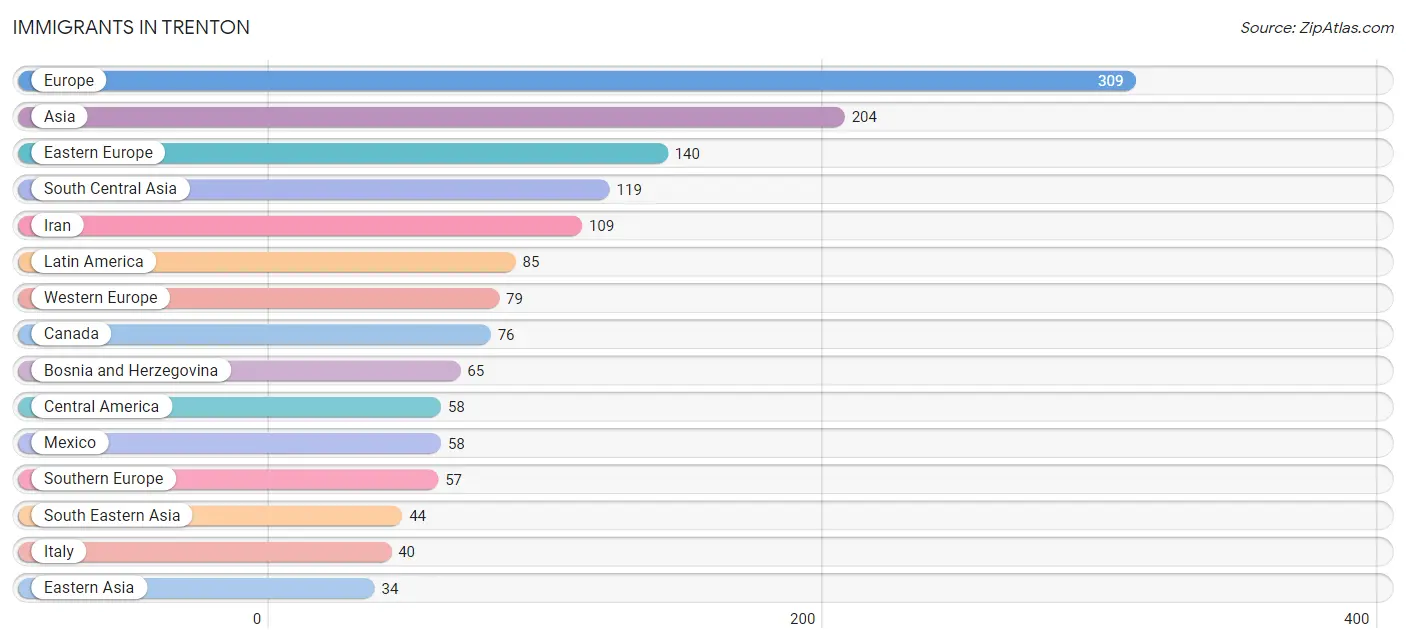
| Immigration Origin | # Population | % Population |
| Africa | 13 | 0.1% |
| Albania | 29 | 0.2% |
| Argentina | 19 | 0.1% |
| Asia | 204 | 1.1% |
| Austria | 8 | 0.0% |
| Belgium | 8 | 0.0% |
| Bosnia and Herzegovina | 65 | 0.4% |
| Canada | 76 | 0.4% |
| Central America | 58 | 0.3% |
| China | 13 | 0.1% |
| Colombia | 8 | 0.0% |
| Eastern Asia | 34 | 0.2% |
| Eastern Europe | 140 | 0.8% |
| Europe | 309 | 1.7% |
| Germany | 31 | 0.2% |
| Greece | 17 | 0.1% |
| Hong Kong | 13 | 0.1% |
| Hungary | 20 | 0.1% |
| Iran | 109 | 0.6% |
| Italy | 40 | 0.2% |
| Jordan | 7 | 0.0% |
| Korea | 21 | 0.1% |
| Latin America | 85 | 0.5% |
| Mexico | 58 | 0.3% |
| Northern Europe | 33 | 0.2% |
| Pakistan | 10 | 0.1% |
| Philippines | 32 | 0.2% |
| Russia | 7 | 0.0% |
| Scotland | 23 | 0.1% |
| South America | 27 | 0.2% |
| South Central Asia | 119 | 0.6% |
| South Eastern Asia | 44 | 0.2% |
| Southern Europe | 57 | 0.3% |
| Switzerland | 32 | 0.2% |
| Vietnam | 12 | 0.1% |
| Western Asia | 7 | 0.0% |
| Western Europe | 79 | 0.4% | View All 37 Rows |
Sex and Age in Trenton
Sex and Age in Trenton
The most populous age groups in Trenton are 50 to 54 Years (809 | 9.0%) for men and 55 to 59 Years (838 | 8.9%) for women.
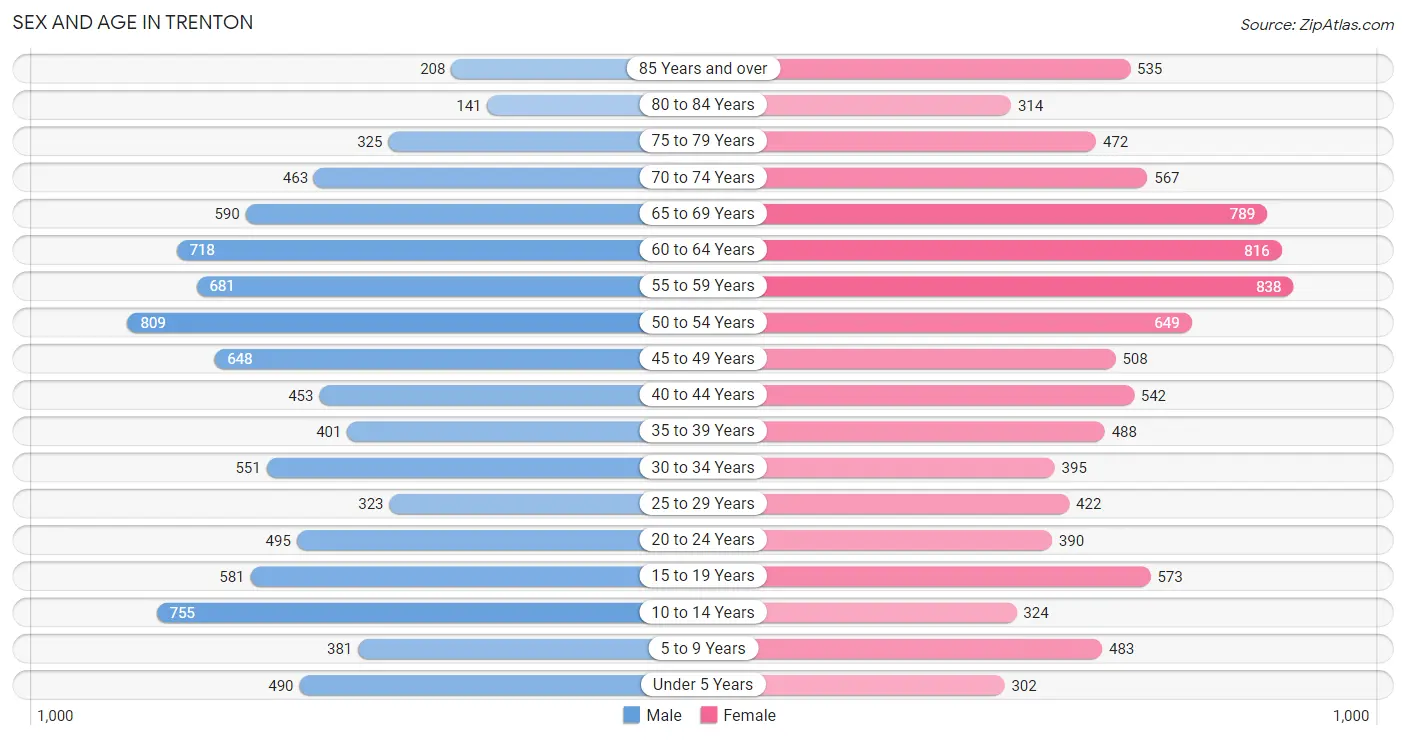
| Age Bracket | Male | Female |
| Under 5 Years | 490 (5.4%) | 302 (3.2%) |
| 5 to 9 Years | 381 (4.2%) | 483 (5.1%) |
| 10 to 14 Years | 755 (8.4%) | 324 (3.4%) |
| 15 to 19 Years | 581 (6.5%) | 573 (6.1%) |
| 20 to 24 Years | 495 (5.5%) | 390 (4.2%) |
| 25 to 29 Years | 323 (3.6%) | 422 (4.5%) |
| 30 to 34 Years | 551 (6.1%) | 395 (4.2%) |
| 35 to 39 Years | 401 (4.4%) | 488 (5.2%) |
| 40 to 44 Years | 453 (5.0%) | 542 (5.8%) |
| 45 to 49 Years | 648 (7.2%) | 508 (5.4%) |
| 50 to 54 Years | 809 (9.0%) | 649 (6.9%) |
| 55 to 59 Years | 681 (7.6%) | 838 (8.9%) |
| 60 to 64 Years | 718 (8.0%) | 816 (8.7%) |
| 65 to 69 Years | 590 (6.6%) | 789 (8.4%) |
| 70 to 74 Years | 463 (5.1%) | 567 (6.0%) |
| 75 to 79 Years | 325 (3.6%) | 472 (5.0%) |
| 80 to 84 Years | 141 (1.6%) | 314 (3.3%) |
| 85 Years and over | 208 (2.3%) | 535 (5.7%) |
| Total | 9,013 (100.0%) | 9,407 (100.0%) |
Families and Households in Trenton
Median Family Size in Trenton
The median family size in Trenton is 2.95 persons per family, with single female/mother families (806 | 16.4%) accounting for the largest median family size of 3.01 persons per family. On the other hand, single male/father families (421 | 8.6%) represent the smallest median family size with 2.45 persons per family.
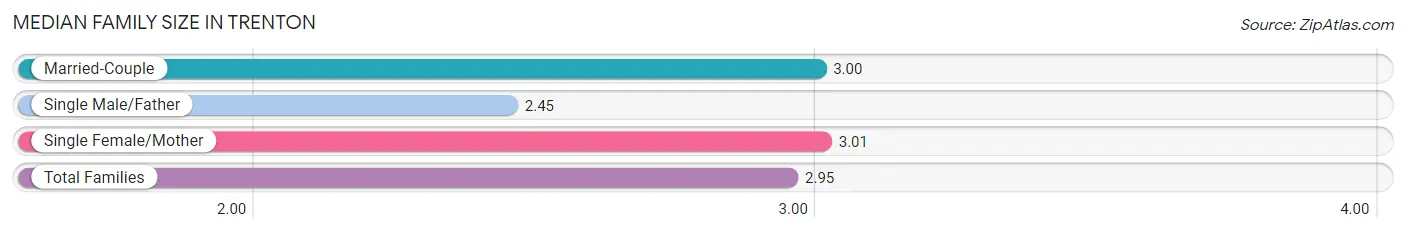
| Family Type | # Families | Family Size |
| Married-Couple | 3,699 (75.1%) | 3.00 |
| Single Male/Father | 421 (8.6%) | 2.45 |
| Single Female/Mother | 806 (16.4%) | 3.01 |
| Total Families | 4,926 (100.0%) | 2.95 |
Median Household Size in Trenton
The median household size in Trenton is 2.26 persons per household, with single female/mother households (806 | 10.0%) accounting for the largest median household size of 3.09 persons per household. non-family households (3,127 | 38.8%) represent the smallest median household size with 1.13 persons per household.
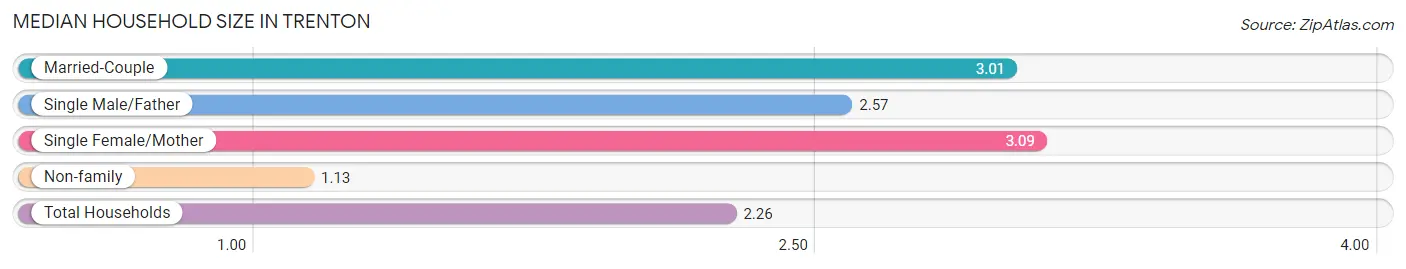
| Household Type | # Households | Household Size |
| Married-Couple | 3,699 (45.9%) | 3.01 |
| Single Male/Father | 421 (5.2%) | 2.57 |
| Single Female/Mother | 806 (10.0%) | 3.09 |
| Non-family | 3,127 (38.8%) | 1.13 |
| Total Households | 8,053 (100.0%) | 2.26 |
Household Size by Marriage Status in Trenton
Out of a total of 8,053 households in Trenton, 4,926 (61.2%) are family households, while 3,127 (38.8%) are nonfamily households. The most numerous type of family households are 2-person households, comprising 2,451, and the most common type of nonfamily households are 1-person households, comprising 2,850.
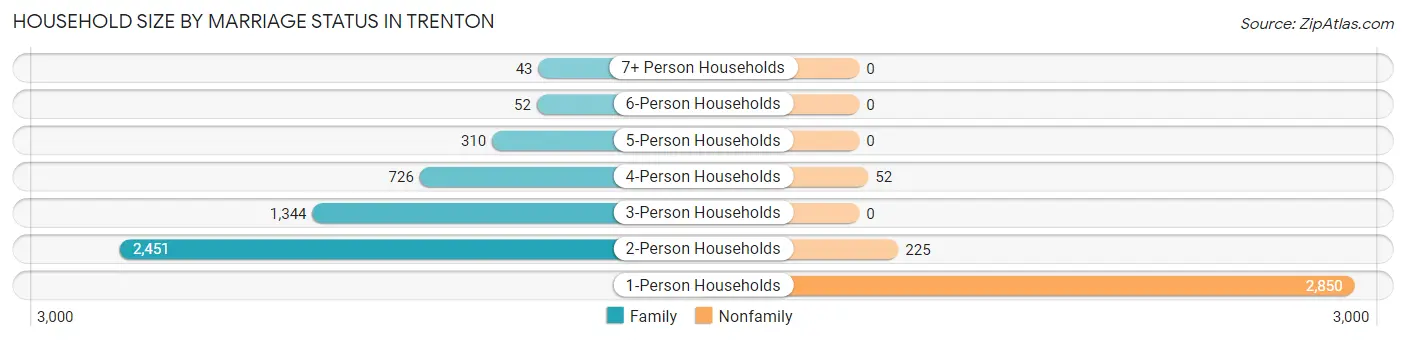
| Household Size | Family Households | Nonfamily Households |
| 1-Person Households | - | 2,850 (35.4%) |
| 2-Person Households | 2,451 (30.4%) | 225 (2.8%) |
| 3-Person Households | 1,344 (16.7%) | 0 (0.0%) |
| 4-Person Households | 726 (9.0%) | 52 (0.6%) |
| 5-Person Households | 310 (3.8%) | 0 (0.0%) |
| 6-Person Households | 52 (0.6%) | 0 (0.0%) |
| 7+ Person Households | 43 (0.5%) | 0 (0.0%) |
| Total | 4,926 (61.2%) | 3,127 (38.8%) |
Female Fertility in Trenton
Fertility by Age in Trenton
Average fertility rate in Trenton is 33.0 births per 1,000 women. Women in the age bracket of 20 to 34 years have the highest fertility rate with 55.0 births per 1,000 women. Women in the age bracket of 20 to 34 years acount for 57.9% of all women with births.
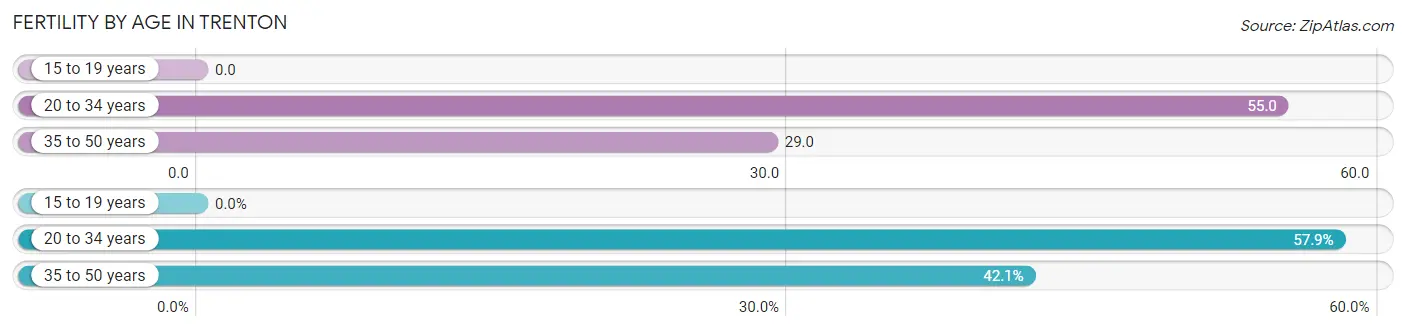
| Age Bracket | Women with Births | Births / 1,000 Women |
| 15 to 19 years | 0 (0.0%) | 0.0 |
| 20 to 34 years | 66 (57.9%) | 55.0 |
| 35 to 50 years | 48 (42.1%) | 29.0 |
| Total | 114 (100.0%) | 33.0 |
Fertility by Age by Marriage Status in Trenton
64.0% of women with births (114) in Trenton are married. The highest percentage of unmarried women with births falls into 35 to 50 years age bracket with 85.4% of them unmarried at the time of birth, while the lowest percentage of unmarried women with births belong to 20 to 34 years age bracket with 0.0% of them unmarried.
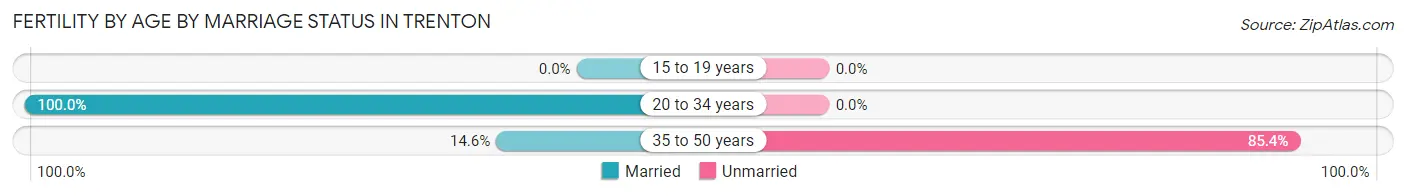
| Age Bracket | Married | Unmarried |
| 15 to 19 years | 0 (0.0%) | 0 (0.0%) |
| 20 to 34 years | 66 (100.0%) | 0 (0.0%) |
| 35 to 50 years | 7 (14.6%) | 41 (85.4%) |
| Total | 73 (64.0%) | 41 (36.0%) |
Fertility by Education in Trenton
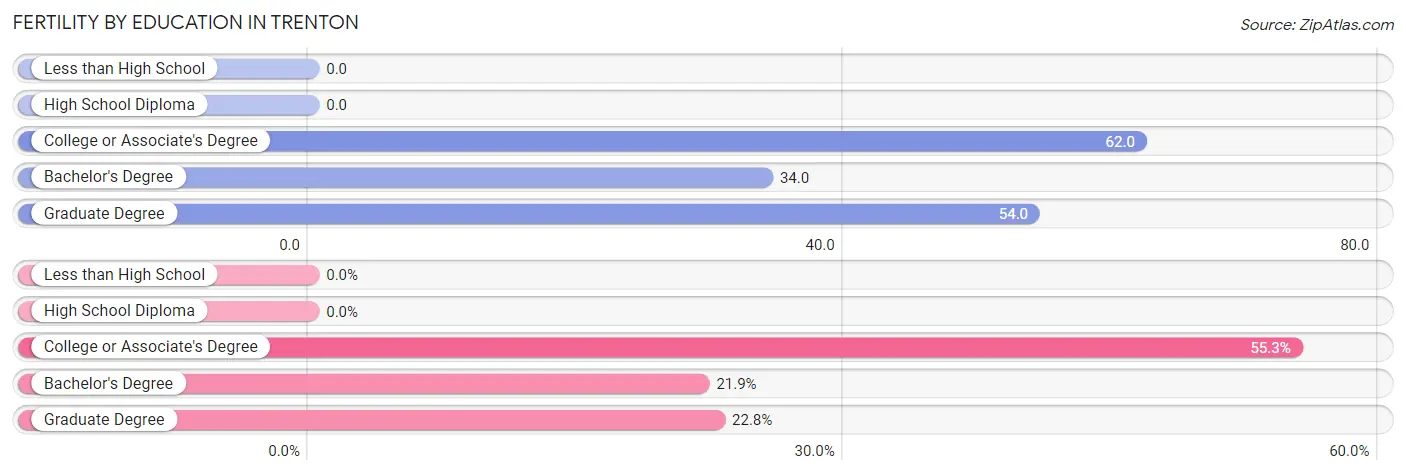
| Educational Attainment | Women with Births | Births / 1,000 Women |
| Less than High School | 0 (0.0%) | 0.0 |
| High School Diploma | 0 (0.0%) | 0.0 |
| College or Associate's Degree | 63 (55.3%) | 62.0 |
| Bachelor's Degree | 25 (21.9%) | 34.0 |
| Graduate Degree | 26 (22.8%) | 54.0 |
| Total | 114 (100.0%) | 33.0 |
Fertility by Education by Marriage Status in Trenton
36.0% of women with births in Trenton are unmarried. Women with the educational attainment of bachelor's degree are most likely to be married with 100.0% of them married at childbirth, while women with the educational attainment of college or associate's degree are least likely to be married with 65.1% of them unmarried at childbirth.
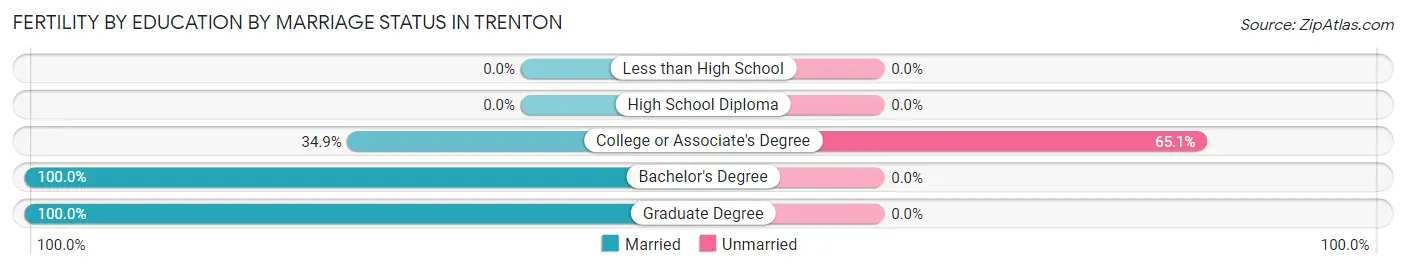
| Educational Attainment | Married | Unmarried |
| Less than High School | 0 (0.0%) | 0 (0.0%) |
| High School Diploma | 0 (0.0%) | 0 (0.0%) |
| College or Associate's Degree | 22 (34.9%) | 41 (65.1%) |
| Bachelor's Degree | 25 (100.0%) | 0 (0.0%) |
| Graduate Degree | 26 (100.0%) | 0 (0.0%) |
| Total | 73 (64.0%) | 41 (36.0%) |
Employment Characteristics in Trenton
Employment by Class of Employer in Trenton
Among the 8,459 employed individuals in Trenton, private company employees (6,343 | 75.0%), not-for-profit organizations (726 | 8.6%), and local government employees (721 | 8.5%) make up the most common classes of employment.
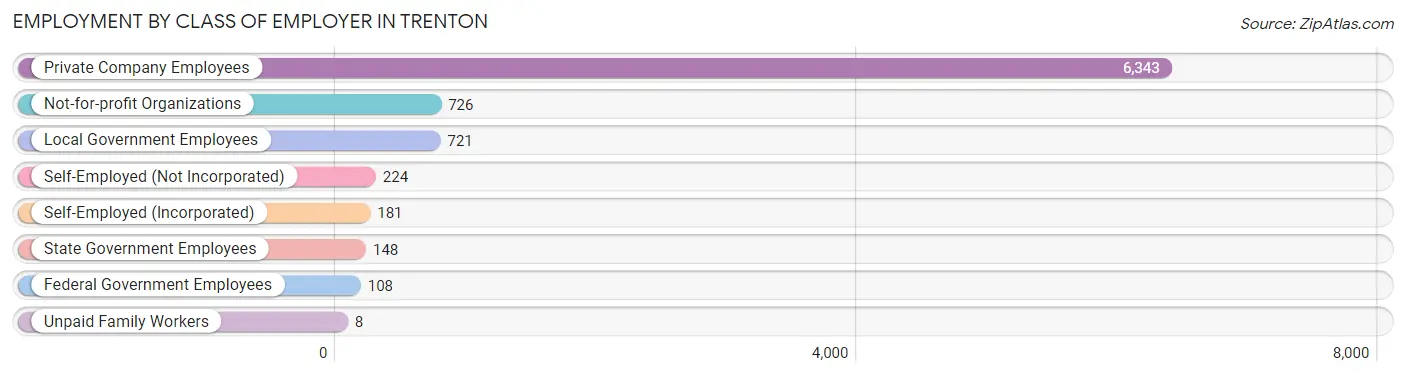
| Employer Class | # Employees | % Employees |
| Private Company Employees | 6,343 | 75.0% |
| Self-Employed (Incorporated) | 181 | 2.1% |
| Self-Employed (Not Incorporated) | 224 | 2.6% |
| Not-for-profit Organizations | 726 | 8.6% |
| Local Government Employees | 721 | 8.5% |
| State Government Employees | 148 | 1.8% |
| Federal Government Employees | 108 | 1.3% |
| Unpaid Family Workers | 8 | 0.1% |
| Total | 8,459 | 100.0% |
Employment Status by Age in Trenton
According to the labor force statistics for Trenton, out of the total population over 16 years of age (15,376), 57.5% or 8,841 individuals are in the labor force, with 3.3% or 292 of them unemployed. The age group with the highest labor force participation rate is 45 to 54 years, with 87.8% or 2,295 individuals in the labor force. Within the labor force, the 75 years and over age range has the highest percentage of unemployed individuals, with 26.7% or 35 of them being unemployed.
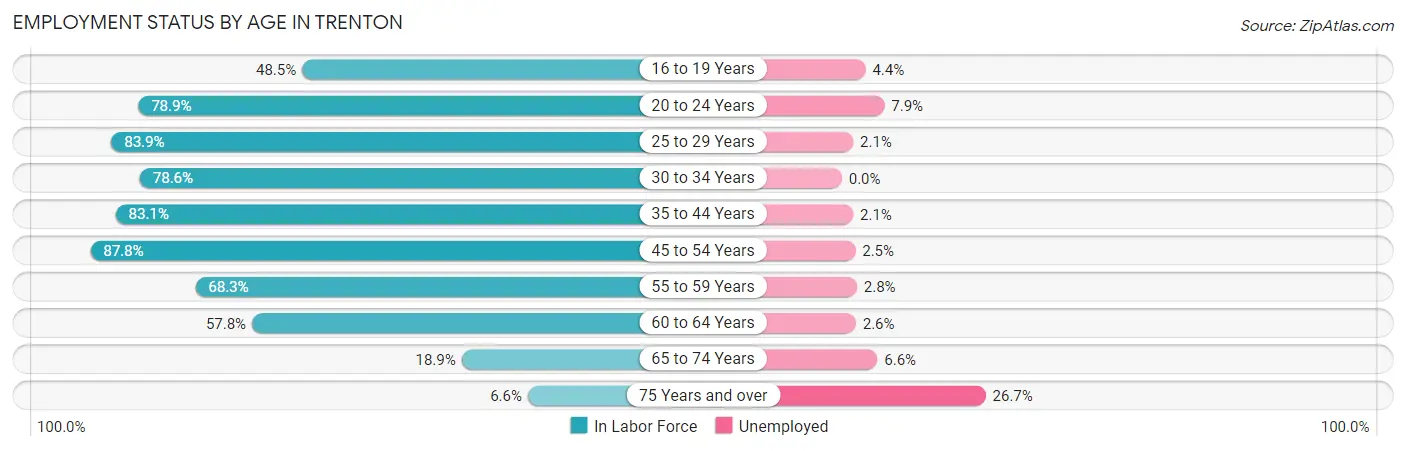
| Age Bracket | In Labor Force | Unemployed |
| 16 to 19 Years | 410 (48.5%) | 18 (4.4%) |
| 20 to 24 Years | 698 (78.9%) | 55 (7.9%) |
| 25 to 29 Years | 625 (83.9%) | 13 (2.1%) |
| 30 to 34 Years | 744 (78.6%) | 0 (0.0%) |
| 35 to 44 Years | 1,566 (83.1%) | 33 (2.1%) |
| 45 to 54 Years | 2,295 (87.8%) | 57 (2.5%) |
| 55 to 59 Years | 1,037 (68.3%) | 29 (2.8%) |
| 60 to 64 Years | 887 (57.8%) | 23 (2.6%) |
| 65 to 74 Years | 455 (18.9%) | 30 (6.6%) |
| 75 Years and over | 132 (6.6%) | 35 (26.7%) |
| Total | 8,841 (57.5%) | 292 (3.3%) |
Employment Status by Educational Attainment in Trenton
According to labor force statistics for Trenton, 77.4% of individuals (7,153) out of the total population between 25 and 64 years of age (9,242) are in the labor force, with 2.2% or 157 of them being unemployed. The group with the highest labor force participation rate are those with the educational attainment of bachelor's degree or higher, with 86.3% or 2,592 individuals in the labor force. Within the labor force, individuals with high school diploma education have the highest percentage of unemployment, with 4.4% or 76 of them being unemployed.
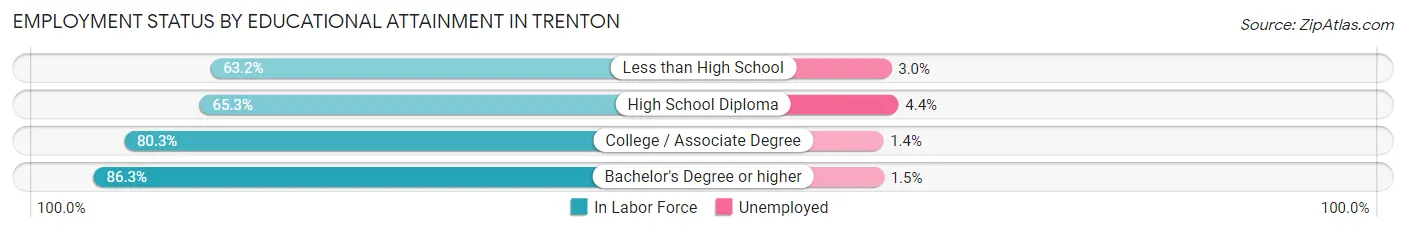
| Educational Attainment | In Labor Force | Unemployed |
| Less than High School | 201 (63.2%) | 10 (3.0%) |
| High School Diploma | 1,725 (65.3%) | 116 (4.4%) |
| College / Associate Degree | 2,633 (80.3%) | 46 (1.4%) |
| Bachelor's Degree or higher | 2,592 (86.3%) | 45 (1.5%) |
| Total | 7,153 (77.4%) | 203 (2.2%) |
Employment Occupations by Sex in Trenton
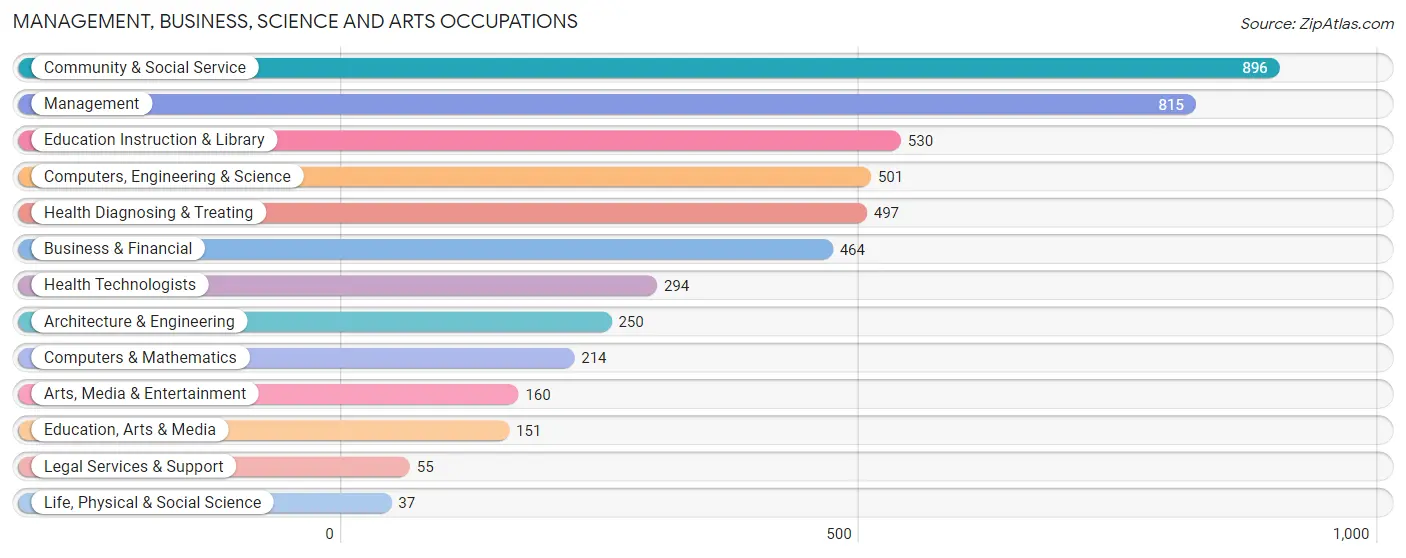
Management, Business, Science and Arts Occupations
The most common Management, Business, Science and Arts occupations in Trenton are Community & Social Service (896 | 10.5%), Management (815 | 9.5%), Education Instruction & Library (530 | 6.2%), Computers, Engineering & Science (501 | 5.9%), and Health Diagnosing & Treating (497 | 5.8%).
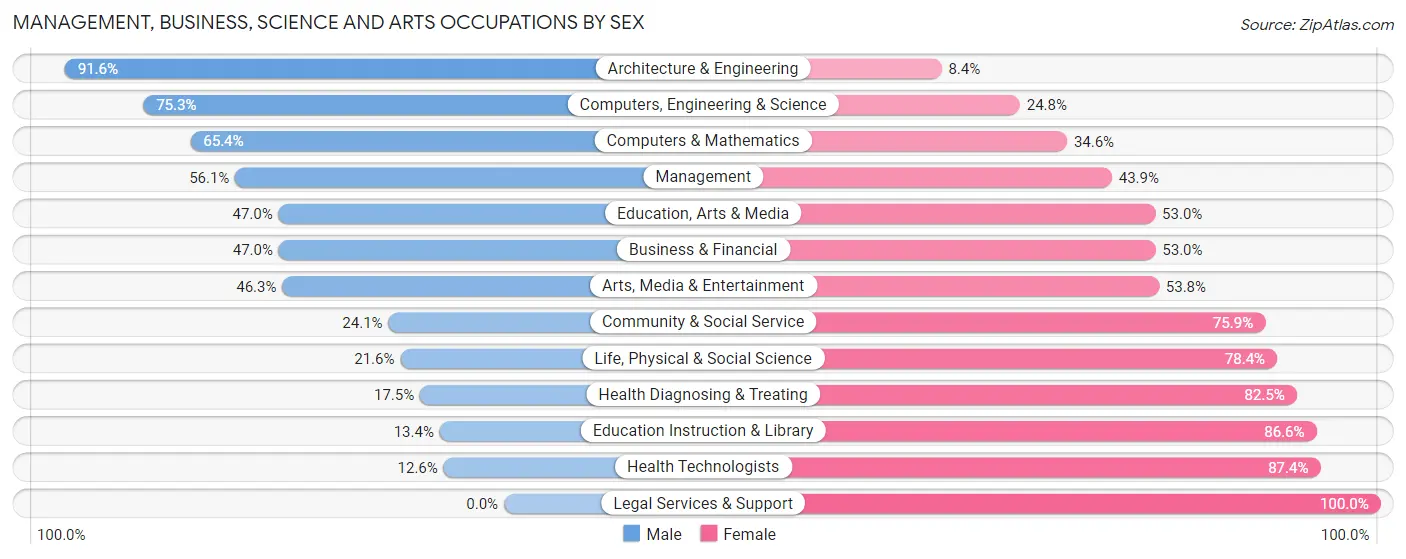
Management, Business, Science and Arts Occupations by Sex
Within the Management, Business, Science and Arts occupations in Trenton, the most male-oriented occupations are Architecture & Engineering (91.6%), Computers, Engineering & Science (75.2%), and Computers & Mathematics (65.4%), while the most female-oriented occupations are Legal Services & Support (100.0%), Health Technologists (87.4%), and Education Instruction & Library (86.6%).
| Occupation | Male | Female |
| Management | 457 (56.1%) | 358 (43.9%) |
| Business & Financial | 218 (47.0%) | 246 (53.0%) |
| Computers, Engineering & Science | 377 (75.2%) | 124 (24.7%) |
| Computers & Mathematics | 140 (65.4%) | 74 (34.6%) |
| Architecture & Engineering | 229 (91.6%) | 21 (8.4%) |
| Life, Physical & Social Science | 8 (21.6%) | 29 (78.4%) |
| Community & Social Service | 216 (24.1%) | 680 (75.9%) |
| Education, Arts & Media | 71 (47.0%) | 80 (53.0%) |
| Legal Services & Support | 0 (0.0%) | 55 (100.0%) |
| Education Instruction & Library | 71 (13.4%) | 459 (86.6%) |
| Arts, Media & Entertainment | 74 (46.3%) | 86 (53.7%) |
| Health Diagnosing & Treating | 87 (17.5%) | 410 (82.5%) |
| Health Technologists | 37 (12.6%) | 257 (87.4%) |
| Total (Category) | 1,355 (42.7%) | 1,818 (57.3%) |
| Total (Overall) | 4,354 (50.9%) | 4,198 (49.1%) |
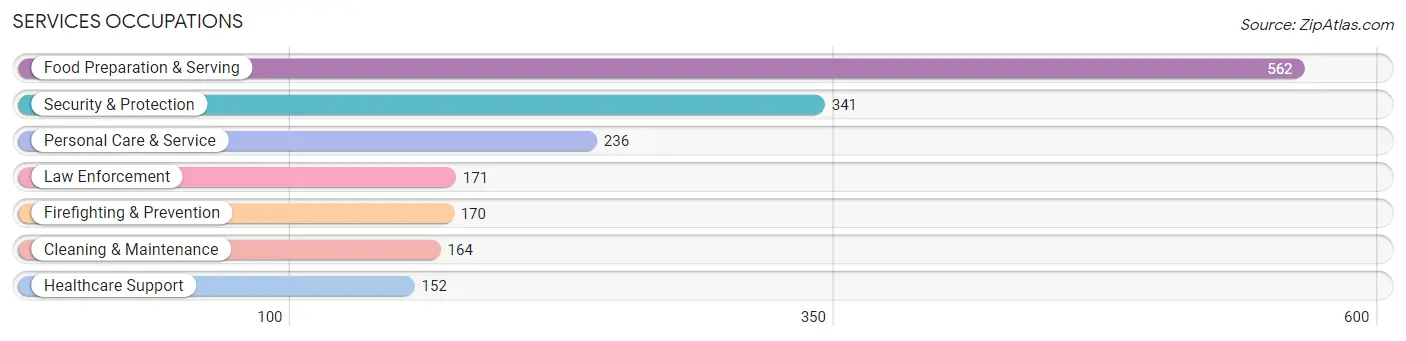
Services Occupations
The most common Services occupations in Trenton are Food Preparation & Serving (562 | 6.6%), Security & Protection (341 | 4.0%), Personal Care & Service (236 | 2.8%), Law Enforcement (171 | 2.0%), and Firefighting & Prevention (170 | 2.0%).
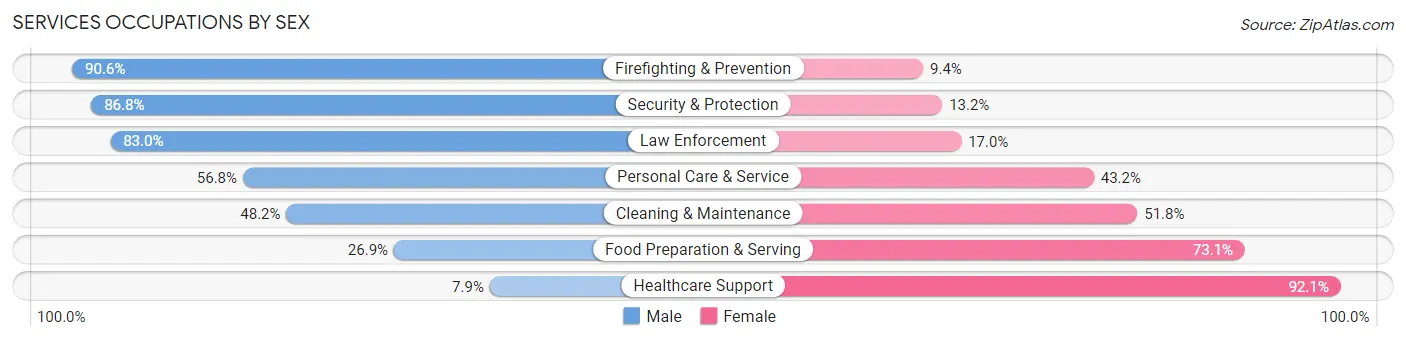
Services Occupations by Sex
Within the Services occupations in Trenton, the most male-oriented occupations are Firefighting & Prevention (90.6%), Security & Protection (86.8%), and Law Enforcement (83.0%), while the most female-oriented occupations are Healthcare Support (92.1%), Food Preparation & Serving (73.1%), and Cleaning & Maintenance (51.8%).
| Occupation | Male | Female |
| Healthcare Support | 12 (7.9%) | 140 (92.1%) |
| Security & Protection | 296 (86.8%) | 45 (13.2%) |
| Firefighting & Prevention | 154 (90.6%) | 16 (9.4%) |
| Law Enforcement | 142 (83.0%) | 29 (17.0%) |
| Food Preparation & Serving | 151 (26.9%) | 411 (73.1%) |
| Cleaning & Maintenance | 79 (48.2%) | 85 (51.8%) |
| Personal Care & Service | 134 (56.8%) | 102 (43.2%) |
| Total (Category) | 672 (46.2%) | 783 (53.8%) |
| Total (Overall) | 4,354 (50.9%) | 4,198 (49.1%) |
Sales and Office Occupations
The most common Sales and Office occupations in Trenton are Sales & Related (995 | 11.6%), and Office & Administration (950 | 11.1%).
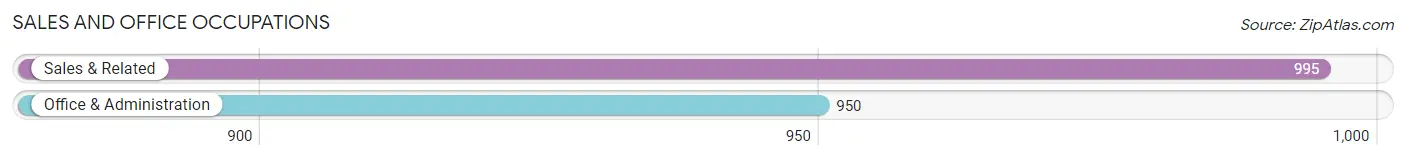
Sales and Office Occupations by Sex
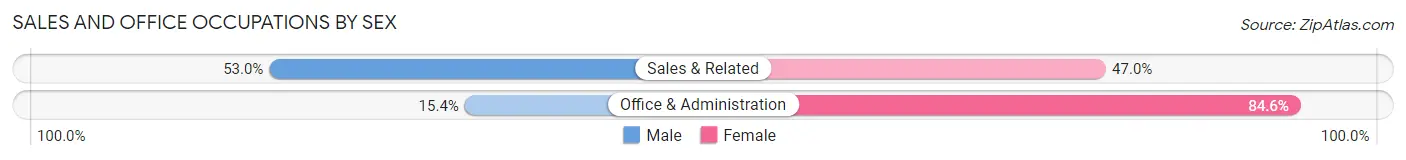
| Occupation | Male | Female |
| Sales & Related | 527 (53.0%) | 468 (47.0%) |
| Office & Administration | 146 (15.4%) | 804 (84.6%) |
| Total (Category) | 673 (34.6%) | 1,272 (65.4%) |
| Total (Overall) | 4,354 (50.9%) | 4,198 (49.1%) |
Natural Resources, Construction and Maintenance Occupations
The most common Natural Resources, Construction and Maintenance occupations in Trenton are Construction & Extraction (432 | 5.1%), Installation, Maintenance & Repair (323 | 3.8%), and Farming, Fishing & Forestry (10 | 0.1%).
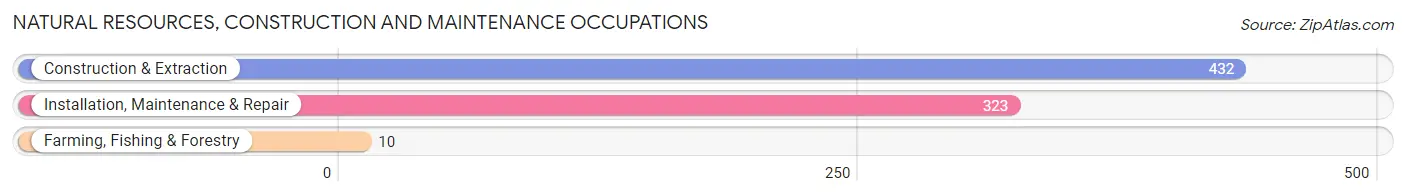
Natural Resources, Construction and Maintenance Occupations by Sex
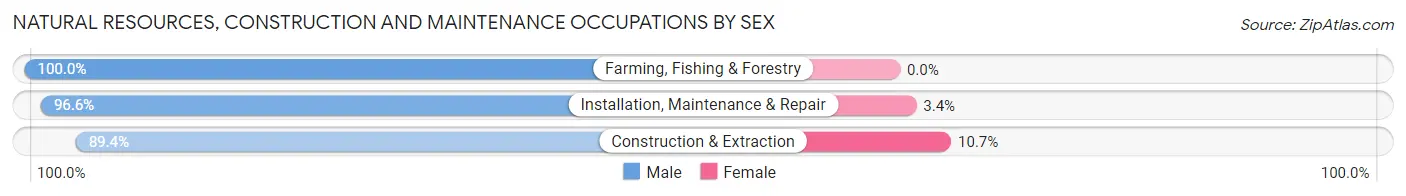
| Occupation | Male | Female |
| Farming, Fishing & Forestry | 10 (100.0%) | 0 (0.0%) |
| Construction & Extraction | 386 (89.3%) | 46 (10.6%) |
| Installation, Maintenance & Repair | 312 (96.6%) | 11 (3.4%) |
| Total (Category) | 708 (92.5%) | 57 (7.4%) |
| Total (Overall) | 4,354 (50.9%) | 4,198 (49.1%) |
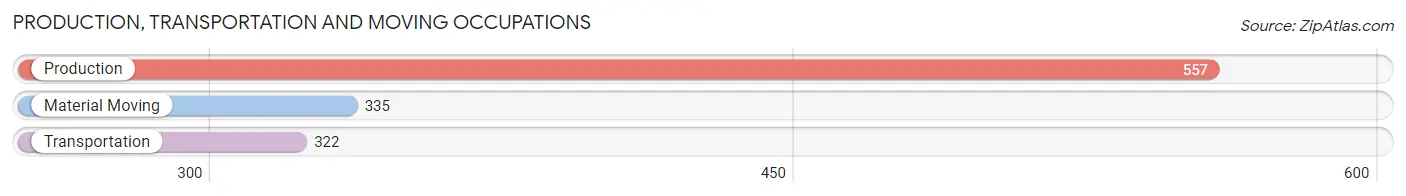
Production, Transportation and Moving Occupations
The most common Production, Transportation and Moving occupations in Trenton are Production (557 | 6.5%), Material Moving (335 | 3.9%), and Transportation (322 | 3.8%).
Production, Transportation and Moving Occupations by Sex
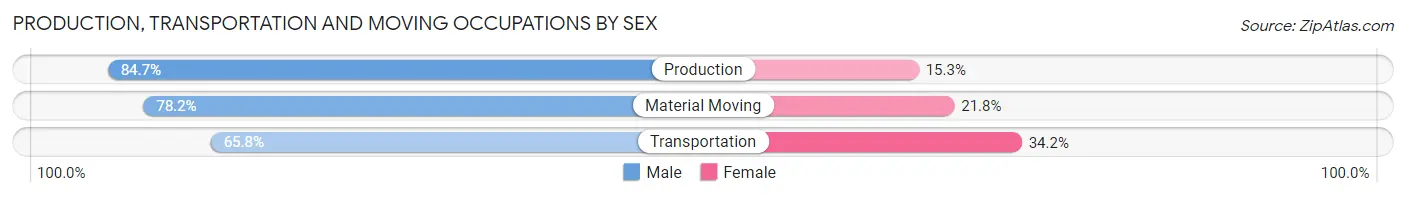
| Occupation | Male | Female |
| Production | 472 (84.7%) | 85 (15.3%) |
| Transportation | 212 (65.8%) | 110 (34.2%) |
| Material Moving | 262 (78.2%) | 73 (21.8%) |
| Total (Category) | 946 (77.9%) | 268 (22.1%) |
| Total (Overall) | 4,354 (50.9%) | 4,198 (49.1%) |
Employment Industries by Sex in Trenton
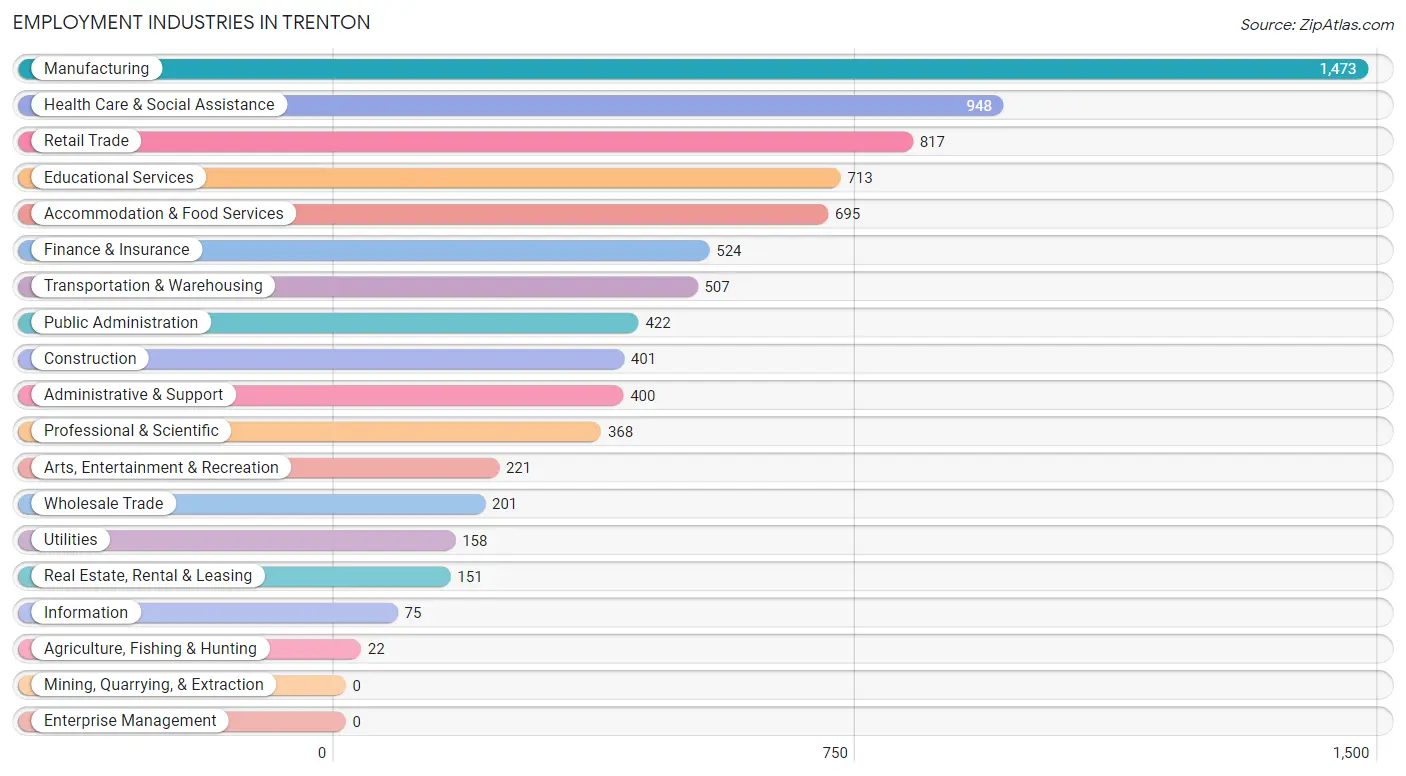
Employment Industries in Trenton
The major employment industries in Trenton include Manufacturing (1,473 | 17.2%), Health Care & Social Assistance (948 | 11.1%), Retail Trade (817 | 9.6%), Educational Services (713 | 8.3%), and Accommodation & Food Services (695 | 8.1%).
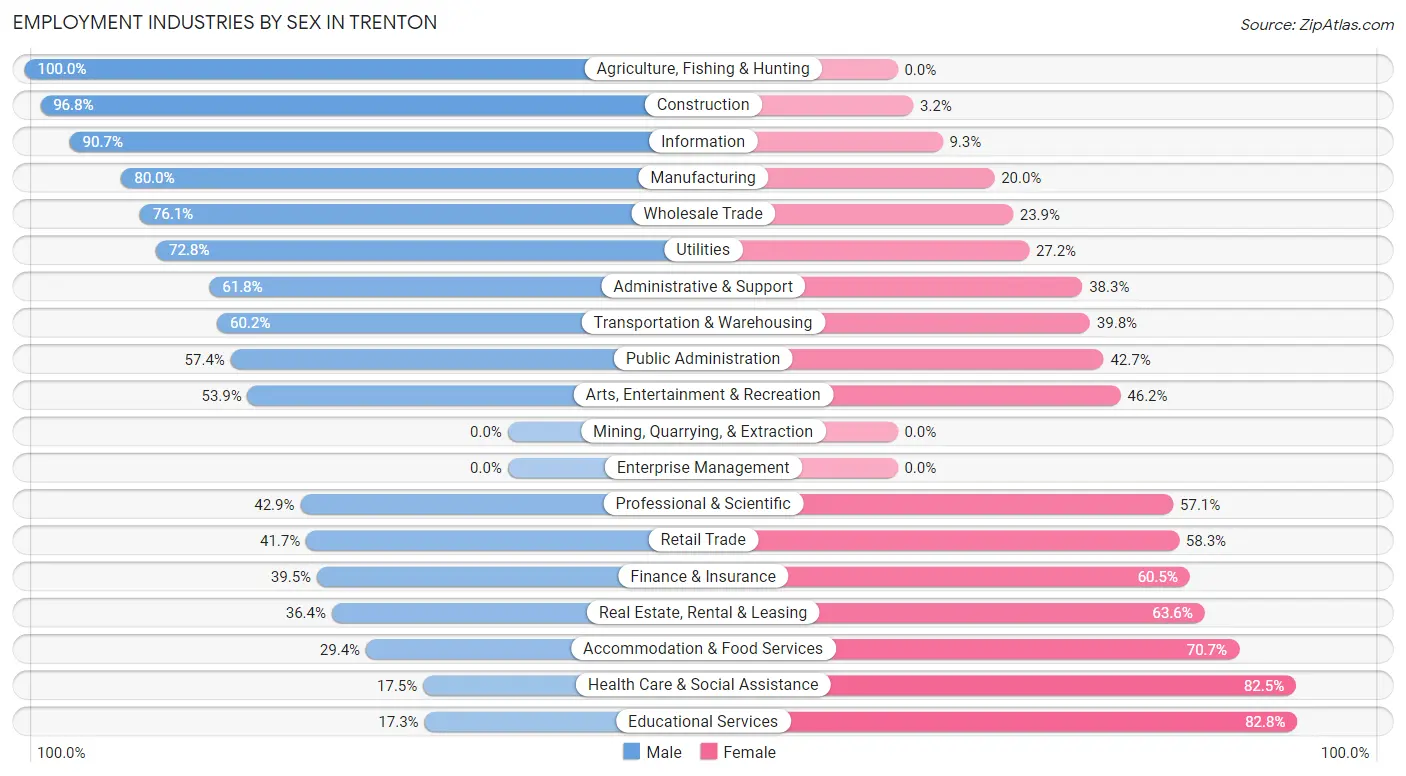
Employment Industries by Sex in Trenton
The Trenton industries that see more men than women are Agriculture, Fishing & Hunting (100.0%), Construction (96.8%), and Information (90.7%), whereas the industries that tend to have a higher number of women are Educational Services (82.8%), Health Care & Social Assistance (82.5%), and Accommodation & Food Services (70.7%).
| Industry | Male | Female |
| Agriculture, Fishing & Hunting | 22 (100.0%) | 0 (0.0%) |
| Mining, Quarrying, & Extraction | 0 (0.0%) | 0 (0.0%) |
| Construction | 388 (96.8%) | 13 (3.2%) |
| Manufacturing | 1,178 (80.0%) | 295 (20.0%) |
| Wholesale Trade | 153 (76.1%) | 48 (23.9%) |
| Retail Trade | 341 (41.7%) | 476 (58.3%) |
| Transportation & Warehousing | 305 (60.2%) | 202 (39.8%) |
| Utilities | 115 (72.8%) | 43 (27.2%) |
| Information | 68 (90.7%) | 7 (9.3%) |
| Finance & Insurance | 207 (39.5%) | 317 (60.5%) |
| Real Estate, Rental & Leasing | 55 (36.4%) | 96 (63.6%) |
| Professional & Scientific | 158 (42.9%) | 210 (57.1%) |
| Enterprise Management | 0 (0.0%) | 0 (0.0%) |
| Administrative & Support | 247 (61.8%) | 153 (38.3%) |
| Educational Services | 123 (17.2%) | 590 (82.8%) |
| Health Care & Social Assistance | 166 (17.5%) | 782 (82.5%) |
| Arts, Entertainment & Recreation | 119 (53.8%) | 102 (46.2%) |
| Accommodation & Food Services | 204 (29.3%) | 491 (70.7%) |
| Public Administration | 242 (57.4%) | 180 (42.6%) |
| Total | 4,354 (50.9%) | 4,198 (49.1%) |
Education in Trenton
School Enrollment in Trenton
The most common levels of schooling among the 3,916 students in Trenton are high school (1,087 | 27.8%), middle school (743 | 19.0%), and elementary school (741 | 18.9%).
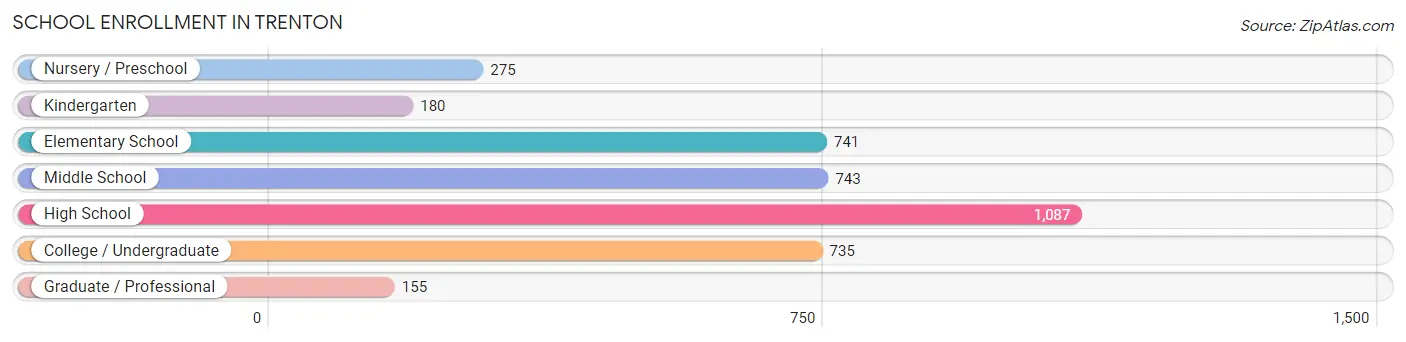
| School Level | # Students | % Students |
| Nursery / Preschool | 275 | 7.0% |
| Kindergarten | 180 | 4.6% |
| Elementary School | 741 | 18.9% |
| Middle School | 743 | 19.0% |
| High School | 1,087 | 27.8% |
| College / Undergraduate | 735 | 18.8% |
| Graduate / Professional | 155 | 4.0% |
| Total | 3,916 | 100.0% |
School Enrollment by Age by Funding Source in Trenton
Out of a total of 3,916 students who are enrolled in schools in Trenton, 591 (15.1%) attend a private institution, while the remaining 3,325 (84.9%) are enrolled in public schools. The age group of 3 to 4 year olds has the highest likelihood of being enrolled in private schools, with 92 (45.5% in the age bracket) enrolled. Conversely, the age group of 15 to 17 year olds has the lowest likelihood of being enrolled in a private school, with 809 (97.9% in the age bracket) attending a public institution.
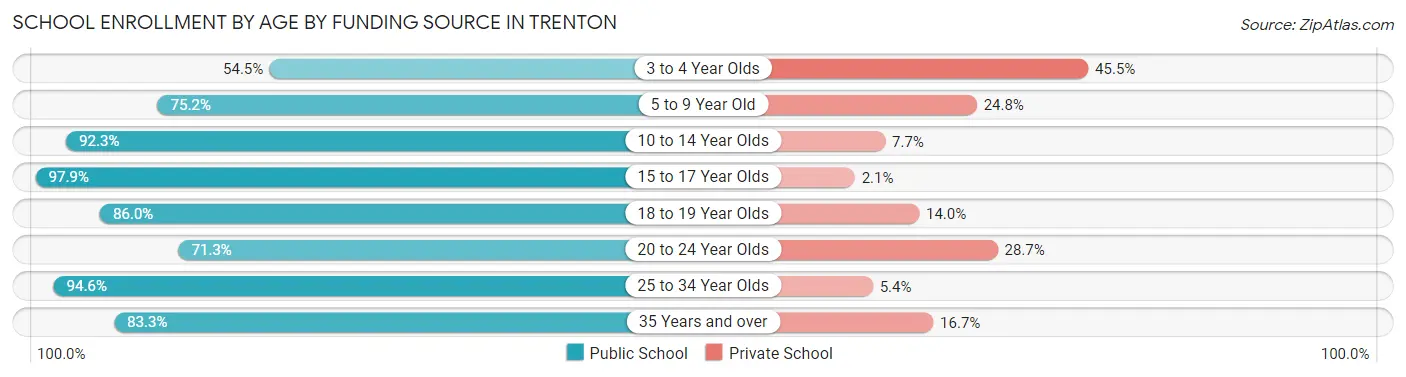
| Age Bracket | Public School | Private School |
| 3 to 4 Year Olds | 110 (54.5%) | 92 (45.5%) |
| 5 to 9 Year Old | 592 (75.2%) | 195 (24.8%) |
| 10 to 14 Year Olds | 980 (92.3%) | 82 (7.7%) |
| 15 to 17 Year Olds | 809 (97.9%) | 17 (2.1%) |
| 18 to 19 Year Olds | 202 (86.0%) | 33 (14.0%) |
| 20 to 24 Year Olds | 331 (71.3%) | 133 (28.7%) |
| 25 to 34 Year Olds | 140 (94.6%) | 8 (5.4%) |
| 35 Years and over | 160 (83.3%) | 32 (16.7%) |
| Total | 3,325 (84.9%) | 591 (15.1%) |
Educational Attainment by Field of Study in Trenton
Business (937 | 23.1%), education (600 | 14.8%), science & technology (534 | 13.2%), arts & humanities (333 | 8.2%), and social sciences (317 | 7.8%) are the most common fields of study among 4,050 individuals in Trenton who have obtained a bachelor's degree or higher.
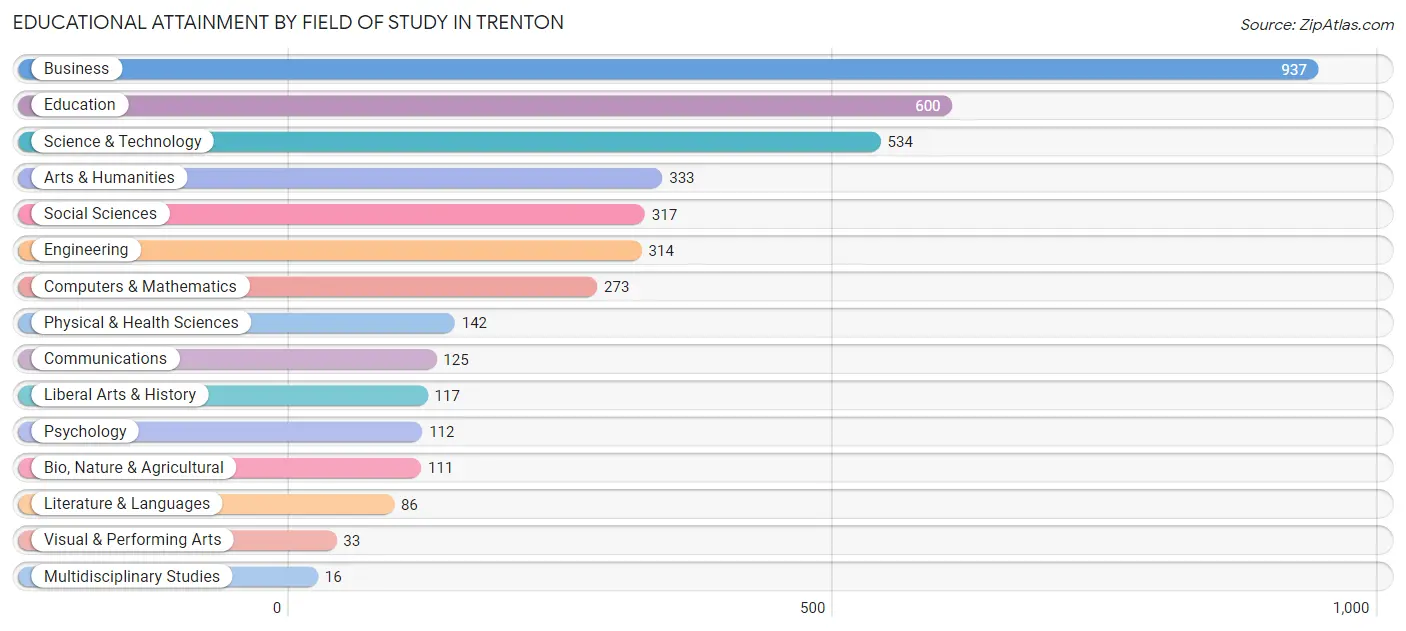
| Field of Study | # Graduates | % Graduates |
| Computers & Mathematics | 273 | 6.7% |
| Bio, Nature & Agricultural | 111 | 2.7% |
| Physical & Health Sciences | 142 | 3.5% |
| Psychology | 112 | 2.8% |
| Social Sciences | 317 | 7.8% |
| Engineering | 314 | 7.7% |
| Multidisciplinary Studies | 16 | 0.4% |
| Science & Technology | 534 | 13.2% |
| Business | 937 | 23.1% |
| Education | 600 | 14.8% |
| Literature & Languages | 86 | 2.1% |
| Liberal Arts & History | 117 | 2.9% |
| Visual & Performing Arts | 33 | 0.8% |
| Communications | 125 | 3.1% |
| Arts & Humanities | 333 | 8.2% |
| Total | 4,050 | 100.0% |
Transportation & Commute in Trenton
Vehicle Availability by Sex in Trenton
The most prevalent vehicle ownership categories in Trenton are males with 2 vehicles (2,343, accounting for 54.0%) and females with 2 vehicles (1,789, making up 56.8%).
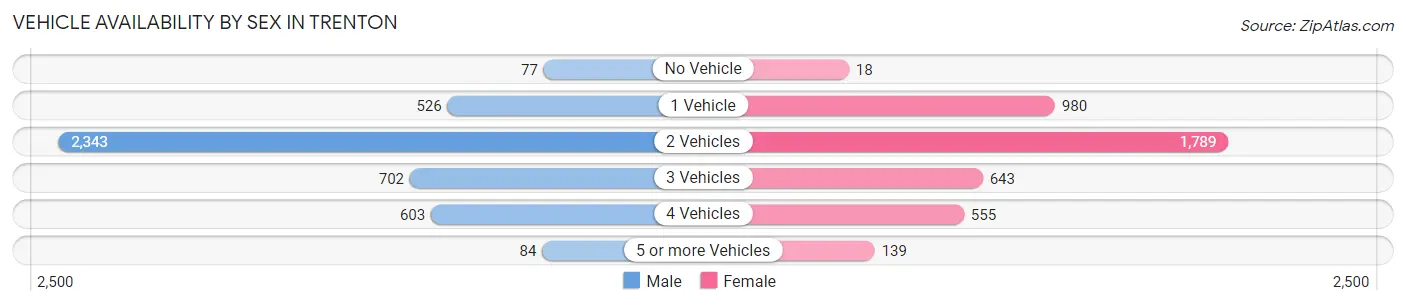
| Vehicles Available | Male | Female |
| No Vehicle | 77 (1.8%) | 18 (0.4%) |
| 1 Vehicle | 526 (12.1%) | 980 (23.8%) |
| 2 Vehicles | 2,343 (54.0%) | 1,789 (43.4%) |
| 3 Vehicles | 702 (16.2%) | 643 (15.6%) |
| 4 Vehicles | 603 (13.9%) | 555 (13.5%) |
| 5 or more Vehicles | 84 (1.9%) | 139 (3.4%) |
| Total | 4,335 (100.0%) | 4,124 (100.0%) |
Commute Time in Trenton
The most frequently occuring commute durations in Trenton are 5 to 9 minutes (1,058 commuters, 13.9%), 30 to 34 minutes (1,038 commuters, 13.7%), and 20 to 24 minutes (988 commuters, 13.0%).
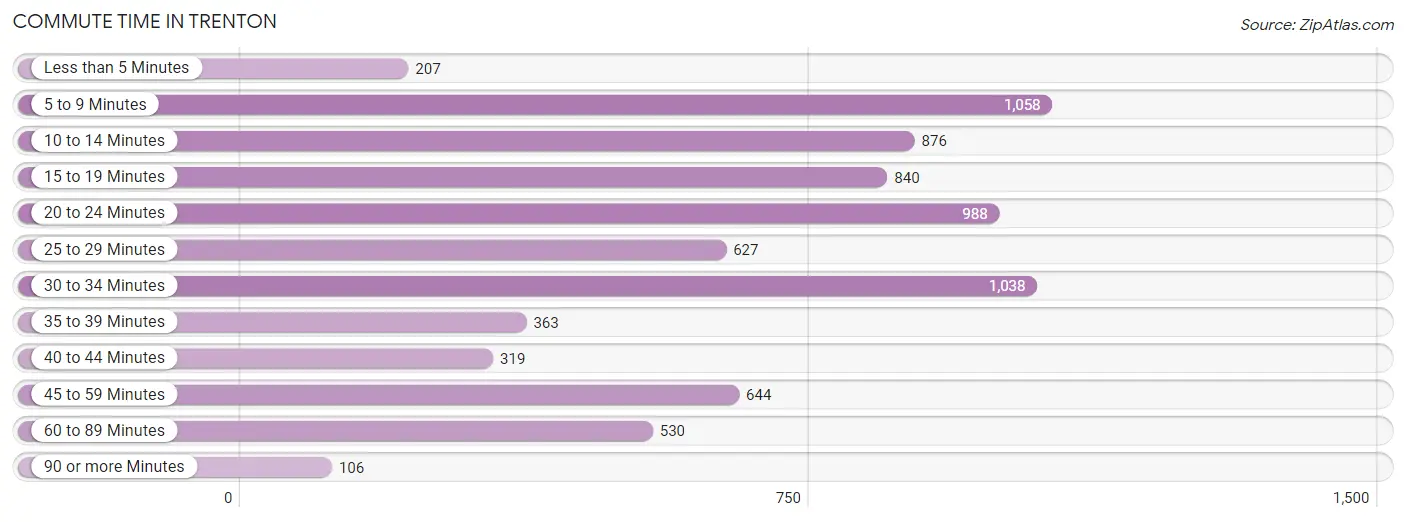
| Commute Time | # Commuters | % Commuters |
| Less than 5 Minutes | 207 | 2.7% |
| 5 to 9 Minutes | 1,058 | 13.9% |
| 10 to 14 Minutes | 876 | 11.5% |
| 15 to 19 Minutes | 840 | 11.1% |
| 20 to 24 Minutes | 988 | 13.0% |
| 25 to 29 Minutes | 627 | 8.3% |
| 30 to 34 Minutes | 1,038 | 13.7% |
| 35 to 39 Minutes | 363 | 4.8% |
| 40 to 44 Minutes | 319 | 4.2% |
| 45 to 59 Minutes | 644 | 8.5% |
| 60 to 89 Minutes | 530 | 7.0% |
| 90 or more Minutes | 106 | 1.4% |
Commute Time by Sex in Trenton
The most common commute times in Trenton are 30 to 34 minutes (653 commuters, 17.1%) for males and 5 to 9 minutes (683 commuters, 18.1%) for females.
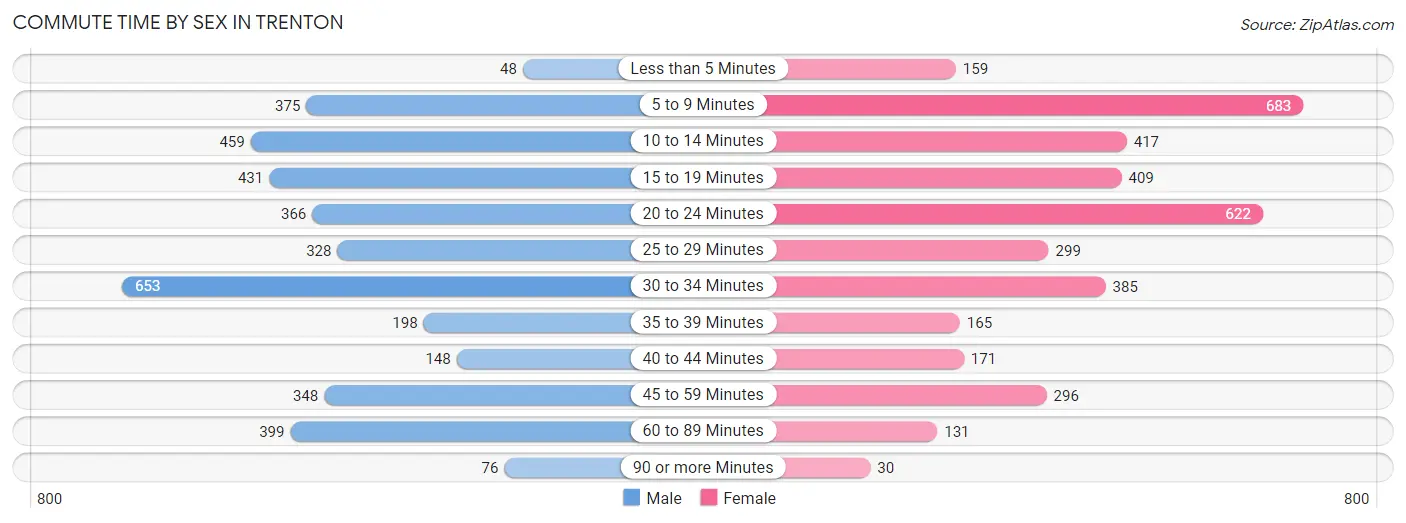
| Commute Time | Male | Female |
| Less than 5 Minutes | 48 (1.3%) | 159 (4.2%) |
| 5 to 9 Minutes | 375 (9.8%) | 683 (18.1%) |
| 10 to 14 Minutes | 459 (12.0%) | 417 (11.1%) |
| 15 to 19 Minutes | 431 (11.3%) | 409 (10.9%) |
| 20 to 24 Minutes | 366 (9.6%) | 622 (16.5%) |
| 25 to 29 Minutes | 328 (8.6%) | 299 (7.9%) |
| 30 to 34 Minutes | 653 (17.1%) | 385 (10.2%) |
| 35 to 39 Minutes | 198 (5.2%) | 165 (4.4%) |
| 40 to 44 Minutes | 148 (3.9%) | 171 (4.5%) |
| 45 to 59 Minutes | 348 (9.1%) | 296 (7.9%) |
| 60 to 89 Minutes | 399 (10.4%) | 131 (3.5%) |
| 90 or more Minutes | 76 (2.0%) | 30 (0.8%) |
Time of Departure to Work by Sex in Trenton
The most frequent times of departure to work in Trenton are 6:30 AM to 6:59 AM (520, 13.6%) for males and 7:30 AM to 7:59 AM (613, 16.3%) for females.
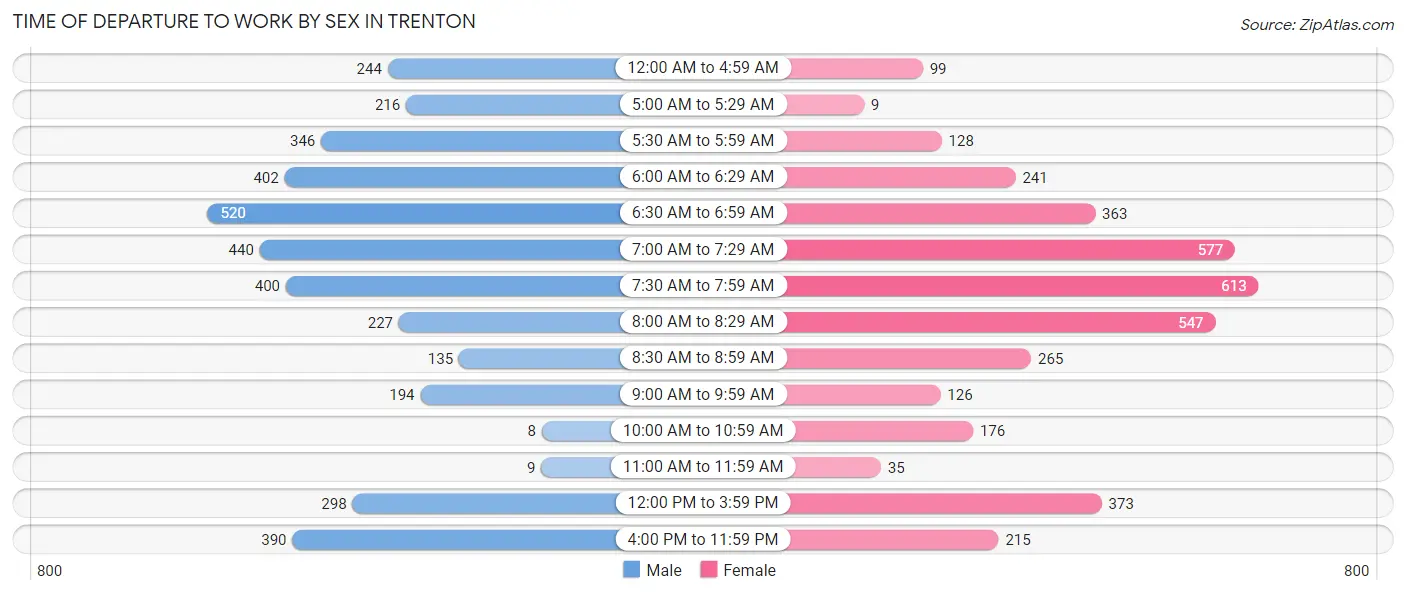
| Time of Departure | Male | Female |
| 12:00 AM to 4:59 AM | 244 (6.4%) | 99 (2.6%) |
| 5:00 AM to 5:29 AM | 216 (5.6%) | 9 (0.2%) |
| 5:30 AM to 5:59 AM | 346 (9.0%) | 128 (3.4%) |
| 6:00 AM to 6:29 AM | 402 (10.5%) | 241 (6.4%) |
| 6:30 AM to 6:59 AM | 520 (13.6%) | 363 (9.6%) |
| 7:00 AM to 7:29 AM | 440 (11.5%) | 577 (15.3%) |
| 7:30 AM to 7:59 AM | 400 (10.4%) | 613 (16.3%) |
| 8:00 AM to 8:29 AM | 227 (5.9%) | 547 (14.5%) |
| 8:30 AM to 8:59 AM | 135 (3.5%) | 265 (7.0%) |
| 9:00 AM to 9:59 AM | 194 (5.1%) | 126 (3.3%) |
| 10:00 AM to 10:59 AM | 8 (0.2%) | 176 (4.7%) |
| 11:00 AM to 11:59 AM | 9 (0.2%) | 35 (0.9%) |
| 12:00 PM to 3:59 PM | 298 (7.8%) | 373 (9.9%) |
| 4:00 PM to 11:59 PM | 390 (10.2%) | 215 (5.7%) |
| Total | 3,829 (100.0%) | 3,767 (100.0%) |
Housing Occupancy in Trenton
Occupancy by Ownership in Trenton
Of the total 8,053 dwellings in Trenton, owner-occupied units account for 6,717 (83.4%), while renter-occupied units make up 1,336 (16.6%).
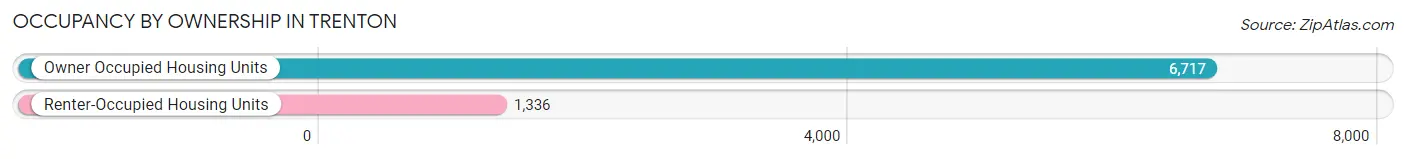
| Occupancy | # Housing Units | % Housing Units |
| Owner Occupied Housing Units | 6,717 | 83.4% |
| Renter-Occupied Housing Units | 1,336 | 16.6% |
| Total Occupied Housing Units | 8,053 | 100.0% |
Occupancy by Household Size in Trenton
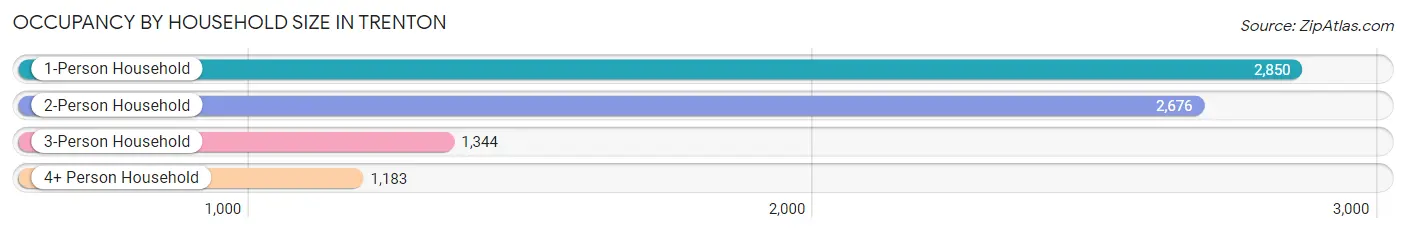
| Household Size | # Housing Units | % Housing Units |
| 1-Person Household | 2,850 | 35.4% |
| 2-Person Household | 2,676 | 33.2% |
| 3-Person Household | 1,344 | 16.7% |
| 4+ Person Household | 1,183 | 14.7% |
| Total Housing Units | 8,053 | 100.0% |
Occupancy by Ownership by Household Size in Trenton
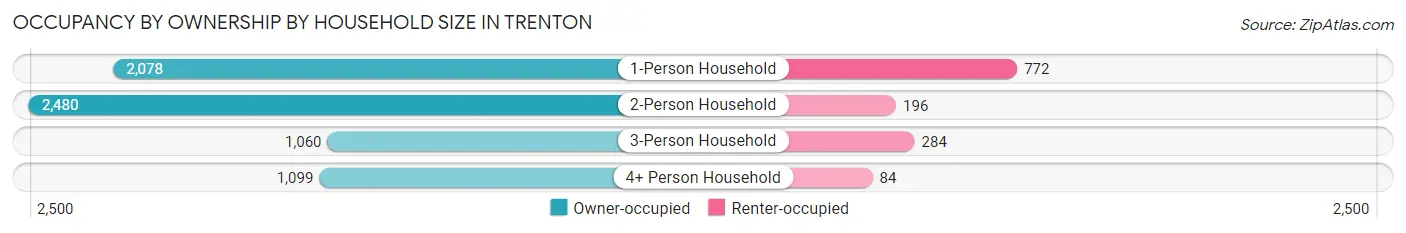
| Household Size | Owner-occupied | Renter-occupied |
| 1-Person Household | 2,078 (72.9%) | 772 (27.1%) |
| 2-Person Household | 2,480 (92.7%) | 196 (7.3%) |
| 3-Person Household | 1,060 (78.9%) | 284 (21.1%) |
| 4+ Person Household | 1,099 (92.9%) | 84 (7.1%) |
| Total Housing Units | 6,717 (83.4%) | 1,336 (16.6%) |
Occupancy by Educational Attainment in Trenton
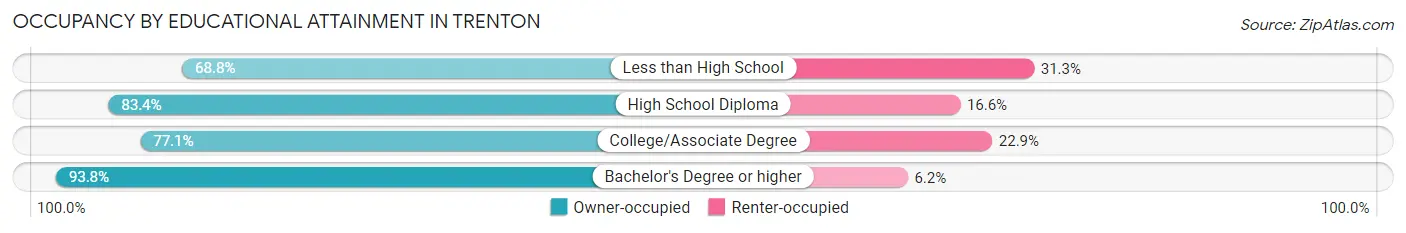
| Household Size | Owner-occupied | Renter-occupied |
| Less than High School | 209 (68.8%) | 95 (31.2%) |
| High School Diploma | 1,918 (83.4%) | 382 (16.6%) |
| College/Associate Degree | 2,398 (77.1%) | 714 (22.9%) |
| Bachelor's Degree or higher | 2,192 (93.8%) | 145 (6.2%) |
Occupancy by Age of Householder in Trenton
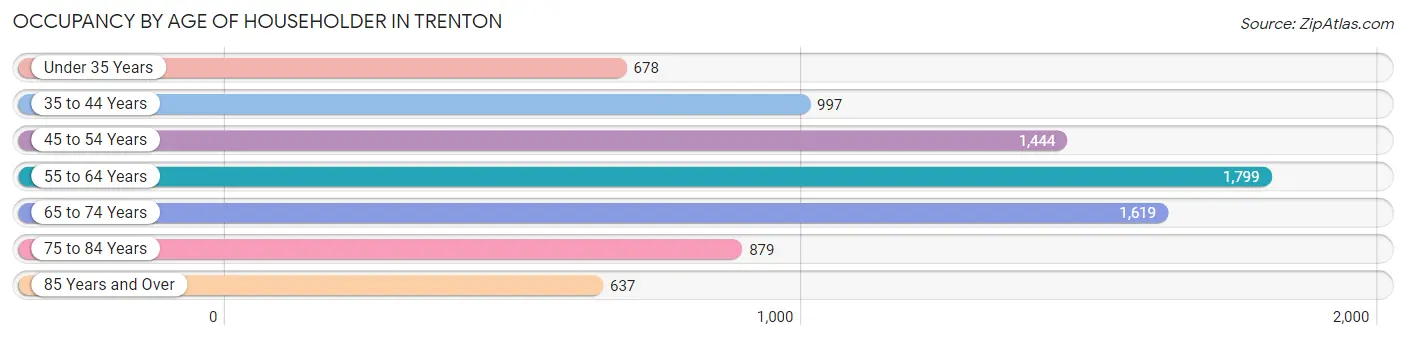
| Age Bracket | # Households | % Households |
| Under 35 Years | 678 | 8.4% |
| 35 to 44 Years | 997 | 12.4% |
| 45 to 54 Years | 1,444 | 17.9% |
| 55 to 64 Years | 1,799 | 22.3% |
| 65 to 74 Years | 1,619 | 20.1% |
| 75 to 84 Years | 879 | 10.9% |
| 85 Years and Over | 637 | 7.9% |
| Total | 8,053 | 100.0% |
Housing Finances in Trenton
Median Income by Occupancy in Trenton
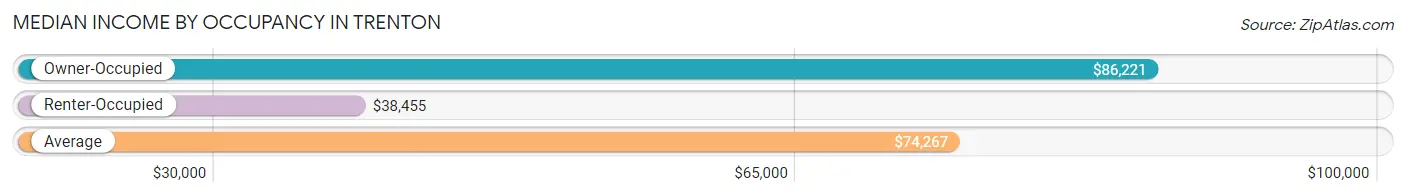
| Occupancy Type | # Households | Median Income |
| Owner-Occupied | 6,717 (83.4%) | $86,221 |
| Renter-Occupied | 1,336 (16.6%) | $38,455 |
| Average | 8,053 (100.0%) | $74,267 |
Occupancy by Householder Income Bracket in Trenton
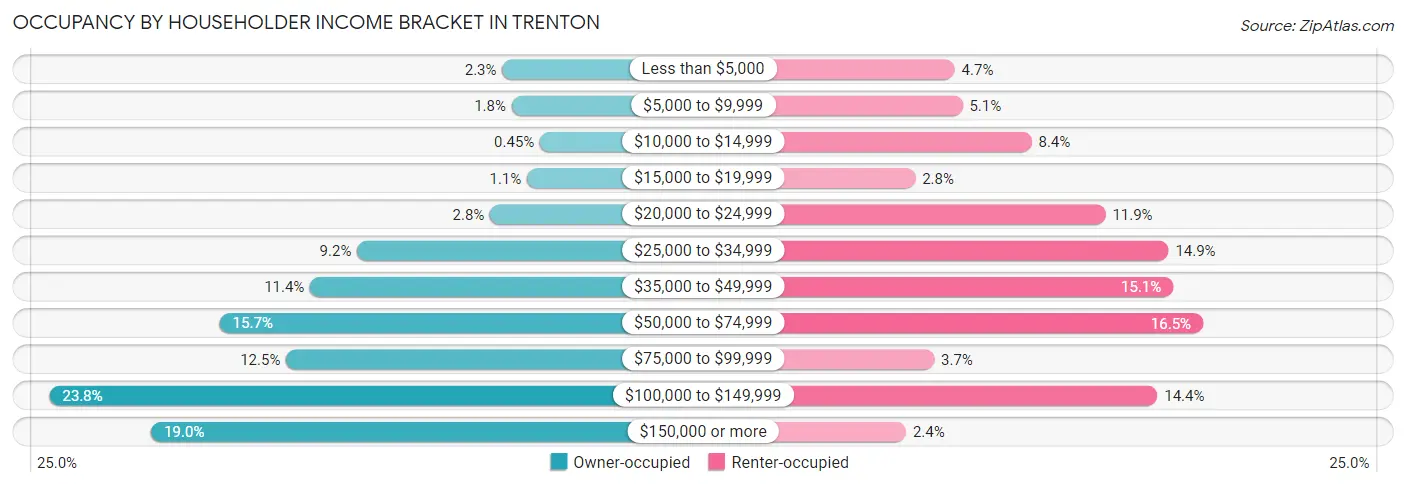
| Income Bracket | Owner-occupied | Renter-occupied |
| Less than $5,000 | 151 (2.2%) | 63 (4.7%) |
| $5,000 to $9,999 | 121 (1.8%) | 68 (5.1%) |
| $10,000 to $14,999 | 30 (0.4%) | 112 (8.4%) |
| $15,000 to $19,999 | 72 (1.1%) | 38 (2.8%) |
| $20,000 to $24,999 | 190 (2.8%) | 159 (11.9%) |
| $25,000 to $34,999 | 615 (9.2%) | 199 (14.9%) |
| $35,000 to $49,999 | 766 (11.4%) | 202 (15.1%) |
| $50,000 to $74,999 | 1,055 (15.7%) | 221 (16.5%) |
| $75,000 to $99,999 | 842 (12.5%) | 50 (3.7%) |
| $100,000 to $149,999 | 1,600 (23.8%) | 192 (14.4%) |
| $150,000 or more | 1,275 (19.0%) | 32 (2.4%) |
| Total | 6,717 (100.0%) | 1,336 (100.0%) |
Monthly Housing Cost Tiers in Trenton
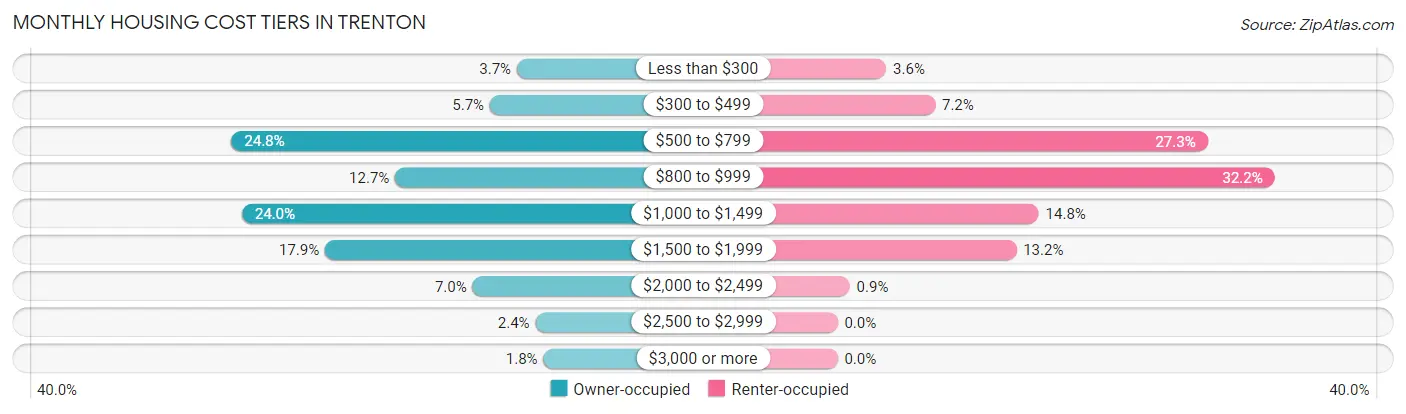
| Monthly Cost | Owner-occupied | Renter-occupied |
| Less than $300 | 251 (3.7%) | 48 (3.6%) |
| $300 to $499 | 385 (5.7%) | 96 (7.2%) |
| $500 to $799 | 1,664 (24.8%) | 364 (27.3%) |
| $800 to $999 | 854 (12.7%) | 430 (32.2%) |
| $1,000 to $1,499 | 1,612 (24.0%) | 198 (14.8%) |
| $1,500 to $1,999 | 1,200 (17.9%) | 176 (13.2%) |
| $2,000 to $2,499 | 471 (7.0%) | 12 (0.9%) |
| $2,500 to $2,999 | 160 (2.4%) | 0 (0.0%) |
| $3,000 or more | 120 (1.8%) | 0 (0.0%) |
| Total | 6,717 (100.0%) | 1,336 (100.0%) |
Physical Housing Characteristics in Trenton
Housing Structures in Trenton
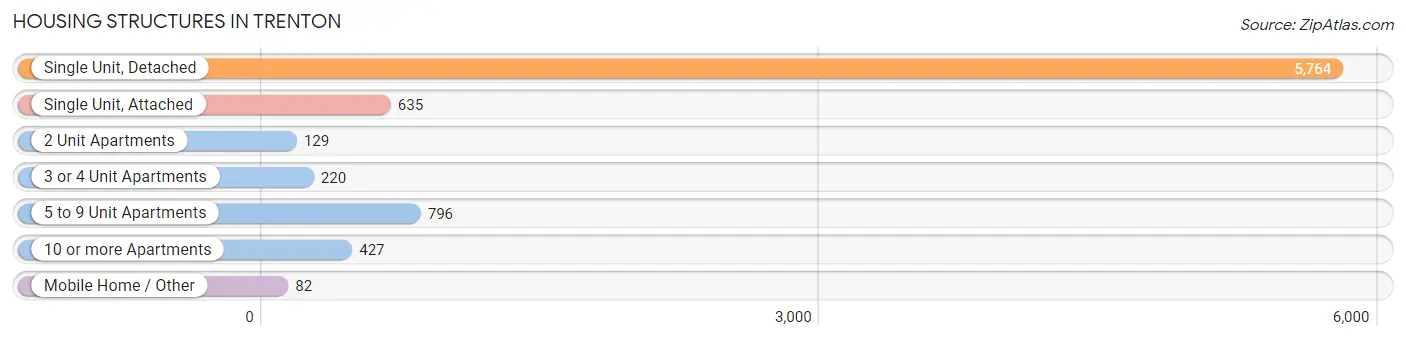
| Structure Type | # Housing Units | % Housing Units |
| Single Unit, Detached | 5,764 | 71.6% |
| Single Unit, Attached | 635 | 7.9% |
| 2 Unit Apartments | 129 | 1.6% |
| 3 or 4 Unit Apartments | 220 | 2.7% |
| 5 to 9 Unit Apartments | 796 | 9.9% |
| 10 or more Apartments | 427 | 5.3% |
| Mobile Home / Other | 82 | 1.0% |
| Total | 8,053 | 100.0% |
Housing Structures by Occupancy in Trenton
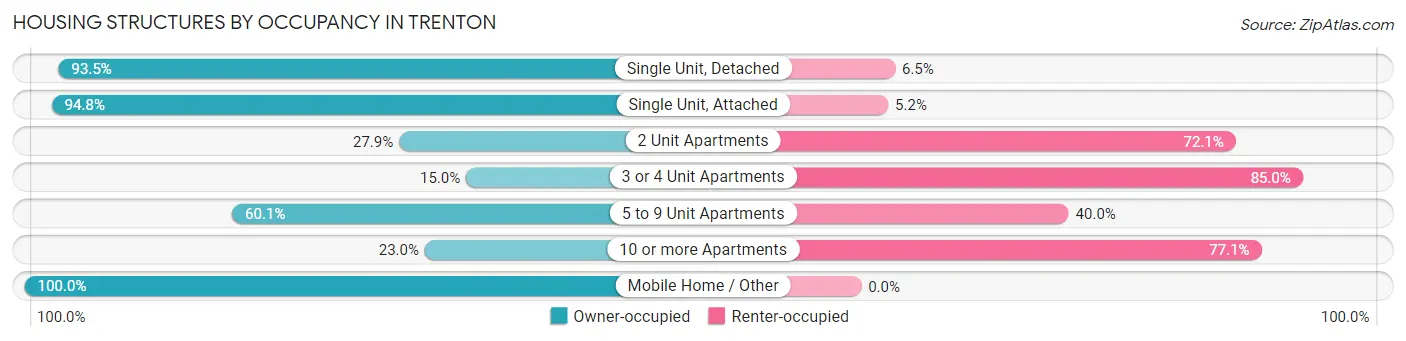
| Structure Type | Owner-occupied | Renter-occupied |
| Single Unit, Detached | 5,388 (93.5%) | 376 (6.5%) |
| Single Unit, Attached | 602 (94.8%) | 33 (5.2%) |
| 2 Unit Apartments | 36 (27.9%) | 93 (72.1%) |
| 3 or 4 Unit Apartments | 33 (15.0%) | 187 (85.0%) |
| 5 to 9 Unit Apartments | 478 (60.1%) | 318 (40.0%) |
| 10 or more Apartments | 98 (23.0%) | 329 (77.0%) |
| Mobile Home / Other | 82 (100.0%) | 0 (0.0%) |
| Total | 6,717 (83.4%) | 1,336 (16.6%) |
Housing Structures by Number of Rooms in Trenton
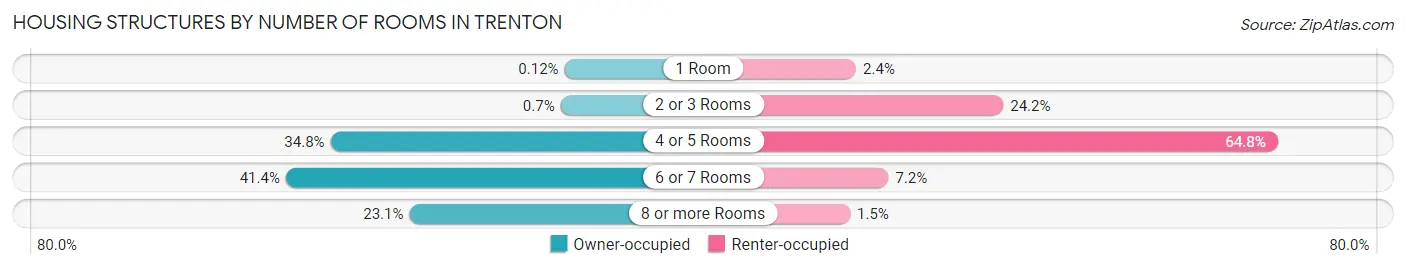
| Number of Rooms | Owner-occupied | Renter-occupied |
| 1 Room | 8 (0.1%) | 32 (2.4%) |
| 2 or 3 Rooms | 47 (0.7%) | 323 (24.2%) |
| 4 or 5 Rooms | 2,334 (34.7%) | 865 (64.7%) |
| 6 or 7 Rooms | 2,778 (41.4%) | 96 (7.2%) |
| 8 or more Rooms | 1,550 (23.1%) | 20 (1.5%) |
| Total | 6,717 (100.0%) | 1,336 (100.0%) |
Housing Structure by Heating Type in Trenton
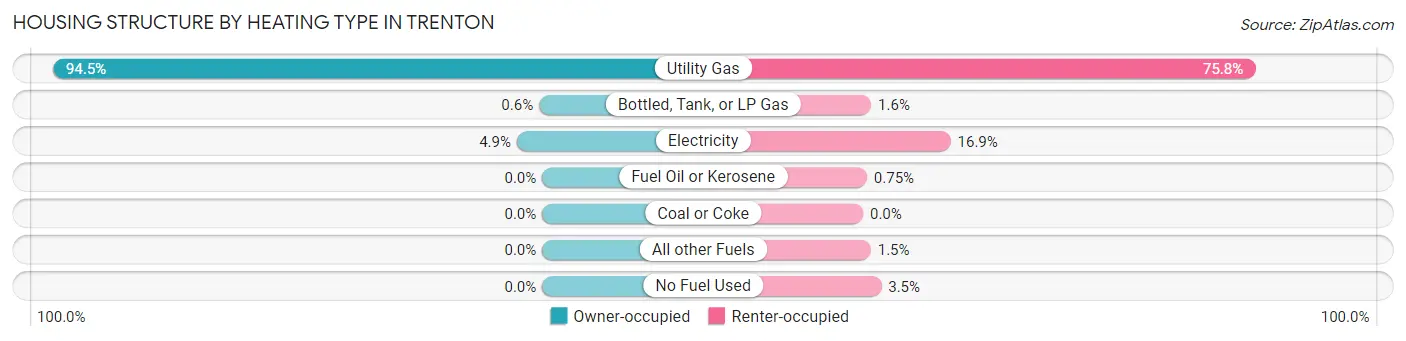
| Heating Type | Owner-occupied | Renter-occupied |
| Utility Gas | 6,349 (94.5%) | 1,012 (75.7%) |
| Bottled, Tank, or LP Gas | 40 (0.6%) | 21 (1.6%) |
| Electricity | 328 (4.9%) | 226 (16.9%) |
| Fuel Oil or Kerosene | 0 (0.0%) | 10 (0.7%) |
| Coal or Coke | 0 (0.0%) | 0 (0.0%) |
| All other Fuels | 0 (0.0%) | 20 (1.5%) |
| No Fuel Used | 0 (0.0%) | 47 (3.5%) |
| Total | 6,717 (100.0%) | 1,336 (100.0%) |
Household Vehicle Usage in Trenton
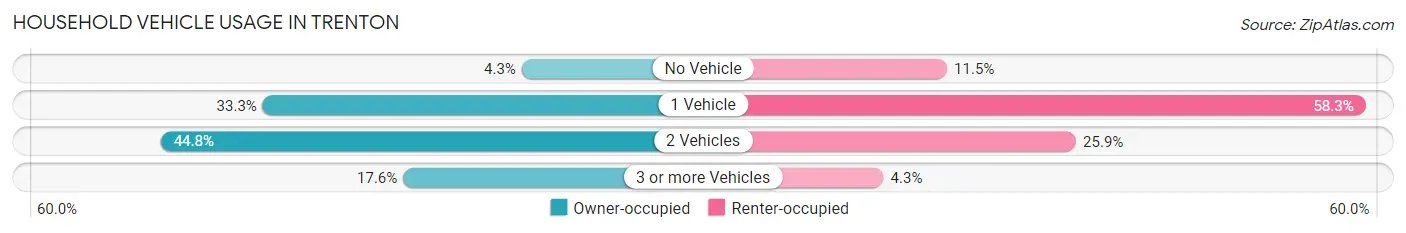
| Vehicles per Household | Owner-occupied | Renter-occupied |
| No Vehicle | 290 (4.3%) | 153 (11.5%) |
| 1 Vehicle | 2,239 (33.3%) | 779 (58.3%) |
| 2 Vehicles | 3,006 (44.8%) | 346 (25.9%) |
| 3 or more Vehicles | 1,182 (17.6%) | 58 (4.3%) |
| Total | 6,717 (100.0%) | 1,336 (100.0%) |
Real Estate & Mortgages in Trenton
Real Estate and Mortgage Overview in Trenton
| Characteristic | Without Mortgage | With Mortgage |
| Housing Units | 3,124 | 3,593 |
| Median Property Value | $173,100 | $199,200 |
| Median Household Income | $61,000 | $957 |
| Monthly Housing Costs | $667 | $120 |
| Real Estate Taxes | $3,584 | $138 |
Property Value by Mortgage Status in Trenton
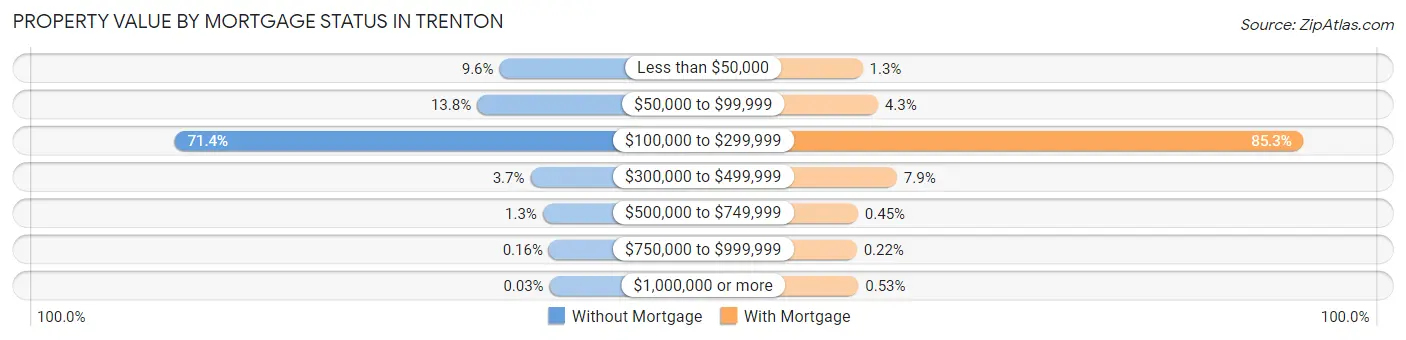
| Property Value | Without Mortgage | With Mortgage |
| Less than $50,000 | 299 (9.6%) | 48 (1.3%) |
| $50,000 to $99,999 | 432 (13.8%) | 153 (4.3%) |
| $100,000 to $299,999 | 2,231 (71.4%) | 3,066 (85.3%) |
| $300,000 to $499,999 | 115 (3.7%) | 283 (7.9%) |
| $500,000 to $749,999 | 41 (1.3%) | 16 (0.4%) |
| $750,000 to $999,999 | 5 (0.2%) | 8 (0.2%) |
| $1,000,000 or more | 1 (0.0%) | 19 (0.5%) |
| Total | 3,124 (100.0%) | 3,593 (100.0%) |
Household Income by Mortgage Status in Trenton
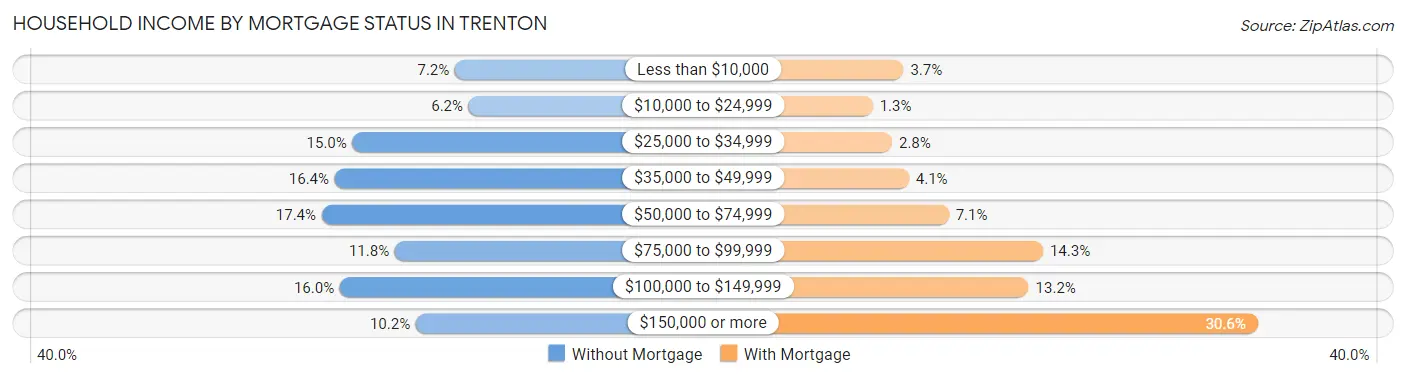
| Household Income | Without Mortgage | With Mortgage |
| Less than $10,000 | 225 (7.2%) | 131 (3.6%) |
| $10,000 to $24,999 | 192 (6.1%) | 47 (1.3%) |
| $25,000 to $34,999 | 469 (15.0%) | 100 (2.8%) |
| $35,000 to $49,999 | 511 (16.4%) | 146 (4.1%) |
| $50,000 to $74,999 | 542 (17.3%) | 255 (7.1%) |
| $75,000 to $99,999 | 368 (11.8%) | 513 (14.3%) |
| $100,000 to $149,999 | 499 (16.0%) | 474 (13.2%) |
| $150,000 or more | 318 (10.2%) | 1,101 (30.6%) |
| Total | 3,124 (100.0%) | 3,593 (100.0%) |
Property Value to Household Income Ratio in Trenton
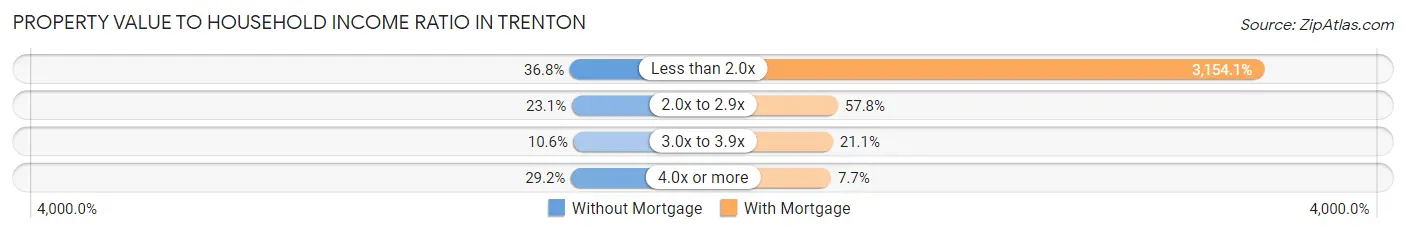
| Value-to-Income Ratio | Without Mortgage | With Mortgage |
| Less than 2.0x | 1,149 (36.8%) | 113,327 (3,154.1%) |
| 2.0x to 2.9x | 720 (23.1%) | 2,075 (57.8%) |
| 3.0x to 3.9x | 331 (10.6%) | 757 (21.1%) |
| 4.0x or more | 913 (29.2%) | 278 (7.7%) |
| Total | 3,124 (100.0%) | 3,593 (100.0%) |
Real Estate Taxes by Mortgage Status in Trenton
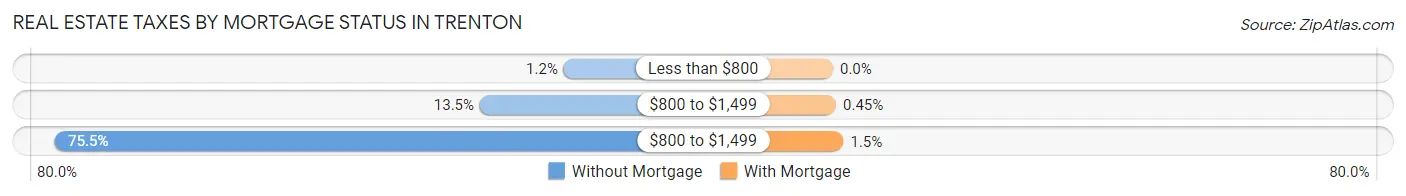
| Property Taxes | Without Mortgage | With Mortgage |
| Less than $800 | 38 (1.2%) | 0 (0.0%) |
| $800 to $1,499 | 421 (13.5%) | 16 (0.4%) |
| $800 to $1,499 | 2,360 (75.5%) | 55 (1.5%) |
| Total | 3,124 (100.0%) | 3,593 (100.0%) |
Health & Disability in Trenton
Health Insurance Coverage by Age in Trenton
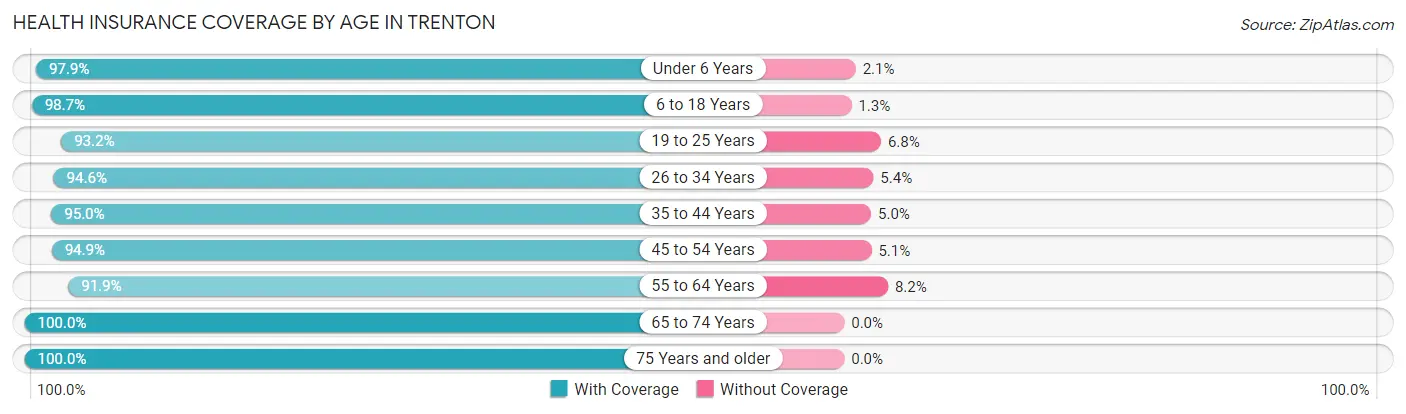
| Age Bracket | With Coverage | Without Coverage |
| Under 6 Years | 1,012 (97.9%) | 22 (2.1%) |
| 6 to 18 Years | 2,655 (98.7%) | 36 (1.3%) |
| 19 to 25 Years | 1,116 (93.2%) | 82 (6.8%) |
| 26 to 34 Years | 1,410 (94.6%) | 81 (5.4%) |
| 35 to 44 Years | 1,766 (95.0%) | 93 (5.0%) |
| 45 to 54 Years | 2,477 (94.9%) | 132 (5.1%) |
| 55 to 64 Years | 2,782 (91.8%) | 247 (8.2%) |
| 65 to 74 Years | 2,391 (100.0%) | 0 (0.0%) |
| 75 Years and older | 1,936 (100.0%) | 0 (0.0%) |
| Total | 17,545 (96.2%) | 693 (3.8%) |
Health Insurance Coverage by Citizenship Status in Trenton
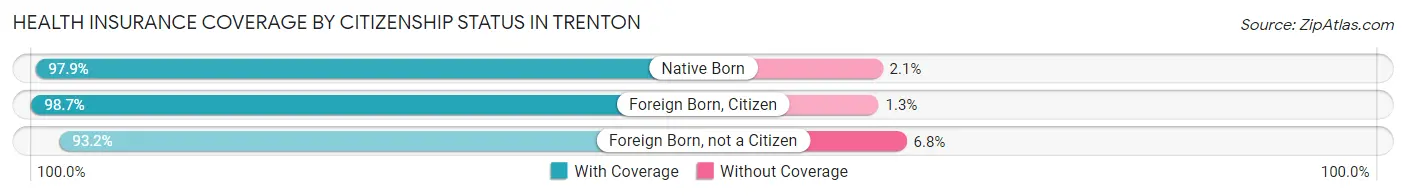
| Citizenship Status | With Coverage | Without Coverage |
| Native Born | 1,012 (97.9%) | 22 (2.1%) |
| Foreign Born, Citizen | 2,655 (98.7%) | 36 (1.3%) |
| Foreign Born, not a Citizen | 1,116 (93.2%) | 82 (6.8%) |
Health Insurance Coverage by Household Income in Trenton
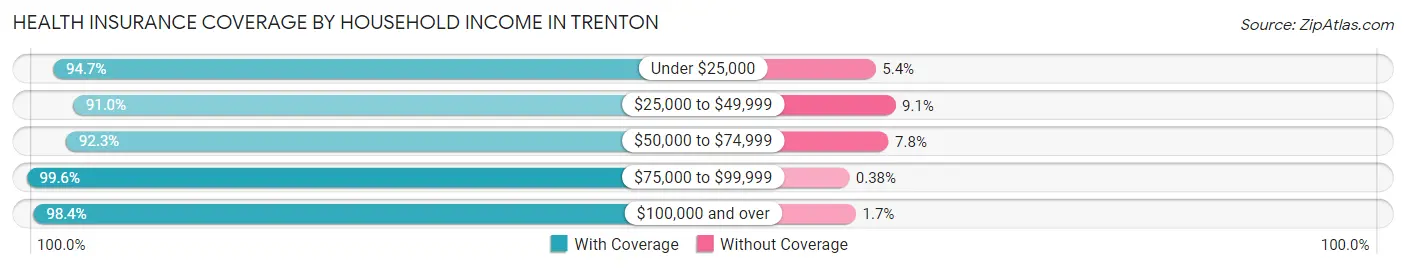
| Household Income | With Coverage | Without Coverage |
| Under $25,000 | 1,397 (94.7%) | 79 (5.3%) |
| $25,000 to $49,999 | 2,230 (90.9%) | 222 (9.0%) |
| $50,000 to $74,999 | 2,810 (92.2%) | 236 (7.7%) |
| $75,000 to $99,999 | 2,335 (99.6%) | 9 (0.4%) |
| $100,000 and over | 8,753 (98.4%) | 147 (1.7%) |
Public vs Private Health Insurance Coverage by Age in Trenton
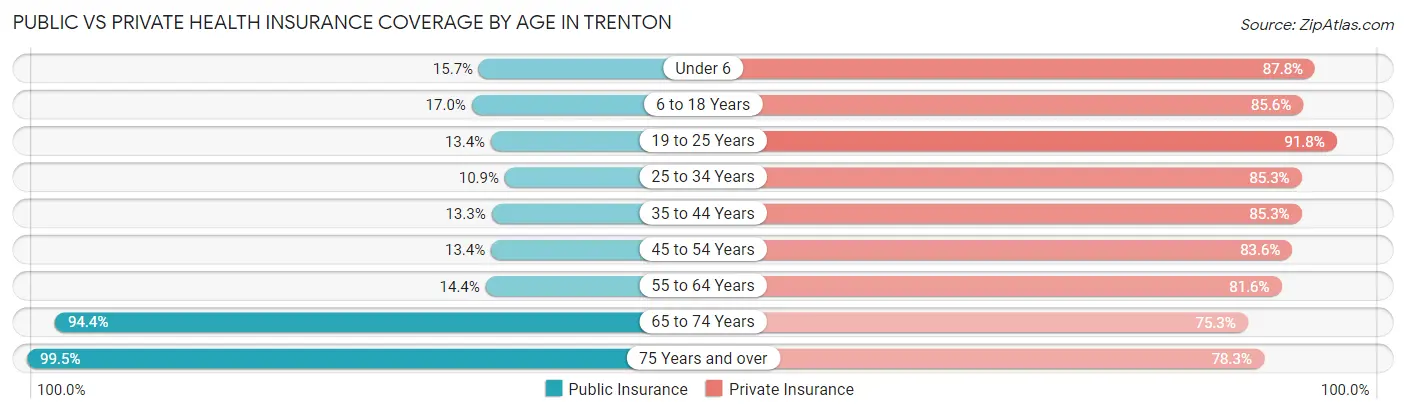
| Age Bracket | Public Insurance | Private Insurance |
| Under 6 | 162 (15.7%) | 908 (87.8%) |
| 6 to 18 Years | 458 (17.0%) | 2,304 (85.6%) |
| 19 to 25 Years | 161 (13.4%) | 1,100 (91.8%) |
| 25 to 34 Years | 162 (10.9%) | 1,272 (85.3%) |
| 35 to 44 Years | 248 (13.3%) | 1,586 (85.3%) |
| 45 to 54 Years | 350 (13.4%) | 2,181 (83.6%) |
| 55 to 64 Years | 437 (14.4%) | 2,471 (81.6%) |
| 65 to 74 Years | 2,256 (94.4%) | 1,801 (75.3%) |
| 75 Years and over | 1,927 (99.5%) | 1,516 (78.3%) |
| Total | 6,161 (33.8%) | 15,139 (83.0%) |
Disability Status by Sex by Age in Trenton
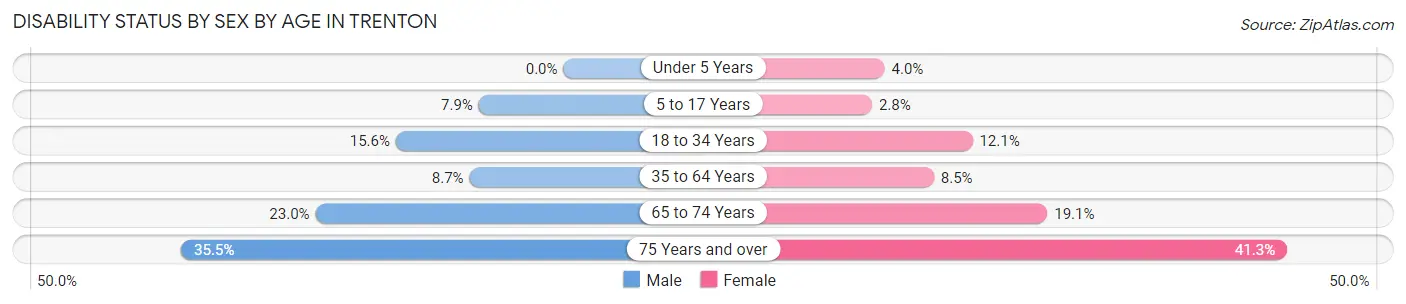
| Age Bracket | Male | Female |
| Under 5 Years | 0 (0.0%) | 12 (4.0%) |
| 5 to 17 Years | 122 (7.9%) | 35 (2.8%) |
| 18 to 34 Years | 235 (15.5%) | 159 (12.1%) |
| 35 to 64 Years | 322 (8.7%) | 325 (8.5%) |
| 65 to 74 Years | 240 (23.0%) | 257 (19.1%) |
| 75 Years and over | 237 (35.5%) | 524 (41.3%) |
Disability Class by Sex by Age in Trenton
Disability Class: Hearing Difficulty
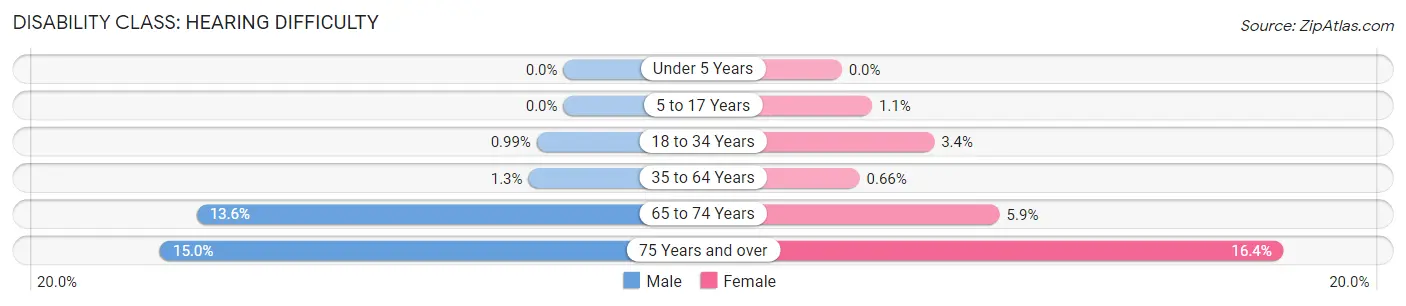
| Age Bracket | Male | Female |
| Under 5 Years | 0 (0.0%) | 0 (0.0%) |
| 5 to 17 Years | 0 (0.0%) | 14 (1.1%) |
| 18 to 34 Years | 15 (1.0%) | 45 (3.4%) |
| 35 to 64 Years | 48 (1.3%) | 25 (0.7%) |
| 65 to 74 Years | 142 (13.6%) | 79 (5.9%) |
| 75 Years and over | 100 (15.0%) | 208 (16.4%) |
Disability Class: Vision Difficulty
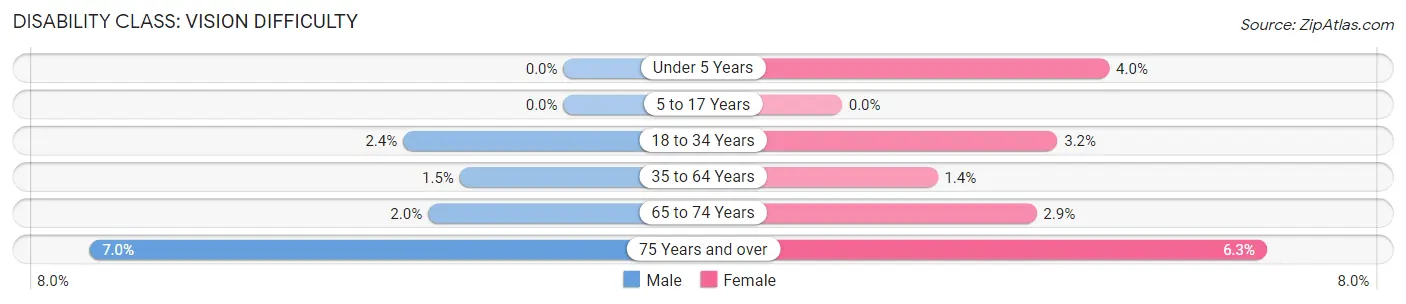
| Age Bracket | Male | Female |
| Under 5 Years | 0 (0.0%) | 12 (4.0%) |
| 5 to 17 Years | 0 (0.0%) | 0 (0.0%) |
| 18 to 34 Years | 36 (2.4%) | 42 (3.2%) |
| 35 to 64 Years | 57 (1.5%) | 54 (1.4%) |
| 65 to 74 Years | 21 (2.0%) | 39 (2.9%) |
| 75 Years and over | 47 (7.0%) | 80 (6.3%) |
Disability Class: Cognitive Difficulty
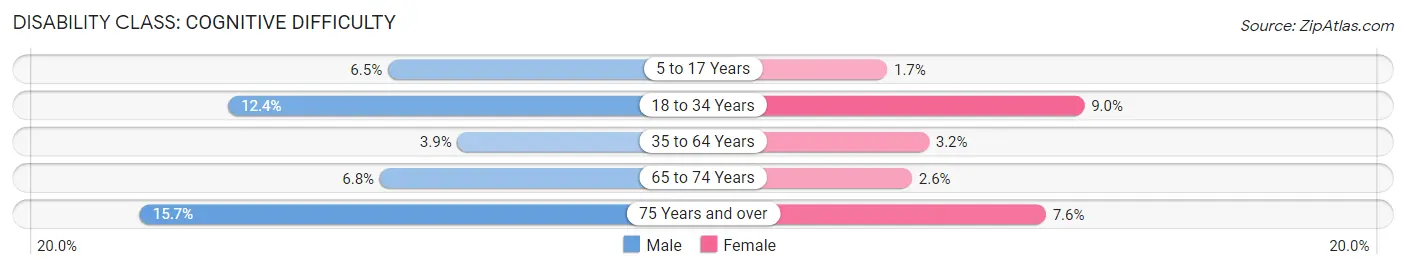
| Age Bracket | Male | Female |
| 5 to 17 Years | 101 (6.5%) | 21 (1.7%) |
| 18 to 34 Years | 188 (12.4%) | 118 (9.0%) |
| 35 to 64 Years | 145 (3.9%) | 123 (3.2%) |
| 65 to 74 Years | 71 (6.8%) | 35 (2.6%) |
| 75 Years and over | 105 (15.7%) | 96 (7.6%) |
Disability Class: Ambulatory Difficulty
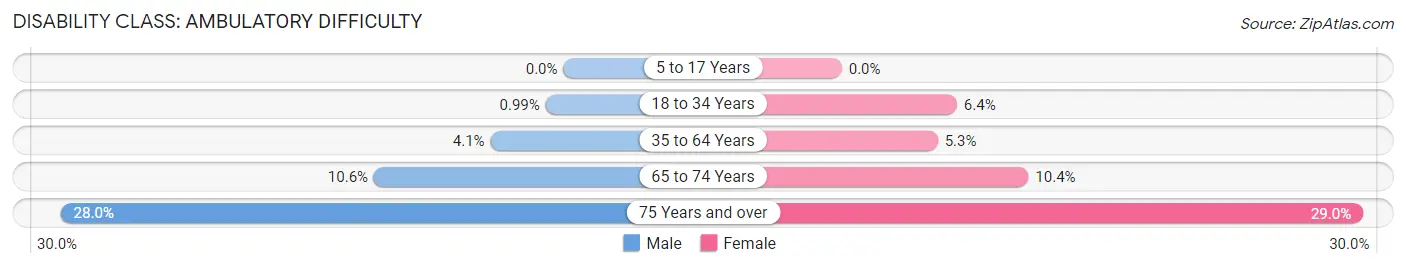
| Age Bracket | Male | Female |
| 5 to 17 Years | 0 (0.0%) | 0 (0.0%) |
| 18 to 34 Years | 15 (1.0%) | 84 (6.4%) |
| 35 to 64 Years | 150 (4.1%) | 203 (5.3%) |
| 65 to 74 Years | 110 (10.5%) | 140 (10.4%) |
| 75 Years and over | 187 (28.0%) | 368 (29.0%) |
Disability Class: Self-Care Difficulty
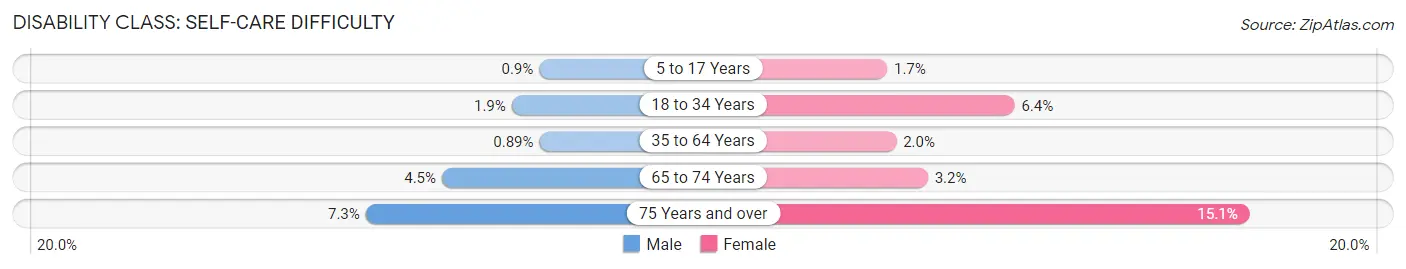
| Age Bracket | Male | Female |
| 5 to 17 Years | 14 (0.9%) | 21 (1.7%) |
| 18 to 34 Years | 29 (1.9%) | 84 (6.4%) |
| 35 to 64 Years | 33 (0.9%) | 77 (2.0%) |
| 65 to 74 Years | 47 (4.5%) | 43 (3.2%) |
| 75 Years and over | 49 (7.3%) | 192 (15.1%) |
Technology Access in Trenton
Computing Device Access in Trenton
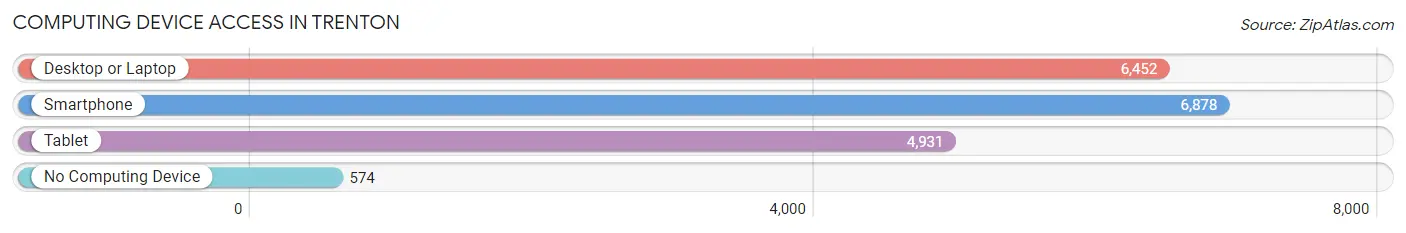
| Device Type | # Households | % Households |
| Desktop or Laptop | 6,452 | 80.1% |
| Smartphone | 6,878 | 85.4% |
| Tablet | 4,931 | 61.2% |
| No Computing Device | 574 | 7.1% |
| Total | 8,053 | 100.0% |
Internet Access in Trenton
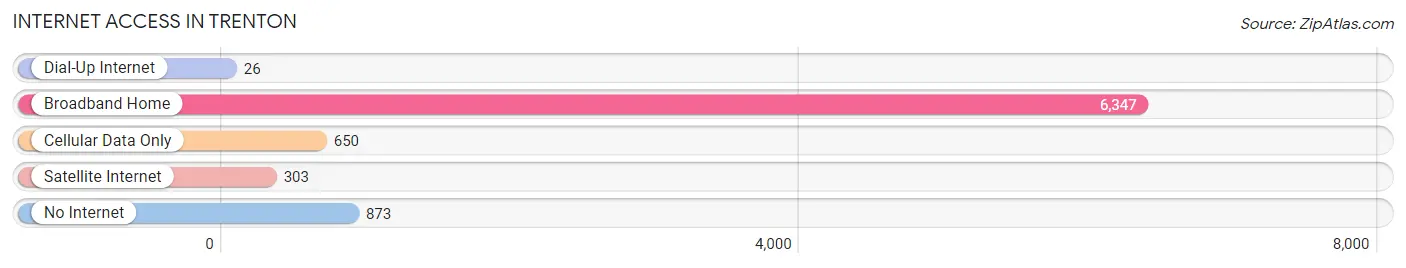
| Internet Type | # Households | % Households |
| Dial-Up Internet | 26 | 0.3% |
| Broadband Home | 6,347 | 78.8% |
| Cellular Data Only | 650 | 8.1% |
| Satellite Internet | 303 | 3.8% |
| No Internet | 873 | 10.8% |
| Total | 8,053 | 100.0% |
Trenton Summary
Trenton, Michigan is a small city located in Wayne County, Michigan. It is situated on the Detroit River, just south of the city of Detroit. The city has a population of 18,853 as of the 2010 census, making it the second largest city in Wayne County.
History
Trenton was first settled in 1816 by a group of French-Canadian immigrants. The city was originally known as Maguaga, after the nearby river of the same name. The name was changed to Trenton in 1827, after the city of Trenton, New Jersey. The city was incorporated in 1855.
Trenton was an important industrial center during the 19th and early 20th centuries. It was home to several factories, including the Detroit Stove Works, which manufactured stoves and other household appliances. The city also had a large shipbuilding industry, and was home to several shipyards.
During the 20th century, Trenton experienced a period of decline. Many of the factories and shipyards closed, and the population began to decline. In recent years, however, the city has seen a resurgence. The city has become a popular destination for tourists, and has seen an increase in new businesses and development.
Geography
Trenton is located in southeastern Michigan, on the Detroit River. It is bordered by the cities of Grosse Ile to the north, Riverview to the east, and Woodhaven to the south. The city covers an area of 8.3 square miles, and has a population density of 2,250 people per square mile.
The city is located in a humid continental climate zone, with hot, humid summers and cold, snowy winters. The average temperature in July is 79°F, and the average temperature in January is 22°F. The average annual precipitation is 33 inches.
Economy
Trenton’s economy is largely based on manufacturing and tourism. The city is home to several factories, including the Detroit Stove Works, which manufactures stoves and other household appliances. The city also has a large shipbuilding industry, and is home to several shipyards.
The city is also a popular tourist destination. It is home to several parks and recreational areas, including Elizabeth Park, which is located on the Detroit River. The city also has several museums, including the Trenton Historical Museum and the Trenton Art Center.
Demographics
As of the 2010 census, Trenton had a population of 18,853. The racial makeup of the city was 79.3% White, 14.2% African American, 0.5% Native American, 1.3% Asian, and 4.7% from other races. Hispanic or Latino of any race were 6.2% of the population.
The median household income in Trenton was $45,845, and the median family income was $54,845. The per capita income was $22,845. About 11.3% of the population was below the poverty line.
Trenton is served by the Trenton Public Schools district. The district has seven elementary schools, two middle schools, and one high school. The city is also home to several private schools, including St. Mary’s Catholic School and the Trenton Academy.
Common Questions
What is Per Capita Income in Trenton?
Per Capita income in Trenton is $45,167.
What is the Median Family Income in Trenton?
Median Family Income in Trenton is $101,766.
What is the Median Household income in Trenton?
Median Household Income in Trenton is $74,267.
What is Income or Wage Gap in Trenton?
Income or Wage Gap in Trenton is 43.8%.
Women in Trenton earn 56.2 cents for every dollar earned by a man.
What is Inequality or Gini Index in Trenton?
Inequality or Gini Index in Trenton is 0.45.
What is the Total Population of Trenton?
Total Population of Trenton is 18,420.
What is the Total Male Population of Trenton?
Total Male Population of Trenton is 9,013.
What is the Total Female Population of Trenton?
Total Female Population of Trenton is 9,407.
What is the Ratio of Males per 100 Females in Trenton?
There are 95.81 Males per 100 Females in Trenton.
What is the Ratio of Females per 100 Males in Trenton?
There are 104.37 Females per 100 Males in Trenton.
What is the Median Population Age in Trenton?
Median Population Age in Trenton is 49.1 Years.
What is the Average Family Size in Trenton
Average Family Size in Trenton is 3.0 People.
What is the Average Household Size in Trenton
Average Household Size in Trenton is 2.3 People.
How Large is the Labor Force in Trenton?
There are 8,841 People in the Labor Forcein in Trenton.
What is the Percentage of People in the Labor Force in Trenton?
57.5% of People are in the Labor Force in Trenton.
What is the Unemployment Rate in Trenton?
Unemployment Rate in Trenton is 3.3%.