Pontiac, MI Map & Demographics
Pontiac Map
Pontiac Overview
$23,024
PER CAPITA INCOME
$53,386
AVG FAMILY INCOME
$40,307
AVG HOUSEHOLD INCOME
15.8%
WAGE / INCOME GAP [ % ]
84.2¢/ $1
WAGE / INCOME GAP [ $ ]
$12,079
FAMILY INCOME DEFICIT
0.45
INEQUALITY / GINI INDEX
61,965
TOTAL POPULATION
29,966
MALE POPULATION
31,999
FEMALE POPULATION
93.65
MALES / 100 FEMALES
106.78
FEMALES / 100 MALES
33.8
MEDIAN AGE
3.3
AVG FAMILY SIZE
2.4
AVG HOUSEHOLD SIZE
28,917
LABOR FORCE [ PEOPLE ]
59.7%
PERCENT IN LABOR FORCE
9.5%
UNEMPLOYMENT RATE
Income in Pontiac
Income Overview in Pontiac
Per Capita Income in Pontiac is $23,024, while median incomes of families and households are $53,386 and $40,307 respectively.
| Characteristic | Number | Measure |
| Per Capita Income | 61,965 | $23,024 |
| Median Family Income | 13,077 | $53,386 |
| Mean Family Income | 13,077 | $63,204 |
| Median Household Income | 25,343 | $40,307 |
| Mean Household Income | 25,343 | $53,499 |
| Income Deficit | 13,077 | $12,079 |
| Wage / Income Gap (%) | 61,965 | 15.81% |
| Wage / Income Gap ($) | 61,965 | 84.19¢ per $1 |
| Gini / Inequality Index | 61,965 | 0.45 |
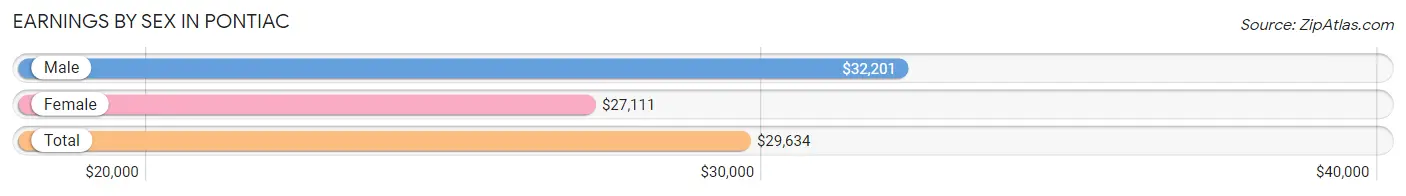
Earnings by Sex in Pontiac
Average Earnings in Pontiac are $29,634, $32,201 for men and $27,111 for women, a difference of 15.8%.
| Sex | Number | Average Earnings |
| Male | 15,173 (49.8%) | $32,201 |
| Female | 15,286 (50.2%) | $27,111 |
| Total | 30,459 (100.0%) | $29,634 |
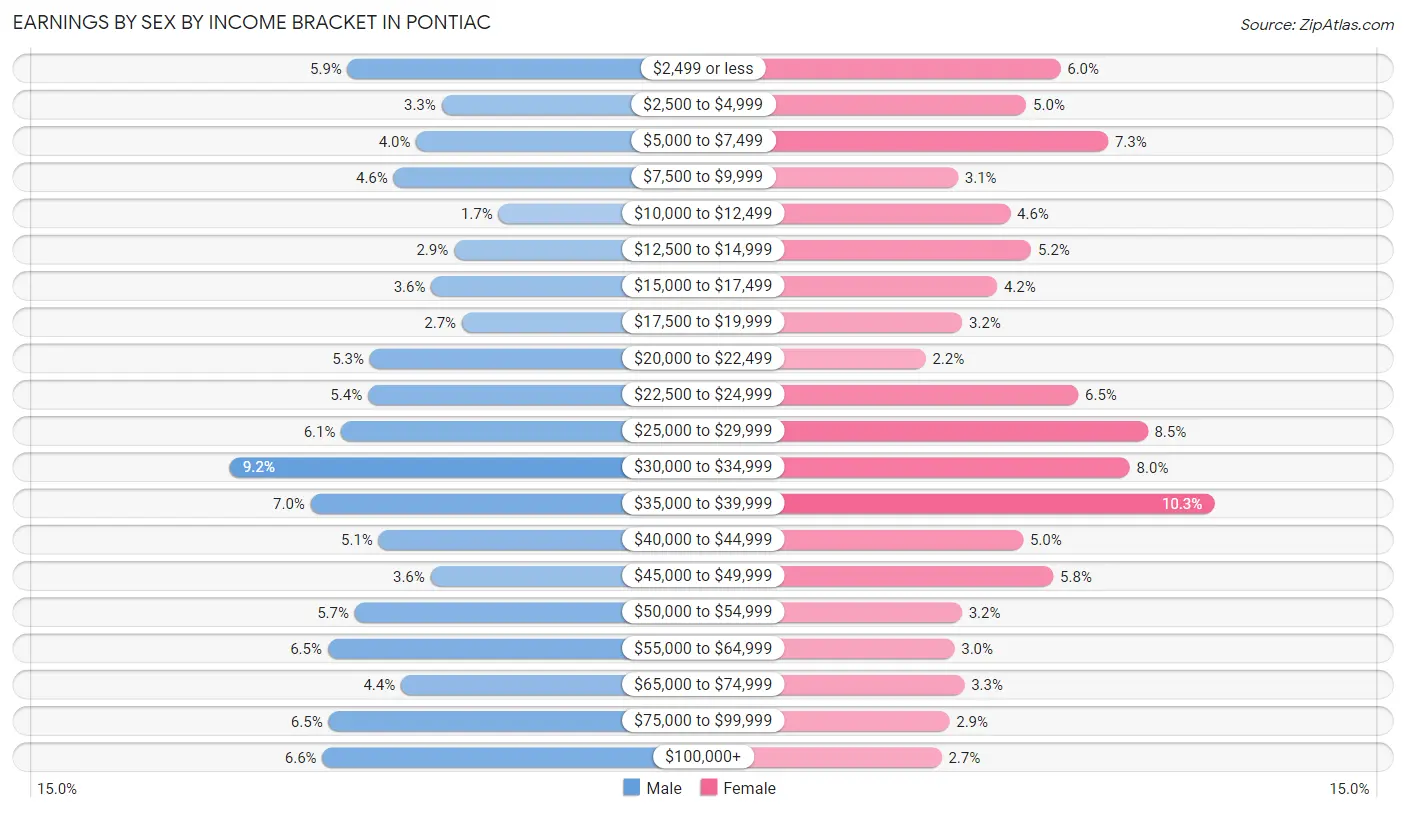
Earnings by Sex by Income Bracket in Pontiac
The most common earnings brackets in Pontiac are $30,000 to $34,999 for men (1,401 | 9.2%) and $35,000 to $39,999 for women (1,577 | 10.3%).
| Income | Male | Female |
| $2,499 or less | 899 (5.9%) | 917 (6.0%) |
| $2,500 to $4,999 | 498 (3.3%) | 770 (5.0%) |
| $5,000 to $7,499 | 606 (4.0%) | 1,122 (7.3%) |
| $7,500 to $9,999 | 703 (4.6%) | 477 (3.1%) |
| $10,000 to $12,499 | 255 (1.7%) | 702 (4.6%) |
| $12,500 to $14,999 | 445 (2.9%) | 792 (5.2%) |
| $15,000 to $17,499 | 541 (3.6%) | 645 (4.2%) |
| $17,500 to $19,999 | 411 (2.7%) | 495 (3.2%) |
| $20,000 to $22,499 | 804 (5.3%) | 338 (2.2%) |
| $22,500 to $24,999 | 812 (5.3%) | 994 (6.5%) |
| $25,000 to $29,999 | 925 (6.1%) | 1,291 (8.5%) |
| $30,000 to $34,999 | 1,401 (9.2%) | 1,216 (8.0%) |
| $35,000 to $39,999 | 1,056 (7.0%) | 1,577 (10.3%) |
| $40,000 to $44,999 | 766 (5.1%) | 757 (5.0%) |
| $45,000 to $49,999 | 544 (3.6%) | 886 (5.8%) |
| $50,000 to $54,999 | 868 (5.7%) | 493 (3.2%) |
| $55,000 to $64,999 | 983 (6.5%) | 462 (3.0%) |
| $65,000 to $74,999 | 670 (4.4%) | 505 (3.3%) |
| $75,000 to $99,999 | 980 (6.5%) | 441 (2.9%) |
| $100,000+ | 1,006 (6.6%) | 406 (2.7%) |
| Total | 15,173 (100.0%) | 15,286 (100.0%) |
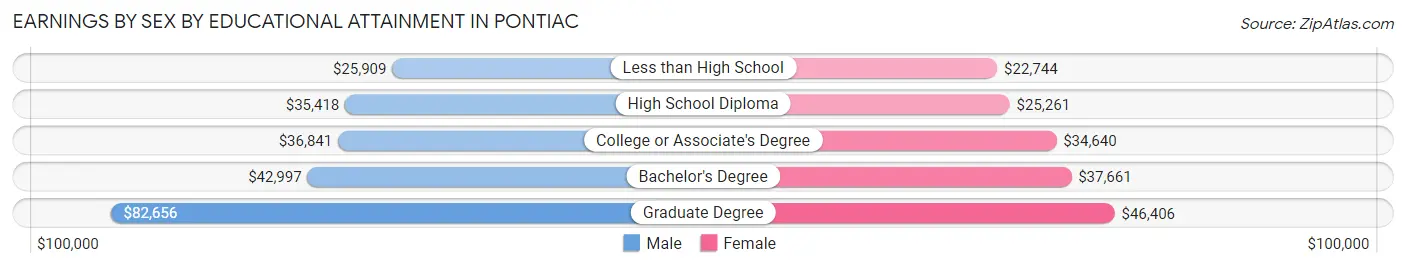
Earnings by Sex by Educational Attainment in Pontiac
Average earnings in Pontiac are $35,590 for men and $30,874 for women, a difference of 13.3%. Men with an educational attainment of graduate degree enjoy the highest average annual earnings of $82,656, while those with less than high school education earn the least with $25,909. Women with an educational attainment of graduate degree earn the most with the average annual earnings of $46,406, while those with less than high school education have the smallest earnings of $22,744.
| Educational Attainment | Male Income | Female Income |
| Less than High School | $25,909 | $22,744 |
| High School Diploma | $35,418 | $25,261 |
| College or Associate's Degree | $36,841 | $34,640 |
| Bachelor's Degree | $42,997 | $37,661 |
| Graduate Degree | $82,656 | $46,406 |
| Total | $35,590 | $30,874 |
Family Income in Pontiac
Family Income Brackets in Pontiac
According to the Pontiac family income data, there are 2,733 families falling into the $50,000 to $74,999 income range, which is the most common income bracket and makes up 20.9% of all families. Conversely, the $200,000+ income bracket is the least frequent group with only 170 families (1.3%) belonging to this category.
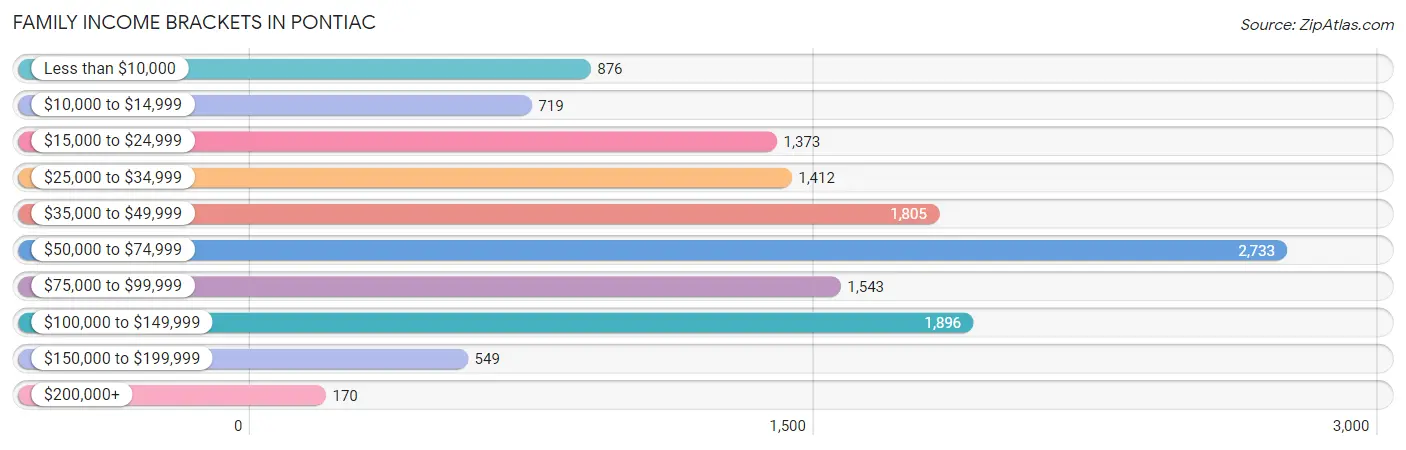
| Income Bracket | # Families | % Families |
| Less than $10,000 | 876 | 6.7% |
| $10,000 to $14,999 | 719 | 5.5% |
| $15,000 to $24,999 | 1,373 | 10.5% |
| $25,000 to $34,999 | 1,412 | 10.8% |
| $35,000 to $49,999 | 1,805 | 13.8% |
| $50,000 to $74,999 | 2,733 | 20.9% |
| $75,000 to $99,999 | 1,543 | 11.8% |
| $100,000 to $149,999 | 1,896 | 14.5% |
| $150,000 to $199,999 | 549 | 4.2% |
| $200,000+ | 170 | 1.3% |
Family Income by Famaliy Size in Pontiac
7+ person families (454 | 3.5%) account for the highest median family income in Pontiac with $96,366 per family, while 2-person families (5,581 | 42.7%) have the highest median income of $23,238 per family member.
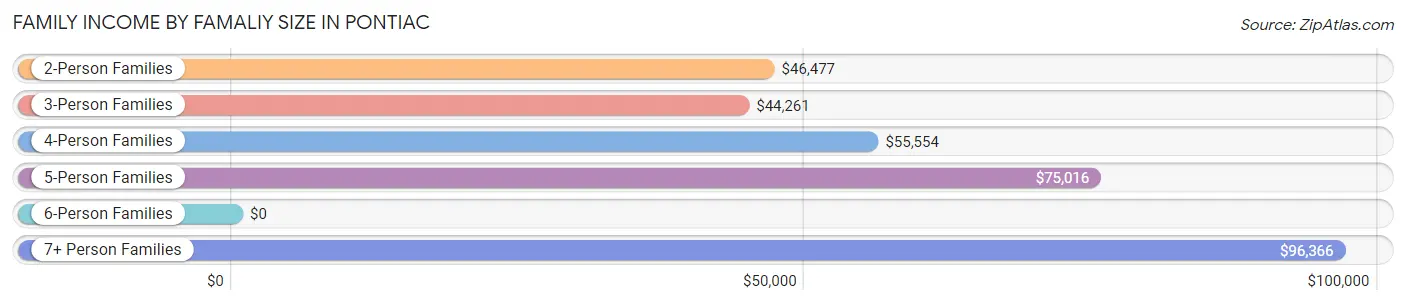
| Income Bracket | # Families | Median Income |
| 2-Person Families | 5,581 (42.7%) | $46,477 |
| 3-Person Families | 3,325 (25.4%) | $44,261 |
| 4-Person Families | 2,107 (16.1%) | $55,554 |
| 5-Person Families | 1,403 (10.7%) | $75,016 |
| 6-Person Families | 207 (1.6%) | $0 |
| 7+ Person Families | 454 (3.5%) | $96,366 |
| Total | 13,077 (100.0%) | $53,386 |
Family Income by Number of Earners in Pontiac
The median family income in Pontiac is $53,386, with families comprising 3+ earners (1,911) having the highest median family income of $106,052, while families with no earners (1,436) have the lowest median family income of $17,727, accounting for 14.6% and 11.0% of families, respectively.
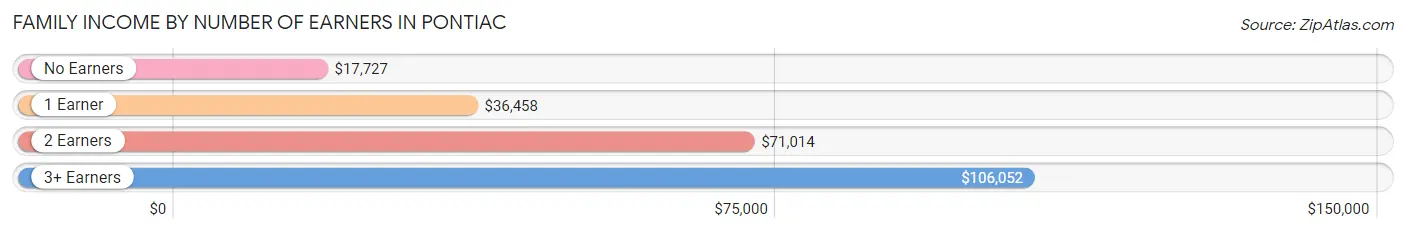
| Number of Earners | # Families | Median Income |
| No Earners | 1,436 (11.0%) | $17,727 |
| 1 Earner | 6,310 (48.2%) | $36,458 |
| 2 Earners | 3,420 (26.2%) | $71,014 |
| 3+ Earners | 1,911 (14.6%) | $106,052 |
| Total | 13,077 (100.0%) | $53,386 |
Household Income in Pontiac
Household Income Brackets in Pontiac
With 4,536 households falling in the category, the $50,000 to $74,999 income range is the most frequent in Pontiac, accounting for 17.9% of all households. In contrast, only 304 households (1.2%) fall into the $200,000+ income bracket, making it the least populous group.
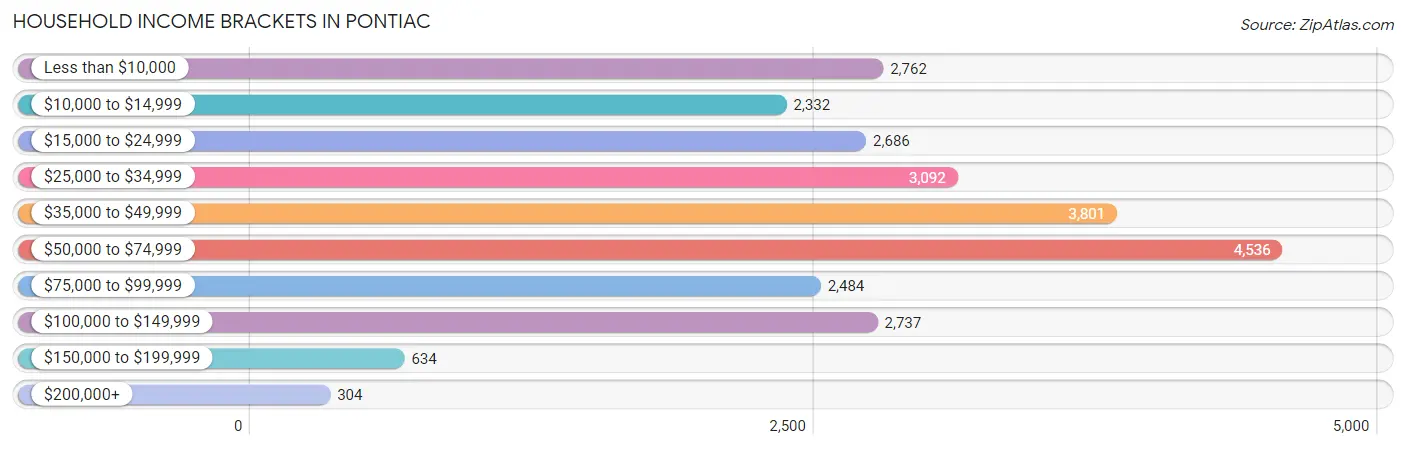
| Income Bracket | # Households | % Households |
| Less than $10,000 | 2,762 | 10.9% |
| $10,000 to $14,999 | 2,332 | 9.2% |
| $15,000 to $24,999 | 2,686 | 10.6% |
| $25,000 to $34,999 | 3,092 | 12.2% |
| $35,000 to $49,999 | 3,801 | 15.0% |
| $50,000 to $74,999 | 4,536 | 17.9% |
| $75,000 to $99,999 | 2,484 | 9.8% |
| $100,000 to $149,999 | 2,737 | 10.8% |
| $150,000 to $199,999 | 634 | 2.5% |
| $200,000+ | 304 | 1.2% |
Household Income by Householder Age in Pontiac
The median household income in Pontiac is $40,307, with the highest median household income of $45,511 found in the 45 to 64 years age bracket for the primary householder. A total of 9,160 households (36.1%) fall into this category. Meanwhile, the 65+ years age bracket for the primary householder has the lowest median household income of $36,727, with 5,747 households (22.7%) in this group.
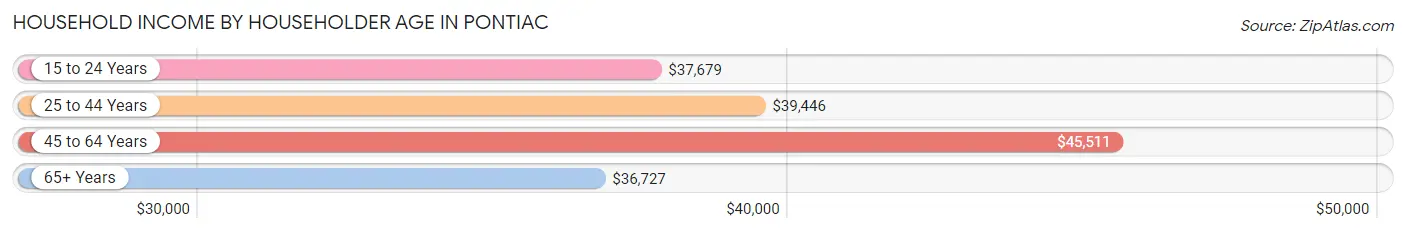
| Income Bracket | # Households | Median Income |
| 15 to 24 Years | 1,317 (5.2%) | $37,679 |
| 25 to 44 Years | 9,119 (36.0%) | $39,446 |
| 45 to 64 Years | 9,160 (36.1%) | $45,511 |
| 65+ Years | 5,747 (22.7%) | $36,727 |
| Total | 25,343 (100.0%) | $40,307 |
Poverty in Pontiac
Income Below Poverty by Sex and Age in Pontiac
With 25.4% poverty level for males and 27.9% for females among the residents of Pontiac, under 5 year old males and 12 to 14 year old females are the most vulnerable to poverty, with 1,110 males (49.4%) and 563 females (57.5%) in their respective age groups living below the poverty level.
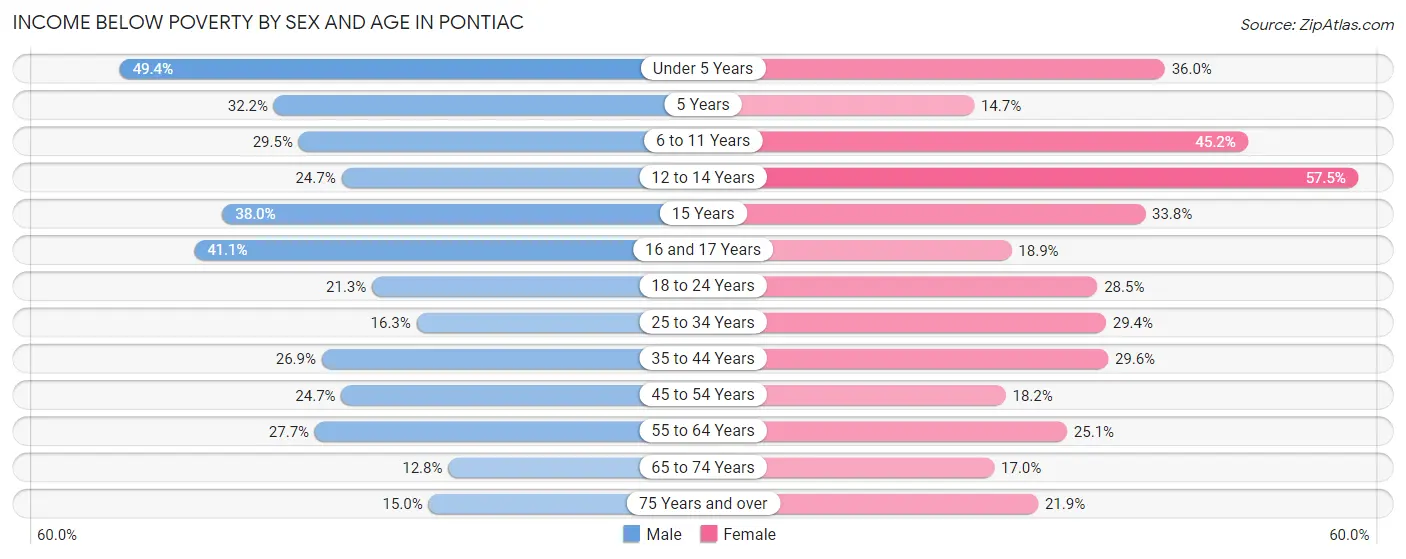
| Age Bracket | Male | Female |
| Under 5 Years | 1,110 (49.4%) | 832 (36.0%) |
| 5 Years | 148 (32.2%) | 96 (14.7%) |
| 6 to 11 Years | 625 (29.5%) | 1,067 (45.2%) |
| 12 to 14 Years | 380 (24.7%) | 563 (57.5%) |
| 15 Years | 101 (38.0%) | 153 (33.8%) |
| 16 and 17 Years | 347 (41.1%) | 174 (18.9%) |
| 18 to 24 Years | 605 (21.3%) | 886 (28.4%) |
| 25 to 34 Years | 760 (16.3%) | 1,491 (29.4%) |
| 35 to 44 Years | 954 (26.9%) | 1,024 (29.6%) |
| 45 to 54 Years | 962 (24.7%) | 736 (18.2%) |
| 55 to 64 Years | 909 (27.7%) | 909 (25.1%) |
| 65 to 74 Years | 287 (12.8%) | 404 (17.0%) |
| 75 Years and over | 121 (15.0%) | 485 (21.8%) |
| Total | 7,309 (25.4%) | 8,820 (27.9%) |
Income Above Poverty by Sex and Age in Pontiac
According to the poverty statistics in Pontiac, males aged 65 to 74 years and females aged 5 years are the age groups that are most secure financially, with 87.2% of males and 85.3% of females in these age groups living above the poverty line.
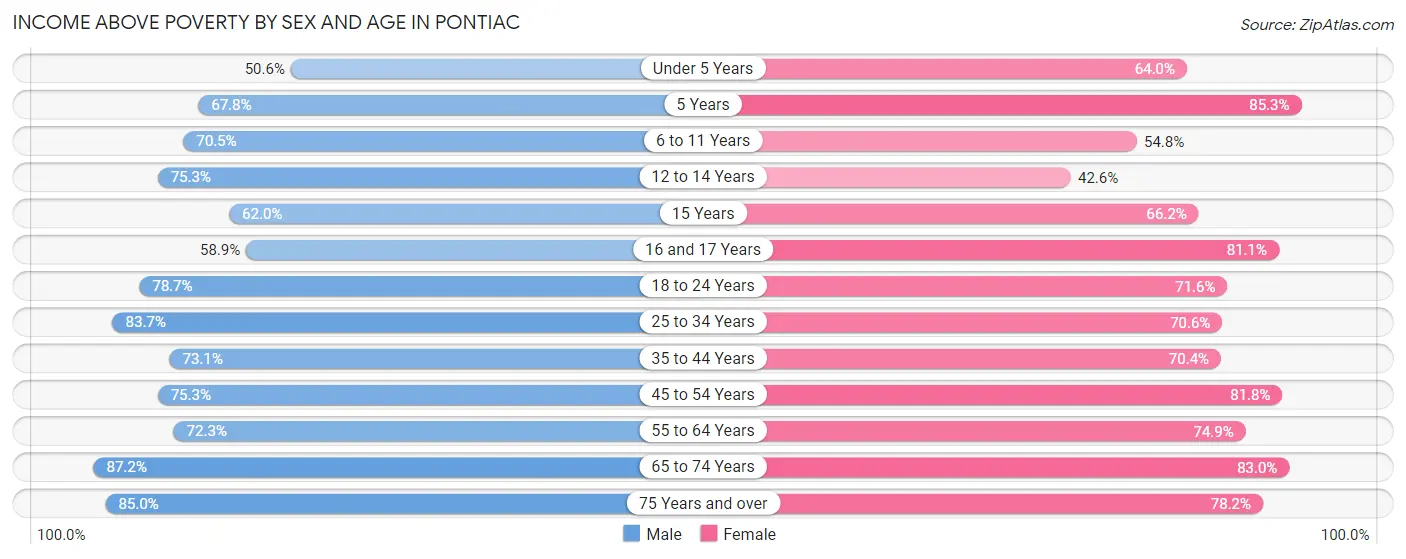
| Age Bracket | Male | Female |
| Under 5 Years | 1,137 (50.6%) | 1,482 (64.0%) |
| 5 Years | 311 (67.8%) | 556 (85.3%) |
| 6 to 11 Years | 1,496 (70.5%) | 1,294 (54.8%) |
| 12 to 14 Years | 1,158 (75.3%) | 417 (42.5%) |
| 15 Years | 165 (62.0%) | 300 (66.2%) |
| 16 and 17 Years | 497 (58.9%) | 747 (81.1%) |
| 18 to 24 Years | 2,236 (78.7%) | 2,228 (71.6%) |
| 25 to 34 Years | 3,890 (83.7%) | 3,580 (70.6%) |
| 35 to 44 Years | 2,593 (73.1%) | 2,431 (70.4%) |
| 45 to 54 Years | 2,930 (75.3%) | 3,299 (81.8%) |
| 55 to 64 Years | 2,376 (72.3%) | 2,717 (74.9%) |
| 65 to 74 Years | 1,953 (87.2%) | 1,978 (83.0%) |
| 75 Years and over | 685 (85.0%) | 1,735 (78.1%) |
| Total | 21,427 (74.6%) | 22,764 (72.1%) |
Income Below Poverty Among Married-Couple Families in Pontiac
The poverty statistics for married-couple families in Pontiac show that 12.8% or 674 of the total 5,260 families live below the poverty line. Families with 3 or 4 children have the highest poverty rate of 58.4%, comprising of 276 families. On the other hand, families with no children have the lowest poverty rate of 6.4%, which includes 177 families.
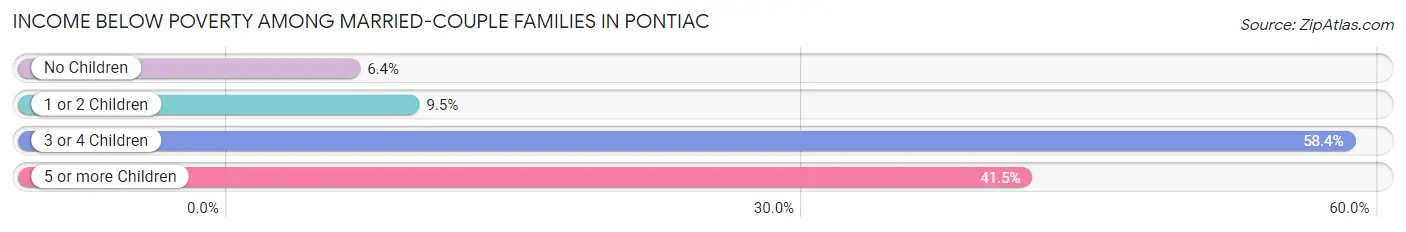
| Children | Above Poverty | Below Poverty |
| No Children | 2,596 (93.6%) | 177 (6.4%) |
| 1 or 2 Children | 1,738 (90.5%) | 182 (9.5%) |
| 3 or 4 Children | 197 (41.6%) | 276 (58.4%) |
| 5 or more Children | 55 (58.5%) | 39 (41.5%) |
| Total | 4,586 (87.2%) | 674 (12.8%) |
Income Below Poverty Among Single-Parent Households in Pontiac
According to the poverty data in Pontiac, 29.5% or 529 single-father households and 25.3% or 1,523 single-mother households are living below the poverty line. Among single-father households, those with 5 or more children have the highest poverty rate, with 9 households (100.0%) experiencing poverty. Likewise, among single-mother households, those with 5 or more children have the highest poverty rate, with 94 households (76.4%) falling below the poverty line.
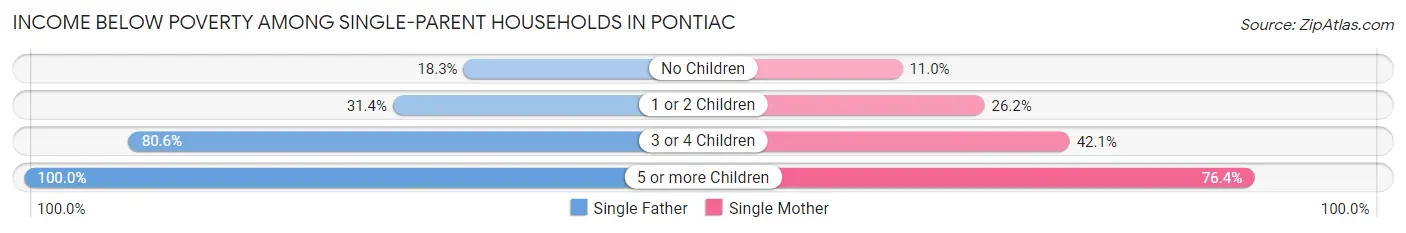
| Children | Single Father | Single Mother |
| No Children | 151 (18.3%) | 203 (11.0%) |
| 1 or 2 Children | 257 (31.4%) | 791 (26.2%) |
| 3 or 4 Children | 112 (80.6%) | 435 (42.1%) |
| 5 or more Children | 9 (100.0%) | 94 (76.4%) |
| Total | 529 (29.5%) | 1,523 (25.3%) |
Income Below Poverty Among Married-Couple vs Single-Parent Households in Pontiac
The poverty data for Pontiac shows that 674 of the married-couple family households (12.8%) and 2,052 of the single-parent households (26.3%) are living below the poverty level. Within the married-couple family households, those with 3 or 4 children have the highest poverty rate, with 276 households (58.4%) falling below the poverty line. Among the single-parent households, those with 5 or more children have the highest poverty rate, with 103 household (78.0%) living below poverty.
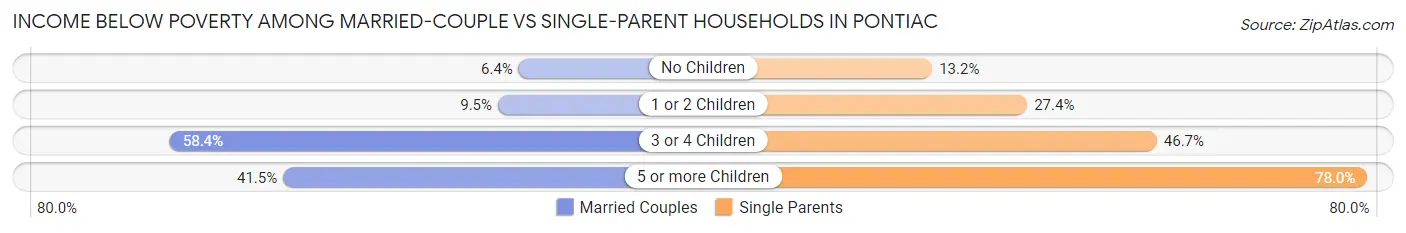
| Children | Married-Couple Families | Single-Parent Households |
| No Children | 177 (6.4%) | 354 (13.2%) |
| 1 or 2 Children | 182 (9.5%) | 1,048 (27.4%) |
| 3 or 4 Children | 276 (58.4%) | 547 (46.7%) |
| 5 or more Children | 39 (41.5%) | 103 (78.0%) |
| Total | 674 (12.8%) | 2,052 (26.3%) |
Race in Pontiac
The most populous races in Pontiac are Black / African American (30,389 | 49.0%), White / Caucasian (18,968 | 30.6%), and Hispanic or Latino (12,786 | 20.6%).
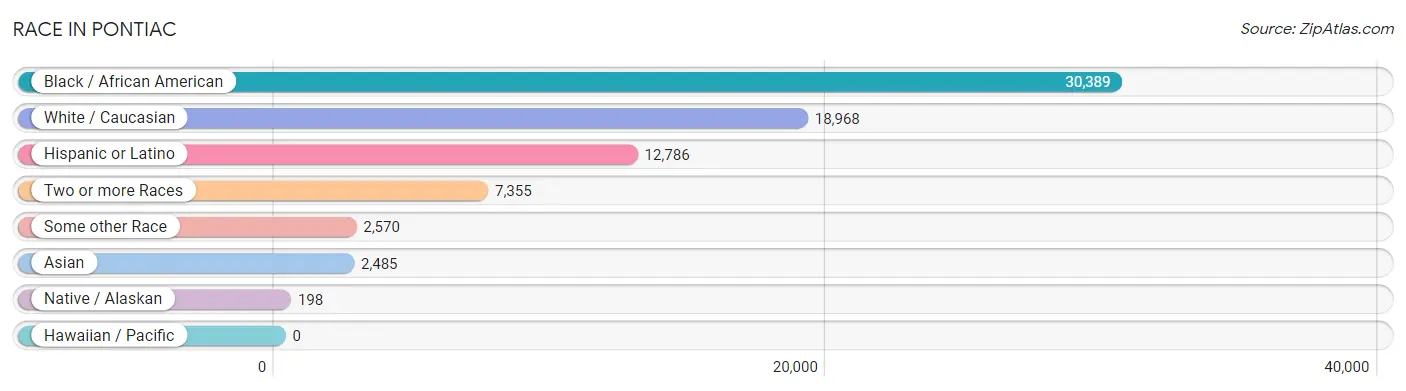
| Race | # Population | % Population |
| Asian | 2,485 | 4.0% |
| Black / African American | 30,389 | 49.0% |
| Hawaiian / Pacific | 0 | 0.0% |
| Hispanic or Latino | 12,786 | 20.6% |
| Native / Alaskan | 198 | 0.3% |
| White / Caucasian | 18,968 | 30.6% |
| Two or more Races | 7,355 | 11.9% |
| Some other Race | 2,570 | 4.2% |
| Total | 61,965 | 100.0% |
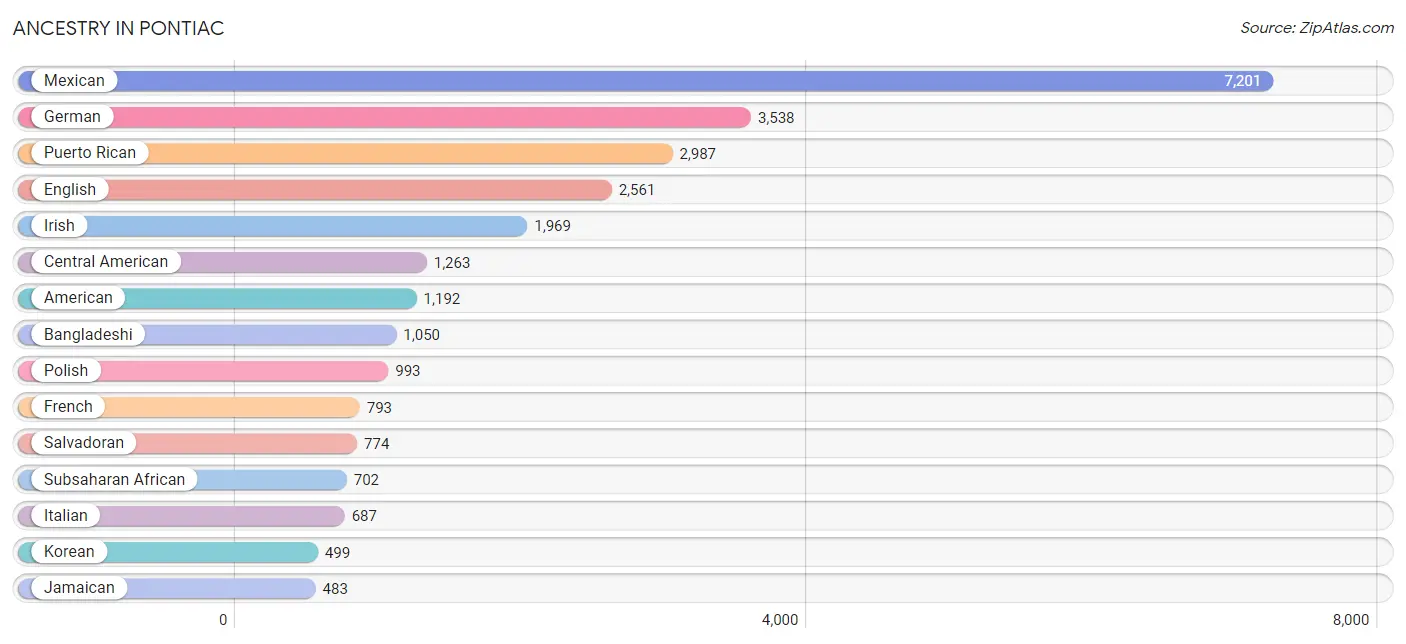
Ancestry in Pontiac
The most populous ancestries reported in Pontiac are Mexican (7,201 | 11.6%), German (3,538 | 5.7%), Puerto Rican (2,987 | 4.8%), English (2,561 | 4.1%), and Irish (1,969 | 3.2%), together accounting for 29.5% of all Pontiac residents.
| Ancestry | # Population | % Population |
| African | 336 | 0.5% |
| Alaska Native | 29 | 0.1% |
| Albanian | 12 | 0.0% |
| American | 1,192 | 1.9% |
| Apache | 115 | 0.2% |
| Arab | 316 | 0.5% |
| Armenian | 11 | 0.0% |
| Australian | 20 | 0.0% |
| Austrian | 20 | 0.0% |
| Bangladeshi | 1,050 | 1.7% |
| Belgian | 45 | 0.1% |
| Bhutanese | 11 | 0.0% |
| Blackfeet | 15 | 0.0% |
| Brazilian | 7 | 0.0% |
| British | 156 | 0.3% |
| Burmese | 42 | 0.1% |
| Canadian | 162 | 0.3% |
| Celtic | 17 | 0.0% |
| Central American | 1,263 | 2.0% |
| Central American Indian | 74 | 0.1% |
| Cherokee | 189 | 0.3% |
| Chippewa | 20 | 0.0% |
| Colombian | 161 | 0.3% |
| Croatian | 36 | 0.1% |
| Cuban | 157 | 0.3% |
| Czech | 123 | 0.2% |
| Czechoslovakian | 32 | 0.1% |
| Danish | 61 | 0.1% |
| Dominican | 18 | 0.0% |
| Dutch | 184 | 0.3% |
| Dutch West Indian | 9 | 0.0% |
| Eastern European | 17 | 0.0% |
| Egyptian | 50 | 0.1% |
| English | 2,561 | 4.1% |
| European | 253 | 0.4% |
| Finnish | 116 | 0.2% |
| French | 793 | 1.3% |
| French American Indian | 38 | 0.1% |
| French Canadian | 250 | 0.4% |
| German | 3,538 | 5.7% |
| German Russian | 11 | 0.0% |
| Greek | 46 | 0.1% |
| Guamanian / Chamorro | 137 | 0.2% |
| Honduran | 451 | 0.7% |
| Hungarian | 112 | 0.2% |
| Indian (Asian) | 253 | 0.4% |
| Iranian | 50 | 0.1% |
| Iraqi | 34 | 0.1% |
| Irish | 1,969 | 3.2% |
| Israeli | 7 | 0.0% |
| Italian | 687 | 1.1% |
| Jamaican | 483 | 0.8% |
| Jordanian | 17 | 0.0% |
| Kenyan | 7 | 0.0% |
| Korean | 499 | 0.8% |
| Lebanese | 100 | 0.2% |
| Liberian | 226 | 0.4% |
| Macedonian | 23 | 0.0% |
| Malaysian | 429 | 0.7% |
| Maltese | 7 | 0.0% |
| Mexican | 7,201 | 11.6% |
| Mexican American Indian | 45 | 0.1% |
| Moroccan | 119 | 0.2% |
| Nigerian | 285 | 0.5% |
| Northern European | 12 | 0.0% |
| Norwegian | 90 | 0.2% |
| Ottawa | 4 | 0.0% |
| Pakistani | 265 | 0.4% |
| Pennsylvania German | 21 | 0.0% |
| Polish | 993 | 1.6% |
| Portuguese | 51 | 0.1% |
| Potawatomi | 9 | 0.0% |
| Puerto Rican | 2,987 | 4.8% |
| Romanian | 64 | 0.1% |
| Russian | 124 | 0.2% |
| Salvadoran | 774 | 1.3% |
| Scandinavian | 34 | 0.1% |
| Scotch-Irish | 323 | 0.5% |
| Scottish | 431 | 0.7% |
| Serbian | 18 | 0.0% |
| Sioux | 76 | 0.1% |
| Slavic | 11 | 0.0% |
| Slovak | 67 | 0.1% |
| South American | 161 | 0.3% |
| South American Indian | 9 | 0.0% |
| Spaniard | 17 | 0.0% |
| Spanish | 220 | 0.4% |
| Spanish American | 14 | 0.0% |
| Sri Lankan | 106 | 0.2% |
| Subsaharan African | 702 | 1.1% |
| Swedish | 224 | 0.4% |
| Swiss | 24 | 0.0% |
| Thai | 269 | 0.4% |
| Trinidadian and Tobagonian | 29 | 0.1% |
| Ukrainian | 285 | 0.5% |
| Welsh | 32 | 0.1% |
| Yugoslavian | 21 | 0.0% | View All 97 Rows |
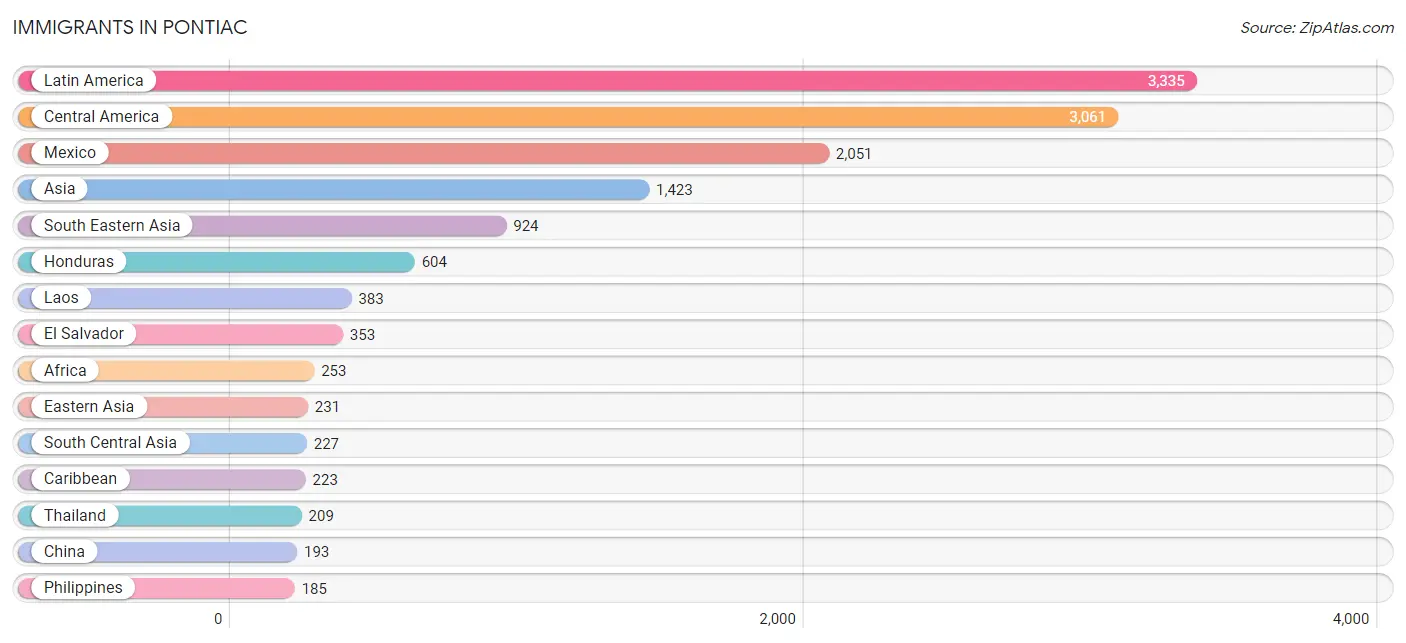
Immigrants in Pontiac
The most numerous immigrant groups reported in Pontiac came from Latin America (3,335 | 5.4%), Central America (3,061 | 4.9%), Mexico (2,051 | 3.3%), Asia (1,423 | 2.3%), and South Eastern Asia (924 | 1.5%), together accounting for 17.4% of all Pontiac residents.
| Immigration Origin | # Population | % Population |
| Africa | 253 | 0.4% |
| Albania | 3 | 0.0% |
| Asia | 1,423 | 2.3% |
| Australia | 20 | 0.0% |
| Brazil | 7 | 0.0% |
| Canada | 170 | 0.3% |
| Caribbean | 223 | 0.4% |
| Central America | 3,061 | 4.9% |
| China | 193 | 0.3% |
| Colombia | 44 | 0.1% |
| Cuba | 47 | 0.1% |
| Eastern Africa | 58 | 0.1% |
| Eastern Asia | 231 | 0.4% |
| Eastern Europe | 78 | 0.1% |
| Egypt | 16 | 0.0% |
| El Salvador | 353 | 0.6% |
| Europe | 119 | 0.2% |
| Germany | 32 | 0.1% |
| Guatemala | 53 | 0.1% |
| Honduras | 604 | 1.0% |
| India | 156 | 0.3% |
| Iran | 38 | 0.1% |
| Iraq | 34 | 0.1% |
| Israel | 7 | 0.0% |
| Jamaica | 154 | 0.3% |
| Japan | 11 | 0.0% |
| Kenya | 12 | 0.0% |
| Korea | 27 | 0.0% |
| Laos | 383 | 0.6% |
| Latin America | 3,335 | 5.4% |
| Liberia | 69 | 0.1% |
| Malaysia | 15 | 0.0% |
| Mexico | 2,051 | 3.3% |
| Nigeria | 110 | 0.2% |
| Northern Africa | 16 | 0.0% |
| Northern Europe | 9 | 0.0% |
| Oceania | 20 | 0.0% |
| Pakistan | 33 | 0.1% |
| Philippines | 185 | 0.3% |
| Poland | 12 | 0.0% |
| Romania | 18 | 0.0% |
| Russia | 4 | 0.0% |
| South America | 51 | 0.1% |
| South Central Asia | 227 | 0.4% |
| South Eastern Asia | 924 | 1.5% |
| Thailand | 209 | 0.3% |
| Trinidad and Tobago | 22 | 0.0% |
| Ukraine | 22 | 0.0% |
| Vietnam | 132 | 0.2% |
| Western Africa | 179 | 0.3% |
| Western Asia | 41 | 0.1% |
| Western Europe | 32 | 0.1% | View All 52 Rows |
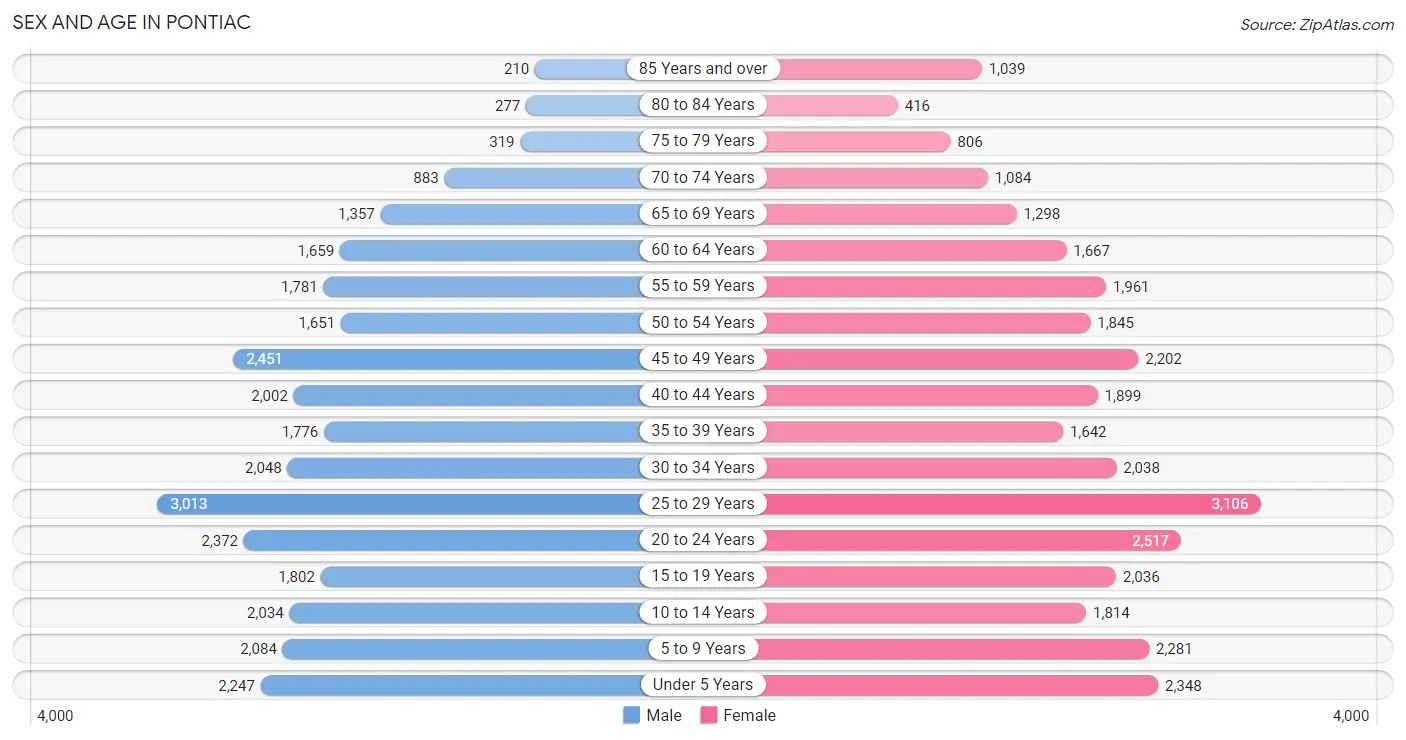
Sex and Age in Pontiac
Sex and Age in Pontiac
The most populous age groups in Pontiac are 25 to 29 Years (3,013 | 10.1%) for men and 25 to 29 Years (3,106 | 9.7%) for women.
| Age Bracket | Male | Female |
| Under 5 Years | 2,247 (7.5%) | 2,348 (7.3%) |
| 5 to 9 Years | 2,084 (7.0%) | 2,281 (7.1%) |
| 10 to 14 Years | 2,034 (6.8%) | 1,814 (5.7%) |
| 15 to 19 Years | 1,802 (6.0%) | 2,036 (6.4%) |
| 20 to 24 Years | 2,372 (7.9%) | 2,517 (7.9%) |
| 25 to 29 Years | 3,013 (10.1%) | 3,106 (9.7%) |
| 30 to 34 Years | 2,048 (6.8%) | 2,038 (6.4%) |
| 35 to 39 Years | 1,776 (5.9%) | 1,642 (5.1%) |
| 40 to 44 Years | 2,002 (6.7%) | 1,899 (5.9%) |
| 45 to 49 Years | 2,451 (8.2%) | 2,202 (6.9%) |
| 50 to 54 Years | 1,651 (5.5%) | 1,845 (5.8%) |
| 55 to 59 Years | 1,781 (5.9%) | 1,961 (6.1%) |
| 60 to 64 Years | 1,659 (5.5%) | 1,667 (5.2%) |
| 65 to 69 Years | 1,357 (4.5%) | 1,298 (4.1%) |
| 70 to 74 Years | 883 (2.9%) | 1,084 (3.4%) |
| 75 to 79 Years | 319 (1.1%) | 806 (2.5%) |
| 80 to 84 Years | 277 (0.9%) | 416 (1.3%) |
| 85 Years and over | 210 (0.7%) | 1,039 (3.3%) |
| Total | 29,966 (100.0%) | 31,999 (100.0%) |
Families and Households in Pontiac
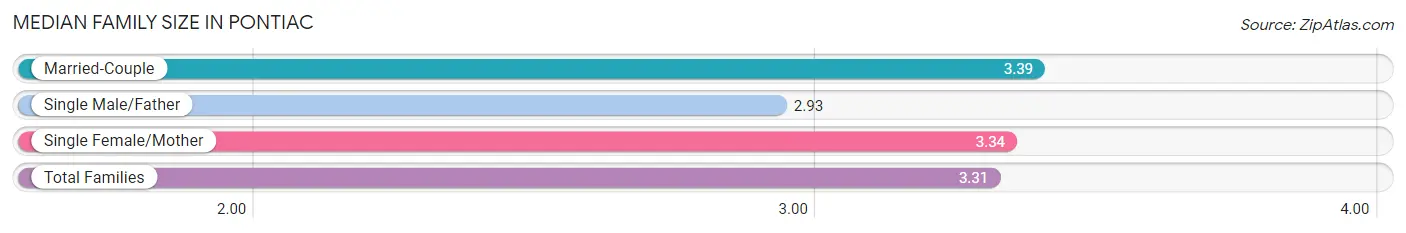
Median Family Size in Pontiac
The median family size in Pontiac is 3.31 persons per family, with married-couple families (5,260 | 40.2%) accounting for the largest median family size of 3.39 persons per family. On the other hand, single male/father families (1,793 | 13.7%) represent the smallest median family size with 2.93 persons per family.
| Family Type | # Families | Family Size |
| Married-Couple | 5,260 (40.2%) | 3.39 |
| Single Male/Father | 1,793 (13.7%) | 2.93 |
| Single Female/Mother | 6,024 (46.1%) | 3.34 |
| Total Families | 13,077 (100.0%) | 3.31 |
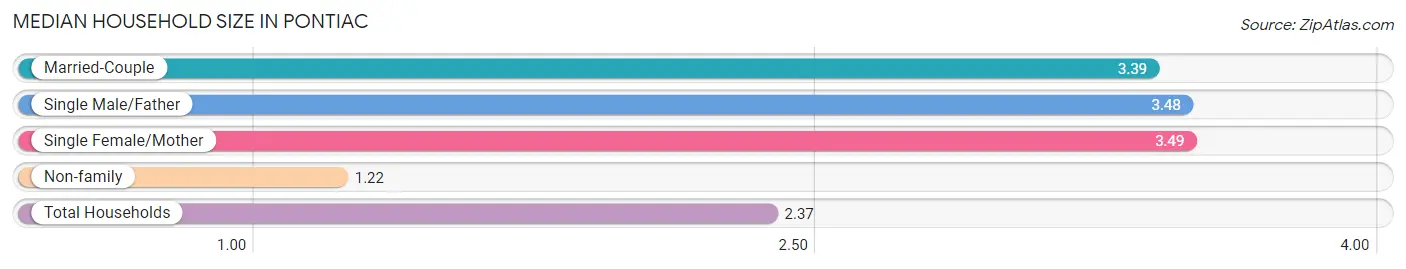
Median Household Size in Pontiac
The median household size in Pontiac is 2.37 persons per household, with single female/mother households (6,024 | 23.8%) accounting for the largest median household size of 3.49 persons per household. non-family households (12,266 | 48.4%) represent the smallest median household size with 1.22 persons per household.
| Household Type | # Households | Household Size |
| Married-Couple | 5,260 (20.8%) | 3.39 |
| Single Male/Father | 1,793 (7.1%) | 3.48 |
| Single Female/Mother | 6,024 (23.8%) | 3.49 |
| Non-family | 12,266 (48.4%) | 1.22 |
| Total Households | 25,343 (100.0%) | 2.37 |
Household Size by Marriage Status in Pontiac
Out of a total of 25,343 households in Pontiac, 13,077 (51.6%) are family households, while 12,266 (48.4%) are nonfamily households. The most numerous type of family households are 2-person households, comprising 5,143, and the most common type of nonfamily households are 1-person households, comprising 10,355.
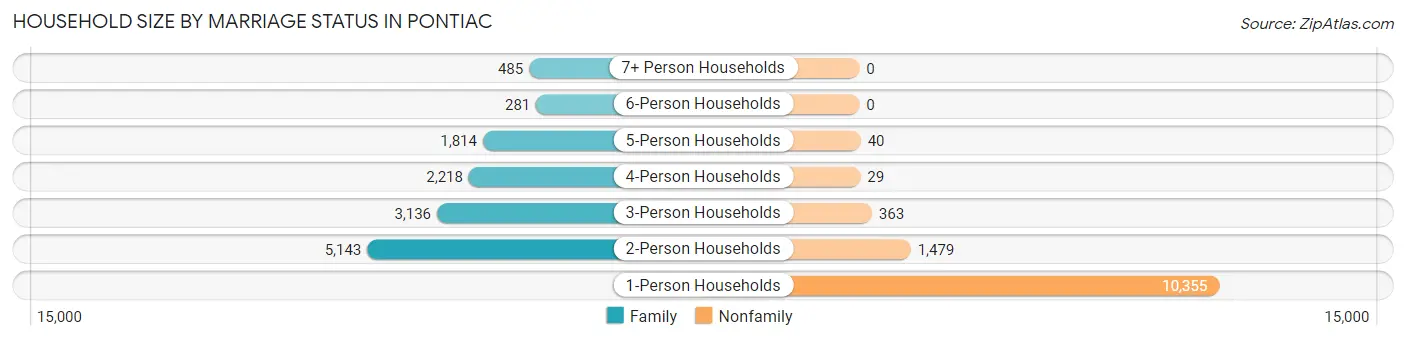
| Household Size | Family Households | Nonfamily Households |
| 1-Person Households | - | 10,355 (40.9%) |
| 2-Person Households | 5,143 (20.3%) | 1,479 (5.8%) |
| 3-Person Households | 3,136 (12.4%) | 363 (1.4%) |
| 4-Person Households | 2,218 (8.7%) | 29 (0.1%) |
| 5-Person Households | 1,814 (7.2%) | 40 (0.2%) |
| 6-Person Households | 281 (1.1%) | 0 (0.0%) |
| 7+ Person Households | 485 (1.9%) | 0 (0.0%) |
| Total | 13,077 (51.6%) | 12,266 (48.4%) |
Female Fertility in Pontiac
Fertility by Age in Pontiac
Average fertility rate in Pontiac is 58.0 births per 1,000 women. Women in the age bracket of 20 to 34 years have the highest fertility rate with 72.0 births per 1,000 women. Women in the age bracket of 20 to 34 years acount for 60.1% of all women with births.
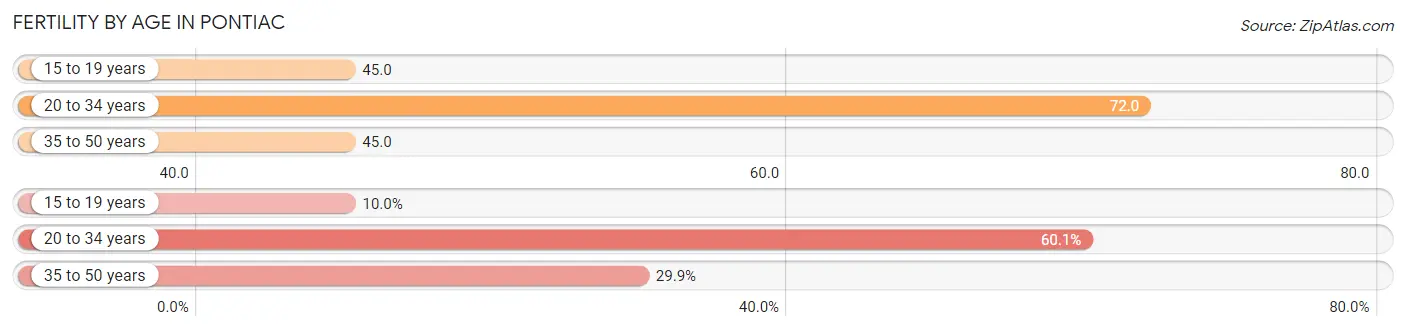
| Age Bracket | Women with Births | Births / 1,000 Women |
| 15 to 19 years | 92 (10.0%) | 45.0 |
| 20 to 34 years | 552 (60.1%) | 72.0 |
| 35 to 50 years | 275 (29.9%) | 45.0 |
| Total | 919 (100.0%) | 58.0 |
Fertility by Age by Marriage Status in Pontiac
21.2% of women with births (919) in Pontiac are married. The highest percentage of unmarried women with births falls into 15 to 19 years age bracket with 100.0% of them unmarried at the time of birth, while the lowest percentage of unmarried women with births belong to 35 to 50 years age bracket with 61.5% of them unmarried.
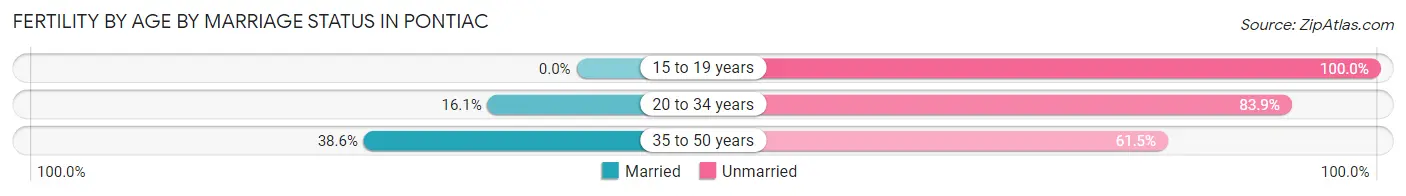
| Age Bracket | Married | Unmarried |
| 15 to 19 years | 0 (0.0%) | 92 (100.0%) |
| 20 to 34 years | 89 (16.1%) | 463 (83.9%) |
| 35 to 50 years | 106 (38.6%) | 169 (61.5%) |
| Total | 195 (21.2%) | 724 (78.8%) |
Fertility by Education in Pontiac
Average fertility rate in Pontiac is 58.0 births per 1,000 women. Women with the education attainment of graduate degree have the highest fertility rate of 92.0 births per 1,000 women, while women with the education attainment of high school diploma have the lowest fertility at 40.0 births per 1,000 women. Women with the education attainment of college or associate's degree represent 31.9% of all women with births.
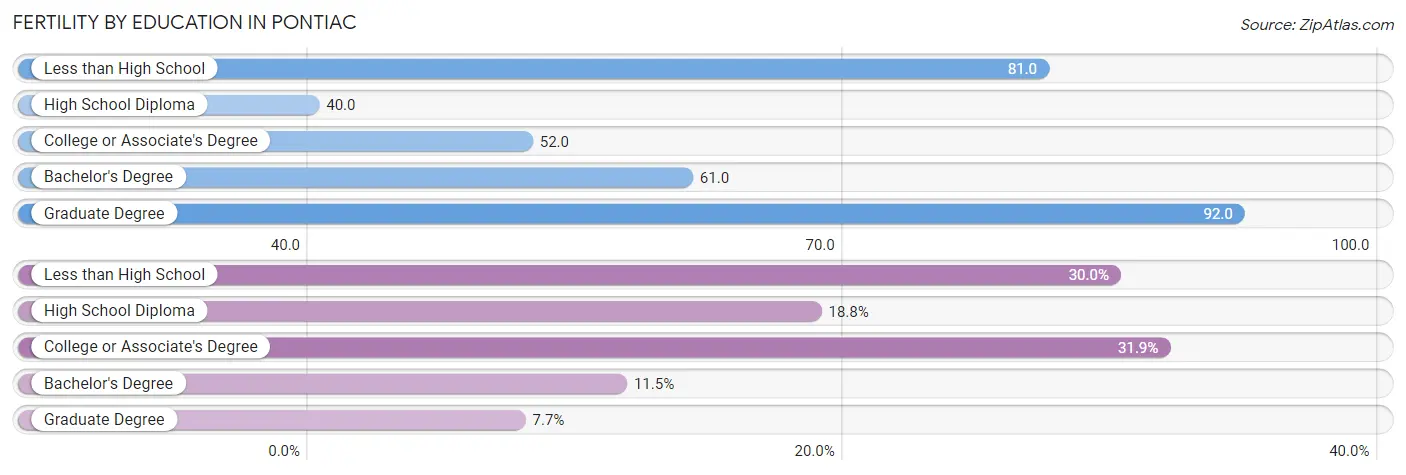
| Educational Attainment | Women with Births | Births / 1,000 Women |
| Less than High School | 276 (30.0%) | 81.0 |
| High School Diploma | 173 (18.8%) | 40.0 |
| College or Associate's Degree | 293 (31.9%) | 52.0 |
| Bachelor's Degree | 106 (11.5%) | 61.0 |
| Graduate Degree | 71 (7.7%) | 92.0 |
| Total | 919 (100.0%) | 58.0 |
Fertility by Education by Marriage Status in Pontiac
78.8% of women with births in Pontiac are unmarried. Women with the educational attainment of graduate degree are most likely to be married with 71.8% of them married at childbirth, while women with the educational attainment of college or associate's degree are least likely to be married with 97.6% of them unmarried at childbirth.
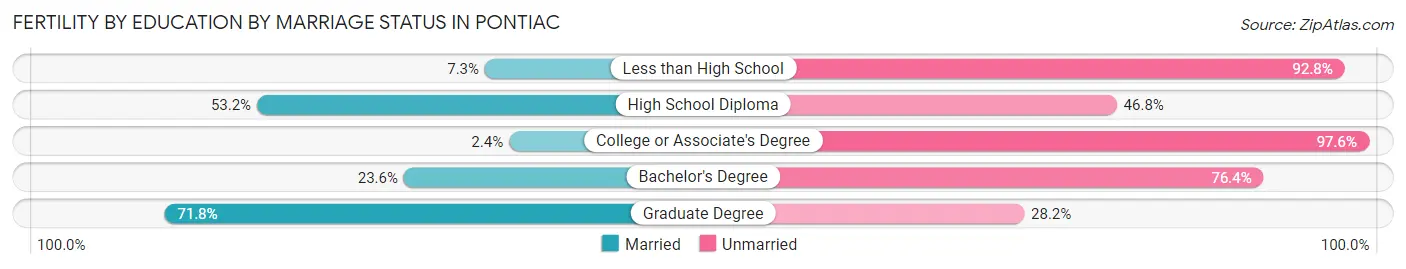
| Educational Attainment | Married | Unmarried |
| Less than High School | 20 (7.2%) | 256 (92.7%) |
| High School Diploma | 92 (53.2%) | 81 (46.8%) |
| College or Associate's Degree | 7 (2.4%) | 286 (97.6%) |
| Bachelor's Degree | 25 (23.6%) | 81 (76.4%) |
| Graduate Degree | 51 (71.8%) | 20 (28.2%) |
| Total | 195 (21.2%) | 724 (78.8%) |
Employment Characteristics in Pontiac
Employment by Class of Employer in Pontiac
Among the 24,638 employed individuals in Pontiac, private company employees (19,125 | 77.6%), not-for-profit organizations (1,862 | 7.6%), and self-employed (not incorporated) (1,265 | 5.1%) make up the most common classes of employment.
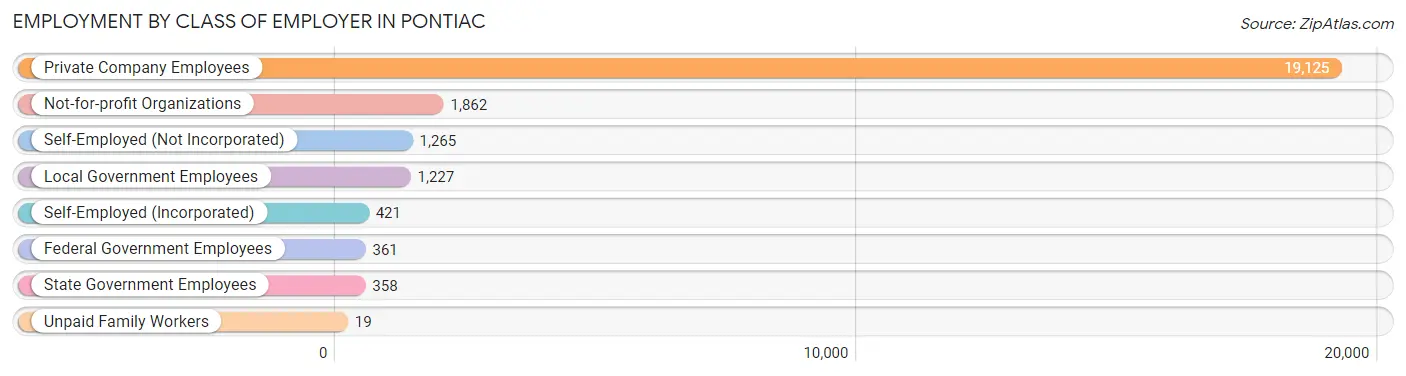
| Employer Class | # Employees | % Employees |
| Private Company Employees | 19,125 | 77.6% |
| Self-Employed (Incorporated) | 421 | 1.7% |
| Self-Employed (Not Incorporated) | 1,265 | 5.1% |
| Not-for-profit Organizations | 1,862 | 7.6% |
| Local Government Employees | 1,227 | 5.0% |
| State Government Employees | 358 | 1.5% |
| Federal Government Employees | 361 | 1.5% |
| Unpaid Family Workers | 19 | 0.1% |
| Total | 24,638 | 100.0% |
Employment Status by Age in Pontiac
According to the labor force statistics for Pontiac, out of the total population over 16 years of age (48,438), 59.7% or 28,917 individuals are in the labor force, with 9.5% or 2,747 of them unemployed. The age group with the highest labor force participation rate is 20 to 24 years, with 81.1% or 3,965 individuals in the labor force. Within the labor force, the 16 to 19 years age range has the highest percentage of unemployed individuals, with 18.9% or 217 of them being unemployed.
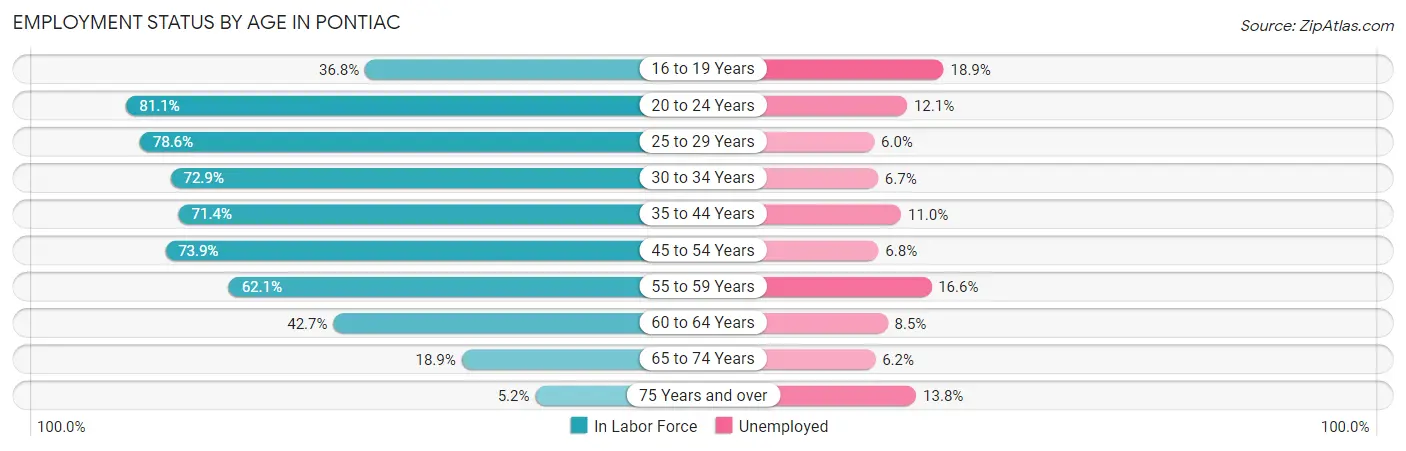
| Age Bracket | In Labor Force | Unemployed |
| 16 to 19 Years | 1,148 (36.8%) | 217 (18.9%) |
| 20 to 24 Years | 3,965 (81.1%) | 480 (12.1%) |
| 25 to 29 Years | 4,810 (78.6%) | 289 (6.0%) |
| 30 to 34 Years | 2,979 (72.9%) | 200 (6.7%) |
| 35 to 44 Years | 5,226 (71.4%) | 575 (11.0%) |
| 45 to 54 Years | 6,022 (73.9%) | 409 (6.8%) |
| 55 to 59 Years | 2,324 (62.1%) | 386 (16.6%) |
| 60 to 64 Years | 1,420 (42.7%) | 121 (8.5%) |
| 65 to 74 Years | 874 (18.9%) | 54 (6.2%) |
| 75 Years and over | 159 (5.2%) | 22 (13.8%) |
| Total | 28,917 (59.7%) | 2,747 (9.5%) |
Employment Status by Educational Attainment in Pontiac
According to labor force statistics for Pontiac, 69.6% of individuals (22,788) out of the total population between 25 and 64 years of age (32,741) are in the labor force, with 8.7% or 1,983 of them being unemployed. The group with the highest labor force participation rate are those with the educational attainment of bachelor's degree or higher, with 81.7% or 4,289 individuals in the labor force. Within the labor force, individuals with less than high school education have the highest percentage of unemployment, with 13.0% or 381 of them being unemployed.
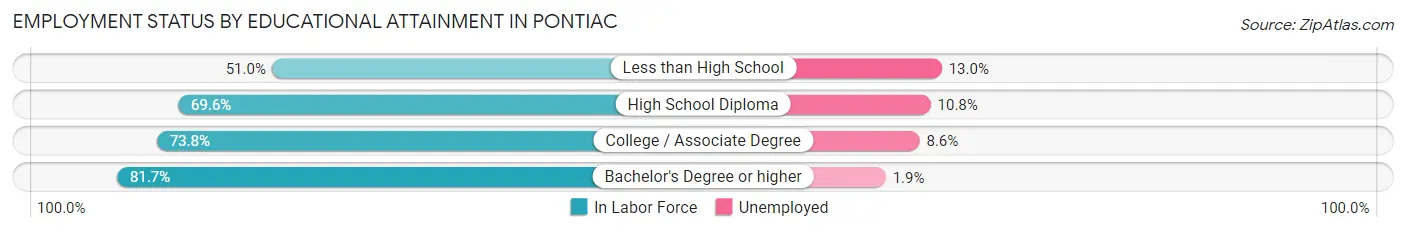
| Educational Attainment | In Labor Force | Unemployed |
| Less than High School | 2,927 (51.0%) | 746 (13.0%) |
| High School Diploma | 8,133 (69.6%) | 1,262 (10.8%) |
| College / Associate Degree | 7,429 (73.8%) | 866 (8.6%) |
| Bachelor's Degree or higher | 4,289 (81.7%) | 100 (1.9%) |
| Total | 22,788 (69.6%) | 2,848 (8.7%) |
Employment Occupations by Sex in Pontiac
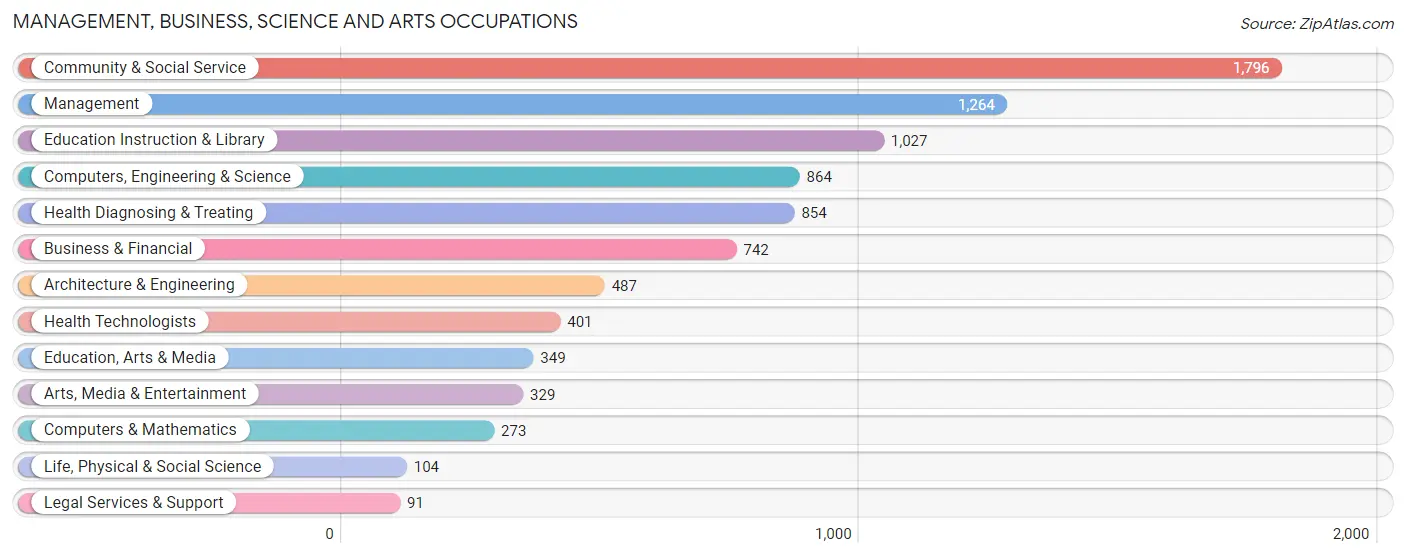
Management, Business, Science and Arts Occupations
The most common Management, Business, Science and Arts occupations in Pontiac are Community & Social Service (1,796 | 6.9%), Management (1,264 | 4.8%), Education Instruction & Library (1,027 | 3.9%), Computers, Engineering & Science (864 | 3.3%), and Health Diagnosing & Treating (854 | 3.3%).
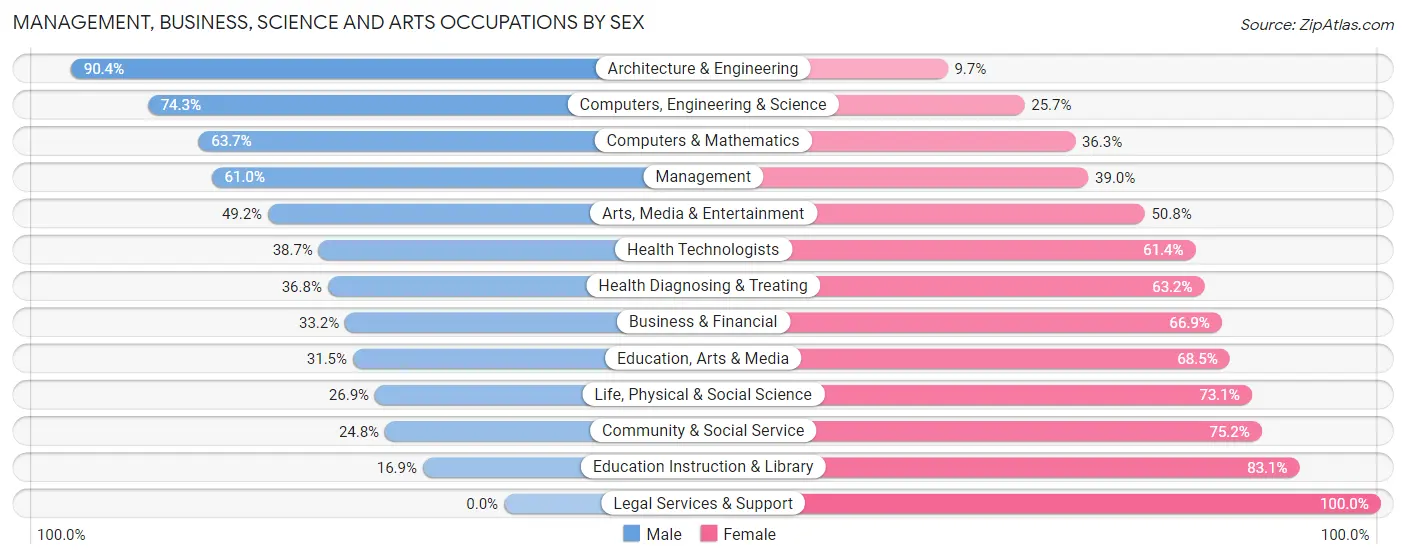
Management, Business, Science and Arts Occupations by Sex
Within the Management, Business, Science and Arts occupations in Pontiac, the most male-oriented occupations are Architecture & Engineering (90.3%), Computers, Engineering & Science (74.3%), and Computers & Mathematics (63.7%), while the most female-oriented occupations are Legal Services & Support (100.0%), Education Instruction & Library (83.1%), and Community & Social Service (75.2%).
| Occupation | Male | Female |
| Management | 771 (61.0%) | 493 (39.0%) |
| Business & Financial | 246 (33.2%) | 496 (66.8%) |
| Computers, Engineering & Science | 642 (74.3%) | 222 (25.7%) |
| Computers & Mathematics | 174 (63.7%) | 99 (36.3%) |
| Architecture & Engineering | 440 (90.3%) | 47 (9.7%) |
| Life, Physical & Social Science | 28 (26.9%) | 76 (73.1%) |
| Community & Social Service | 446 (24.8%) | 1,350 (75.2%) |
| Education, Arts & Media | 110 (31.5%) | 239 (68.5%) |
| Legal Services & Support | 0 (0.0%) | 91 (100.0%) |
| Education Instruction & Library | 174 (16.9%) | 853 (83.1%) |
| Arts, Media & Entertainment | 162 (49.2%) | 167 (50.8%) |
| Health Diagnosing & Treating | 314 (36.8%) | 540 (63.2%) |
| Health Technologists | 155 (38.7%) | 246 (61.4%) |
| Total (Category) | 2,419 (43.8%) | 3,101 (56.2%) |
| Total (Overall) | 12,712 (48.6%) | 13,466 (51.4%) |
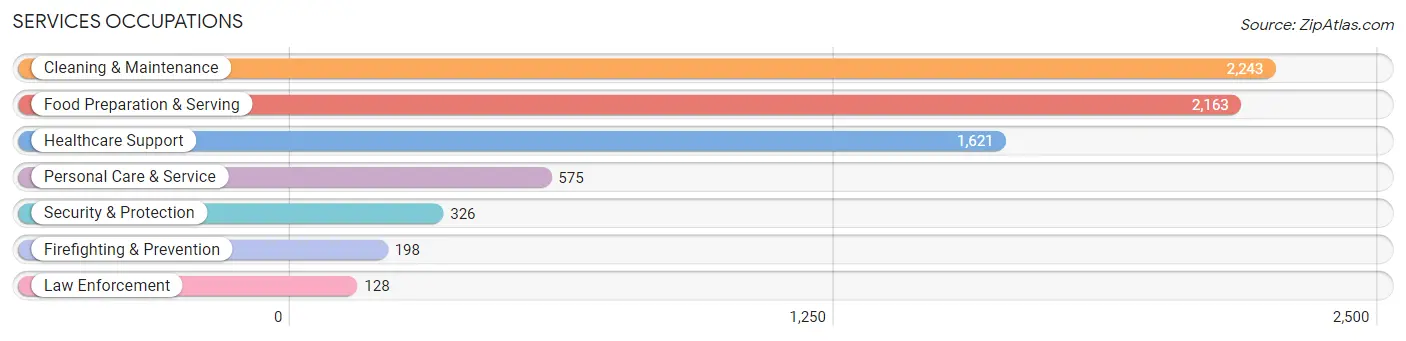
Services Occupations
The most common Services occupations in Pontiac are Cleaning & Maintenance (2,243 | 8.6%), Food Preparation & Serving (2,163 | 8.3%), Healthcare Support (1,621 | 6.2%), Personal Care & Service (575 | 2.2%), and Security & Protection (326 | 1.3%).
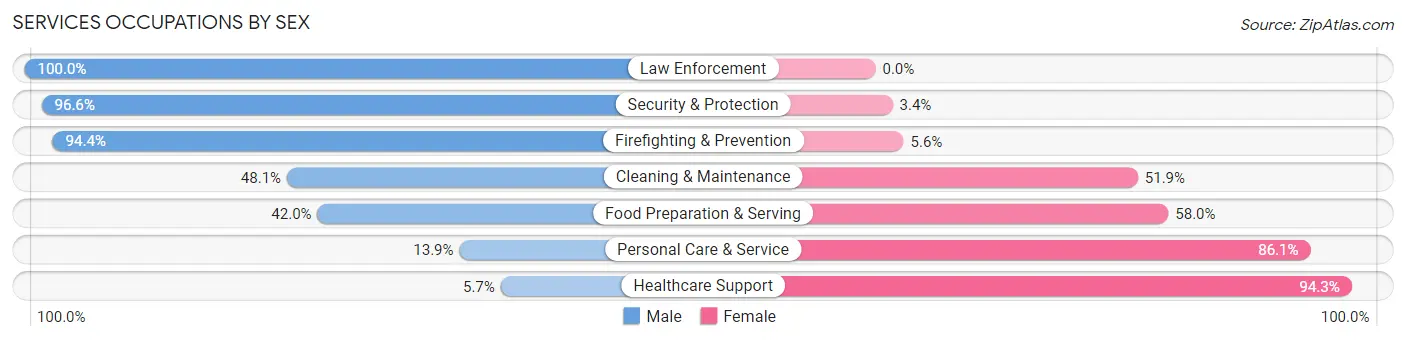
Services Occupations by Sex
Within the Services occupations in Pontiac, the most male-oriented occupations are Law Enforcement (100.0%), Security & Protection (96.6%), and Firefighting & Prevention (94.4%), while the most female-oriented occupations are Healthcare Support (94.3%), Personal Care & Service (86.1%), and Food Preparation & Serving (58.0%).
| Occupation | Male | Female |
| Healthcare Support | 93 (5.7%) | 1,528 (94.3%) |
| Security & Protection | 315 (96.6%) | 11 (3.4%) |
| Firefighting & Prevention | 187 (94.4%) | 11 (5.6%) |
| Law Enforcement | 128 (100.0%) | 0 (0.0%) |
| Food Preparation & Serving | 909 (42.0%) | 1,254 (58.0%) |
| Cleaning & Maintenance | 1,078 (48.1%) | 1,165 (51.9%) |
| Personal Care & Service | 80 (13.9%) | 495 (86.1%) |
| Total (Category) | 2,475 (35.7%) | 4,453 (64.3%) |
| Total (Overall) | 12,712 (48.6%) | 13,466 (51.4%) |
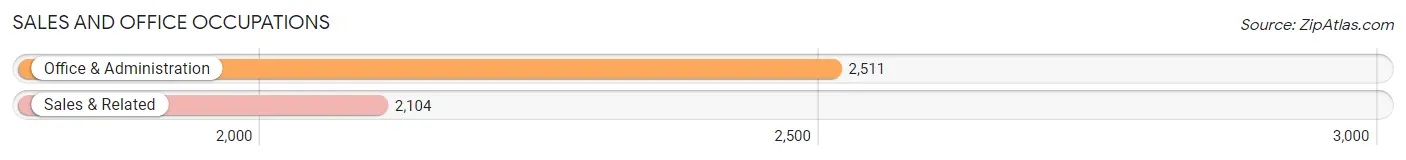
Sales and Office Occupations
The most common Sales and Office occupations in Pontiac are Office & Administration (2,511 | 9.6%), and Sales & Related (2,104 | 8.0%).
Sales and Office Occupations by Sex
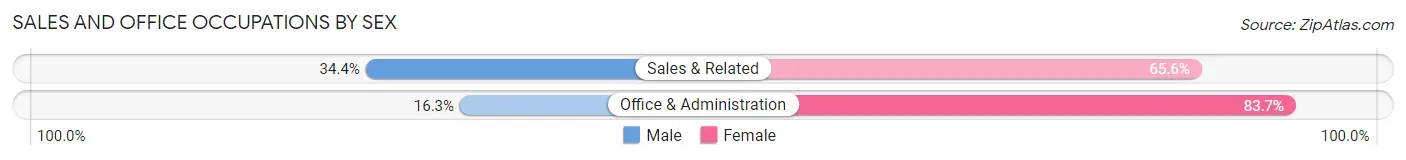
| Occupation | Male | Female |
| Sales & Related | 724 (34.4%) | 1,380 (65.6%) |
| Office & Administration | 409 (16.3%) | 2,102 (83.7%) |
| Total (Category) | 1,133 (24.5%) | 3,482 (75.4%) |
| Total (Overall) | 12,712 (48.6%) | 13,466 (51.4%) |
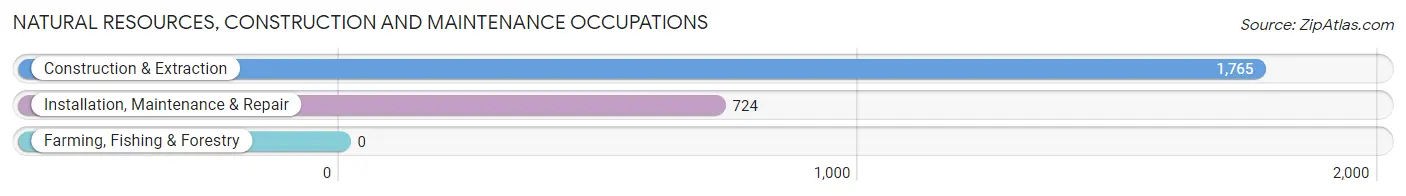
Natural Resources, Construction and Maintenance Occupations
The most common Natural Resources, Construction and Maintenance occupations in Pontiac are Construction & Extraction (1,765 | 6.7%), and Installation, Maintenance & Repair (724 | 2.8%).
Natural Resources, Construction and Maintenance Occupations by Sex
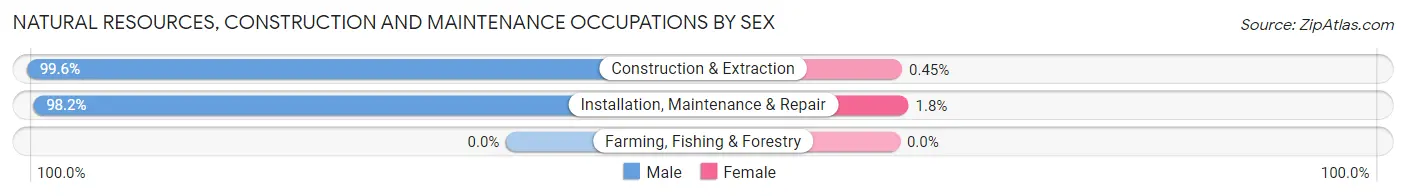
| Occupation | Male | Female |
| Farming, Fishing & Forestry | 0 (0.0%) | 0 (0.0%) |
| Construction & Extraction | 1,757 (99.6%) | 8 (0.4%) |
| Installation, Maintenance & Repair | 711 (98.2%) | 13 (1.8%) |
| Total (Category) | 2,468 (99.2%) | 21 (0.8%) |
| Total (Overall) | 12,712 (48.6%) | 13,466 (51.4%) |
Production, Transportation and Moving Occupations
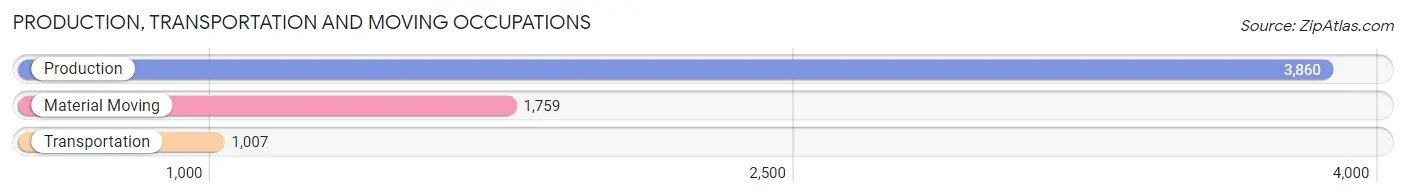
The most common Production, Transportation and Moving occupations in Pontiac are Production (3,860 | 14.7%), Material Moving (1,759 | 6.7%), and Transportation (1,007 | 3.8%).
Production, Transportation and Moving Occupations by Sex
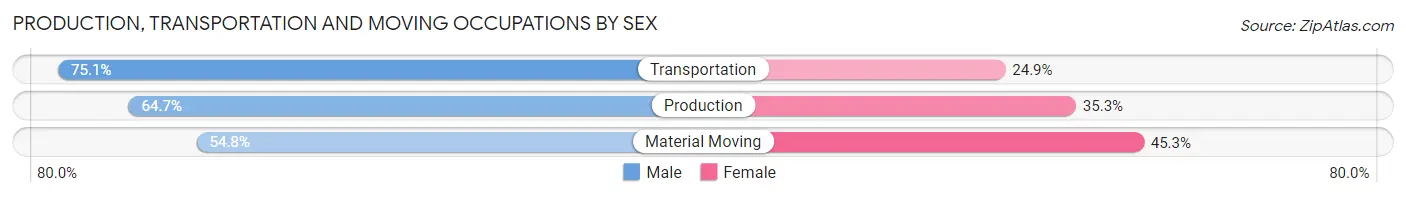
| Occupation | Male | Female |
| Production | 2,498 (64.7%) | 1,362 (35.3%) |
| Transportation | 756 (75.1%) | 251 (24.9%) |
| Material Moving | 963 (54.7%) | 796 (45.3%) |
| Total (Category) | 4,217 (63.6%) | 2,409 (36.4%) |
| Total (Overall) | 12,712 (48.6%) | 13,466 (51.4%) |
Employment Industries by Sex in Pontiac
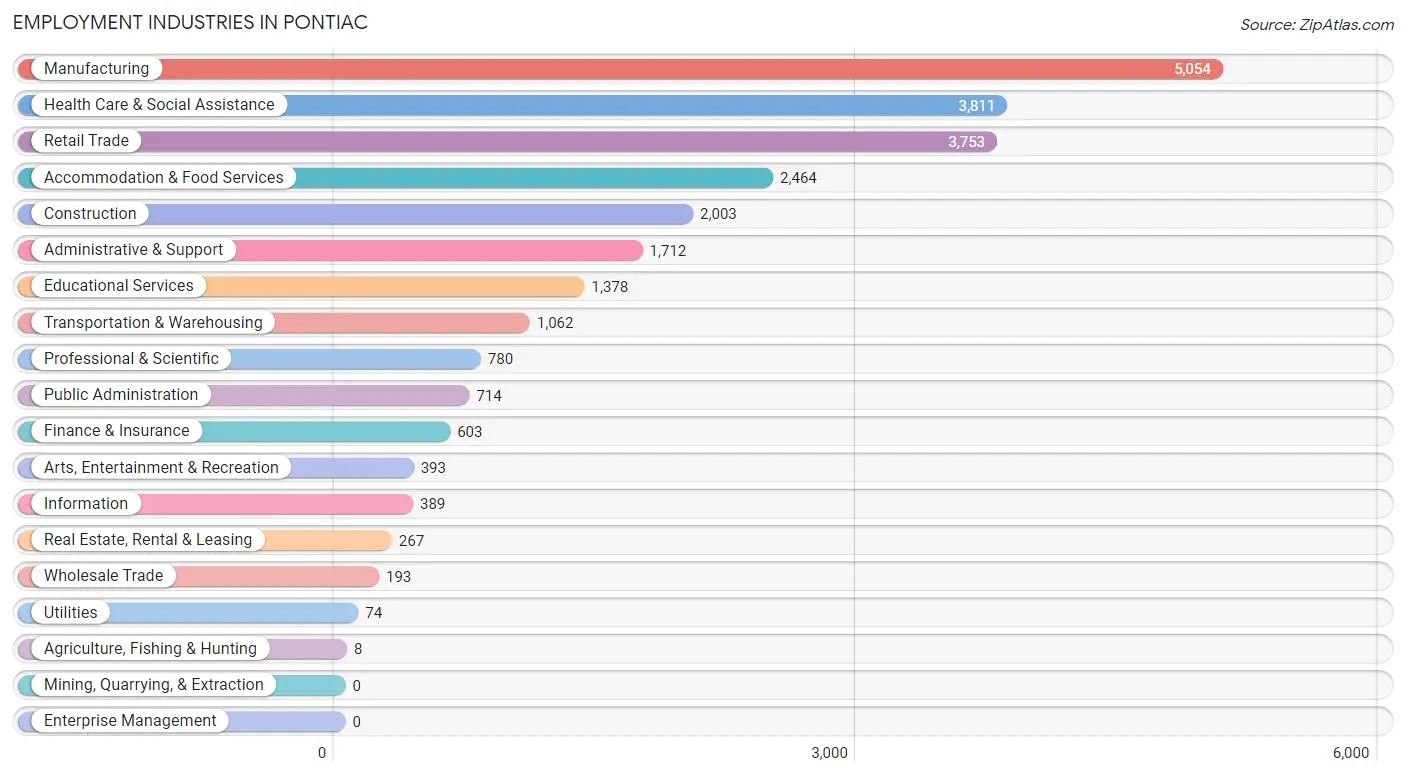
Employment Industries in Pontiac
The major employment industries in Pontiac include Manufacturing (5,054 | 19.3%), Health Care & Social Assistance (3,811 | 14.6%), Retail Trade (3,753 | 14.3%), Accommodation & Food Services (2,464 | 9.4%), and Construction (2,003 | 7.6%).
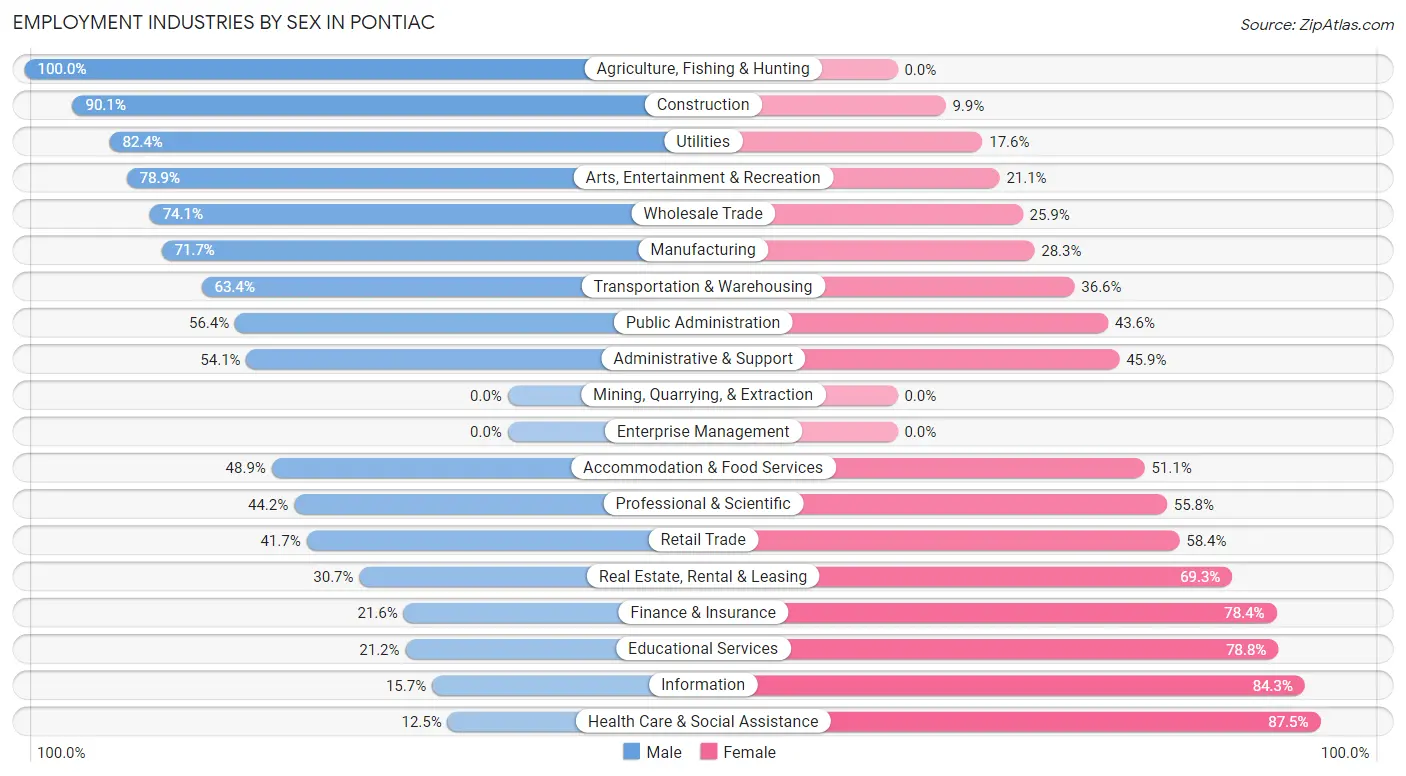
Employment Industries by Sex in Pontiac
The Pontiac industries that see more men than women are Agriculture, Fishing & Hunting (100.0%), Construction (90.1%), and Utilities (82.4%), whereas the industries that tend to have a higher number of women are Health Care & Social Assistance (87.5%), Information (84.3%), and Educational Services (78.8%).
| Industry | Male | Female |
| Agriculture, Fishing & Hunting | 8 (100.0%) | 0 (0.0%) |
| Mining, Quarrying, & Extraction | 0 (0.0%) | 0 (0.0%) |
| Construction | 1,804 (90.1%) | 199 (9.9%) |
| Manufacturing | 3,622 (71.7%) | 1,432 (28.3%) |
| Wholesale Trade | 143 (74.1%) | 50 (25.9%) |
| Retail Trade | 1,563 (41.6%) | 2,190 (58.4%) |
| Transportation & Warehousing | 673 (63.4%) | 389 (36.6%) |
| Utilities | 61 (82.4%) | 13 (17.6%) |
| Information | 61 (15.7%) | 328 (84.3%) |
| Finance & Insurance | 130 (21.6%) | 473 (78.4%) |
| Real Estate, Rental & Leasing | 82 (30.7%) | 185 (69.3%) |
| Professional & Scientific | 345 (44.2%) | 435 (55.8%) |
| Enterprise Management | 0 (0.0%) | 0 (0.0%) |
| Administrative & Support | 926 (54.1%) | 786 (45.9%) |
| Educational Services | 292 (21.2%) | 1,086 (78.8%) |
| Health Care & Social Assistance | 475 (12.5%) | 3,336 (87.5%) |
| Arts, Entertainment & Recreation | 310 (78.9%) | 83 (21.1%) |
| Accommodation & Food Services | 1,204 (48.9%) | 1,260 (51.1%) |
| Public Administration | 403 (56.4%) | 311 (43.6%) |
| Total | 12,712 (48.6%) | 13,466 (51.4%) |
Education in Pontiac
School Enrollment in Pontiac
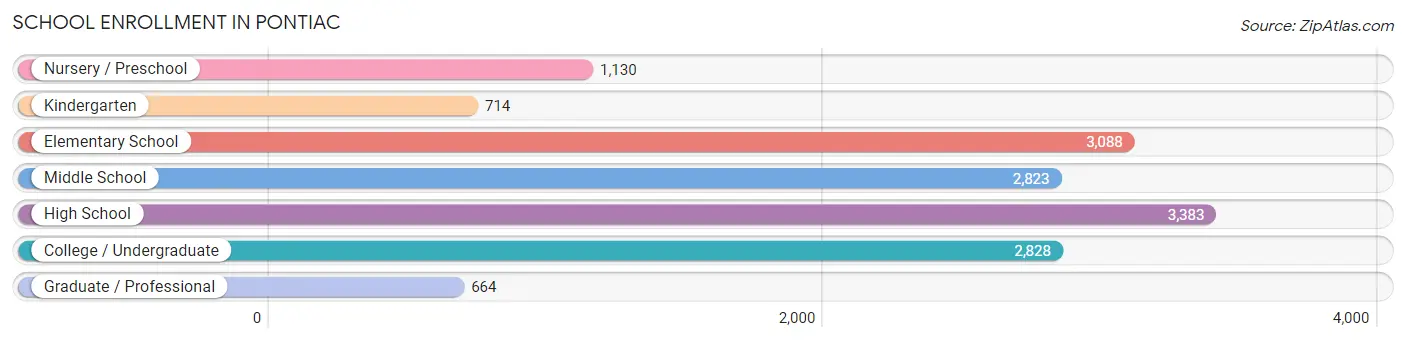
The most common levels of schooling among the 14,630 students in Pontiac are high school (3,383 | 23.1%), elementary school (3,088 | 21.1%), and college / undergraduate (2,828 | 19.3%).
| School Level | # Students | % Students |
| Nursery / Preschool | 1,130 | 7.7% |
| Kindergarten | 714 | 4.9% |
| Elementary School | 3,088 | 21.1% |
| Middle School | 2,823 | 19.3% |
| High School | 3,383 | 23.1% |
| College / Undergraduate | 2,828 | 19.3% |
| Graduate / Professional | 664 | 4.5% |
| Total | 14,630 | 100.0% |
School Enrollment by Age by Funding Source in Pontiac
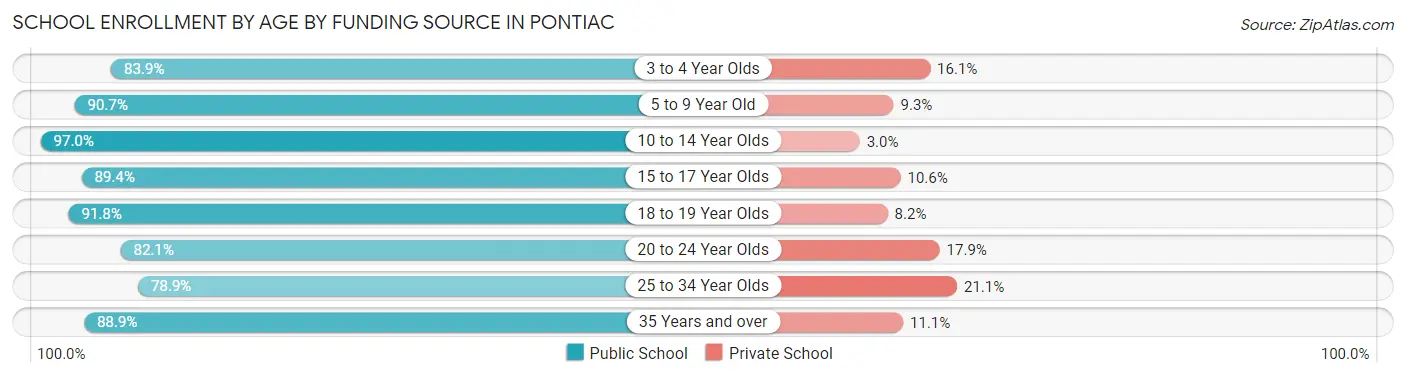
Out of a total of 14,630 students who are enrolled in schools in Pontiac, 1,434 (9.8%) attend a private institution, while the remaining 13,196 (90.2%) are enrolled in public schools. The age group of 25 to 34 year olds has the highest likelihood of being enrolled in private schools, with 162 (21.1% in the age bracket) enrolled. Conversely, the age group of 10 to 14 year olds has the lowest likelihood of being enrolled in a private school, with 3,597 (97.0% in the age bracket) attending a public institution.
| Age Bracket | Public School | Private School |
| 3 to 4 Year Olds | 531 (83.9%) | 102 (16.1%) |
| 5 to 9 Year Old | 3,734 (90.7%) | 383 (9.3%) |
| 10 to 14 Year Olds | 3,597 (97.0%) | 111 (3.0%) |
| 15 to 17 Year Olds | 1,990 (89.4%) | 236 (10.6%) |
| 18 to 19 Year Olds | 661 (91.8%) | 59 (8.2%) |
| 20 to 24 Year Olds | 1,396 (82.1%) | 304 (17.9%) |
| 25 to 34 Year Olds | 605 (78.9%) | 162 (21.1%) |
| 35 Years and over | 675 (88.9%) | 84 (11.1%) |
| Total | 13,196 (90.2%) | 1,434 (9.8%) |
Educational Attainment by Field of Study in Pontiac
Business (1,483 | 21.4%), engineering (870 | 12.5%), arts & humanities (763 | 11.0%), science & technology (730 | 10.5%), and visual & performing arts (457 | 6.6%) are the most common fields of study among 6,943 individuals in Pontiac who have obtained a bachelor's degree or higher.

| Field of Study | # Graduates | % Graduates |
| Computers & Mathematics | 233 | 3.4% |
| Bio, Nature & Agricultural | 222 | 3.2% |
| Physical & Health Sciences | 110 | 1.6% |
| Psychology | 425 | 6.1% |
| Social Sciences | 331 | 4.8% |
| Engineering | 870 | 12.5% |
| Multidisciplinary Studies | 31 | 0.4% |
| Science & Technology | 730 | 10.5% |
| Business | 1,483 | 21.4% |
| Education | 449 | 6.5% |
| Literature & Languages | 179 | 2.6% |
| Liberal Arts & History | 392 | 5.7% |
| Visual & Performing Arts | 457 | 6.6% |
| Communications | 268 | 3.9% |
| Arts & Humanities | 763 | 11.0% |
| Total | 6,943 | 100.0% |
Transportation & Commute in Pontiac
Vehicle Availability by Sex in Pontiac
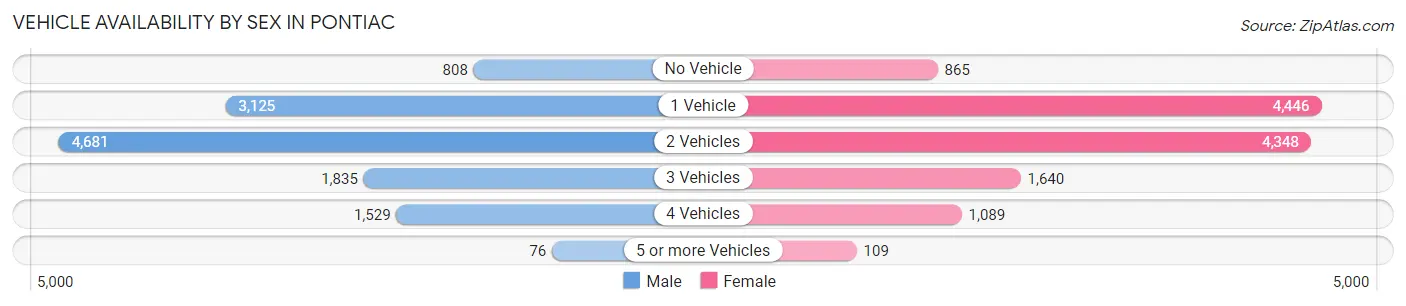
The most prevalent vehicle ownership categories in Pontiac are males with 2 vehicles (4,681, accounting for 38.8%) and females with 2 vehicles (4,348, making up 37.5%).
| Vehicles Available | Male | Female |
| No Vehicle | 808 (6.7%) | 865 (6.9%) |
| 1 Vehicle | 3,125 (25.9%) | 4,446 (35.6%) |
| 2 Vehicles | 4,681 (38.8%) | 4,348 (34.8%) |
| 3 Vehicles | 1,835 (15.2%) | 1,640 (13.1%) |
| 4 Vehicles | 1,529 (12.7%) | 1,089 (8.7%) |
| 5 or more Vehicles | 76 (0.6%) | 109 (0.9%) |
| Total | 12,054 (100.0%) | 12,497 (100.0%) |
Commute Time in Pontiac
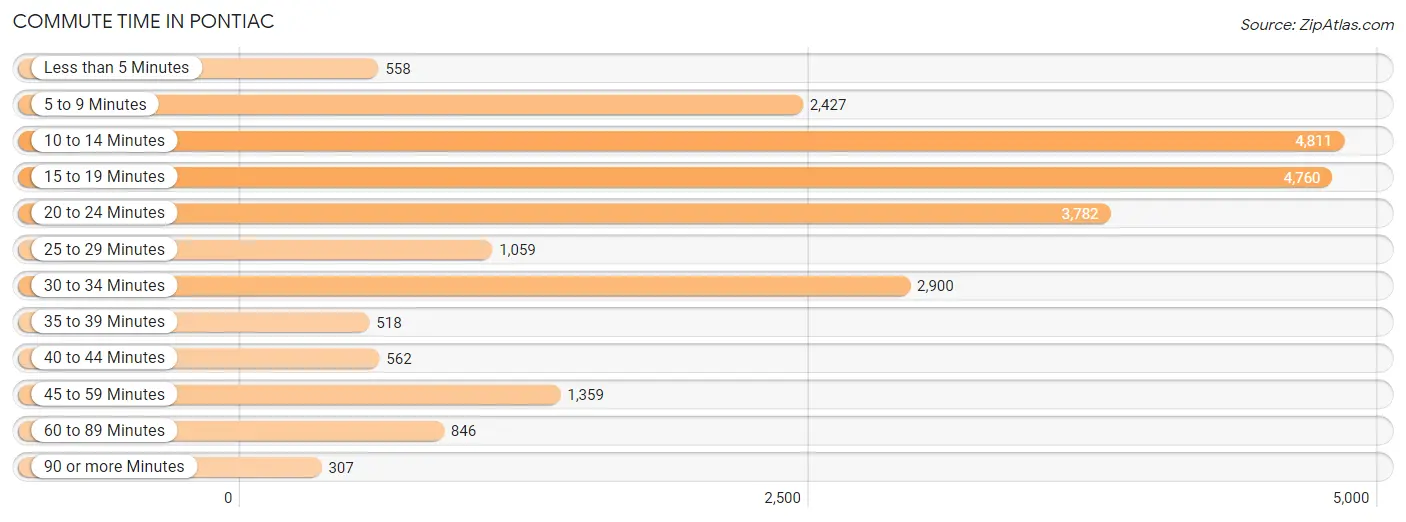
The most frequently occuring commute durations in Pontiac are 10 to 14 minutes (4,811 commuters, 20.1%), 15 to 19 minutes (4,760 commuters, 19.9%), and 20 to 24 minutes (3,782 commuters, 15.8%).
| Commute Time | # Commuters | % Commuters |
| Less than 5 Minutes | 558 | 2.3% |
| 5 to 9 Minutes | 2,427 | 10.2% |
| 10 to 14 Minutes | 4,811 | 20.1% |
| 15 to 19 Minutes | 4,760 | 19.9% |
| 20 to 24 Minutes | 3,782 | 15.8% |
| 25 to 29 Minutes | 1,059 | 4.4% |
| 30 to 34 Minutes | 2,900 | 12.1% |
| 35 to 39 Minutes | 518 | 2.2% |
| 40 to 44 Minutes | 562 | 2.4% |
| 45 to 59 Minutes | 1,359 | 5.7% |
| 60 to 89 Minutes | 846 | 3.5% |
| 90 or more Minutes | 307 | 1.3% |
Commute Time by Sex in Pontiac
The most common commute times in Pontiac are 10 to 14 minutes (2,160 commuters, 18.5%) for males and 15 to 19 minutes (2,658 commuters, 21.8%) for females.
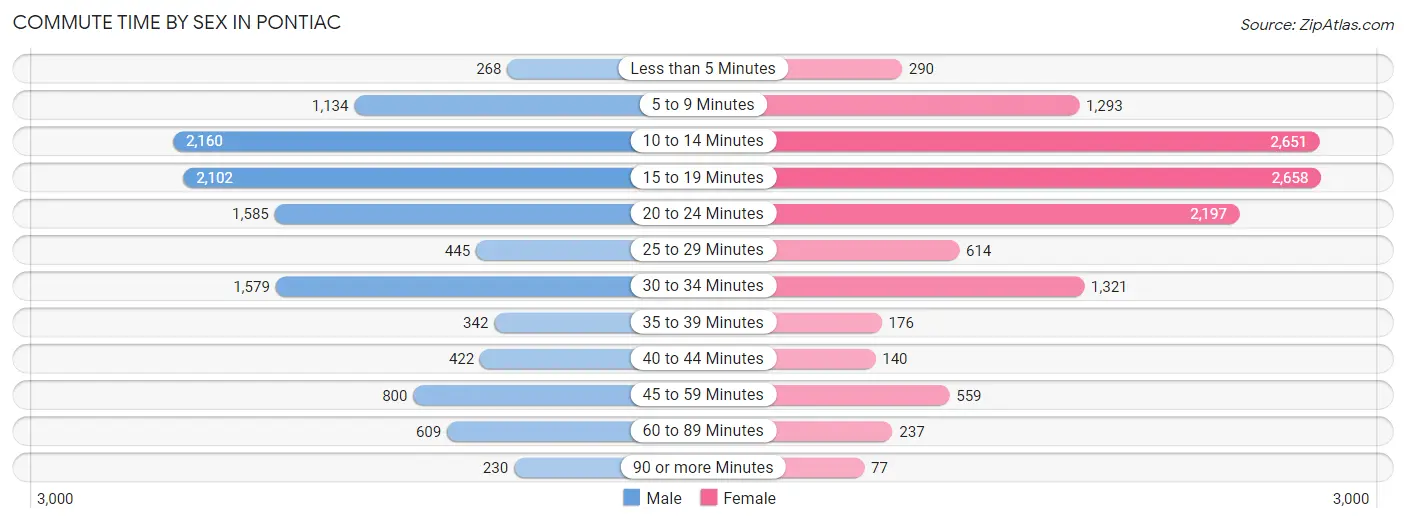
| Commute Time | Male | Female |
| Less than 5 Minutes | 268 (2.3%) | 290 (2.4%) |
| 5 to 9 Minutes | 1,134 (9.7%) | 1,293 (10.6%) |
| 10 to 14 Minutes | 2,160 (18.5%) | 2,651 (21.7%) |
| 15 to 19 Minutes | 2,102 (18.0%) | 2,658 (21.8%) |
| 20 to 24 Minutes | 1,585 (13.6%) | 2,197 (18.0%) |
| 25 to 29 Minutes | 445 (3.8%) | 614 (5.0%) |
| 30 to 34 Minutes | 1,579 (13.5%) | 1,321 (10.8%) |
| 35 to 39 Minutes | 342 (2.9%) | 176 (1.4%) |
| 40 to 44 Minutes | 422 (3.6%) | 140 (1.1%) |
| 45 to 59 Minutes | 800 (6.9%) | 559 (4.6%) |
| 60 to 89 Minutes | 609 (5.2%) | 237 (1.9%) |
| 90 or more Minutes | 230 (2.0%) | 77 (0.6%) |
Time of Departure to Work by Sex in Pontiac
The most frequent times of departure to work in Pontiac are 7:00 AM to 7:29 AM (1,776, 15.2%) for males and 7:30 AM to 7:59 AM (1,768, 14.5%) for females.
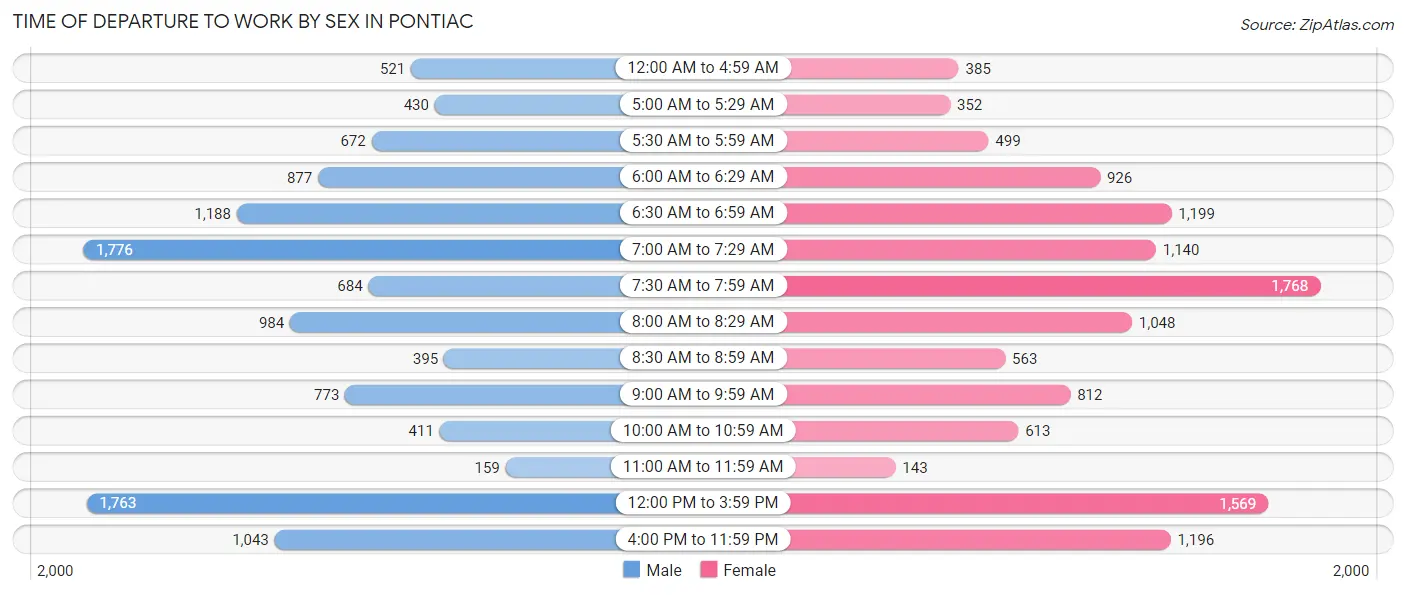
| Time of Departure | Male | Female |
| 12:00 AM to 4:59 AM | 521 (4.5%) | 385 (3.2%) |
| 5:00 AM to 5:29 AM | 430 (3.7%) | 352 (2.9%) |
| 5:30 AM to 5:59 AM | 672 (5.8%) | 499 (4.1%) |
| 6:00 AM to 6:29 AM | 877 (7.5%) | 926 (7.6%) |
| 6:30 AM to 6:59 AM | 1,188 (10.2%) | 1,199 (9.8%) |
| 7:00 AM to 7:29 AM | 1,776 (15.2%) | 1,140 (9.3%) |
| 7:30 AM to 7:59 AM | 684 (5.9%) | 1,768 (14.5%) |
| 8:00 AM to 8:29 AM | 984 (8.4%) | 1,048 (8.6%) |
| 8:30 AM to 8:59 AM | 395 (3.4%) | 563 (4.6%) |
| 9:00 AM to 9:59 AM | 773 (6.6%) | 812 (6.7%) |
| 10:00 AM to 10:59 AM | 411 (3.5%) | 613 (5.0%) |
| 11:00 AM to 11:59 AM | 159 (1.4%) | 143 (1.2%) |
| 12:00 PM to 3:59 PM | 1,763 (15.1%) | 1,569 (12.9%) |
| 4:00 PM to 11:59 PM | 1,043 (8.9%) | 1,196 (9.8%) |
| Total | 11,676 (100.0%) | 12,213 (100.0%) |
Housing Occupancy in Pontiac
Occupancy by Ownership in Pontiac
Of the total 25,343 dwellings in Pontiac, owner-occupied units account for 10,721 (42.3%), while renter-occupied units make up 14,622 (57.7%).
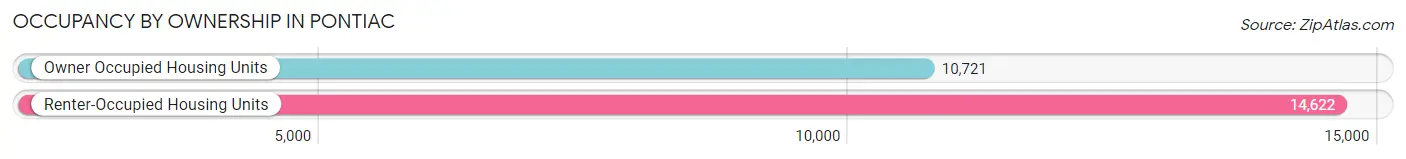
| Occupancy | # Housing Units | % Housing Units |
| Owner Occupied Housing Units | 10,721 | 42.3% |
| Renter-Occupied Housing Units | 14,622 | 57.7% |
| Total Occupied Housing Units | 25,343 | 100.0% |
Occupancy by Household Size in Pontiac
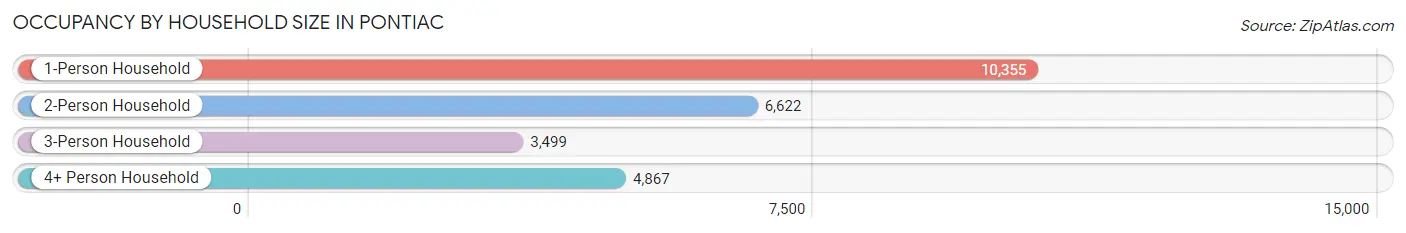
| Household Size | # Housing Units | % Housing Units |
| 1-Person Household | 10,355 | 40.9% |
| 2-Person Household | 6,622 | 26.1% |
| 3-Person Household | 3,499 | 13.8% |
| 4+ Person Household | 4,867 | 19.2% |
| Total Housing Units | 25,343 | 100.0% |
Occupancy by Ownership by Household Size in Pontiac
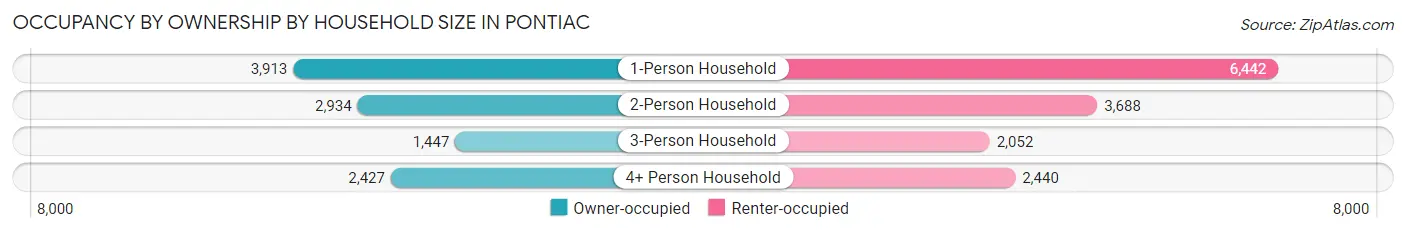
| Household Size | Owner-occupied | Renter-occupied |
| 1-Person Household | 3,913 (37.8%) | 6,442 (62.2%) |
| 2-Person Household | 2,934 (44.3%) | 3,688 (55.7%) |
| 3-Person Household | 1,447 (41.3%) | 2,052 (58.7%) |
| 4+ Person Household | 2,427 (49.9%) | 2,440 (50.1%) |
| Total Housing Units | 10,721 (42.3%) | 14,622 (57.7%) |
Occupancy by Educational Attainment in Pontiac
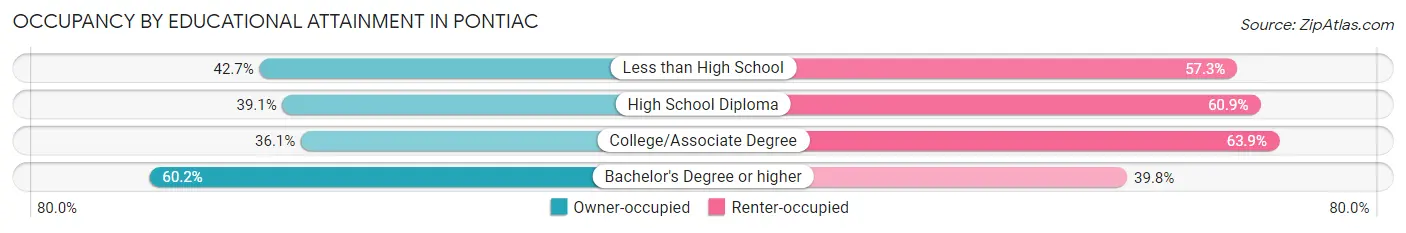
| Household Size | Owner-occupied | Renter-occupied |
| Less than High School | 1,926 (42.7%) | 2,580 (57.3%) |
| High School Diploma | 3,203 (39.1%) | 4,990 (60.9%) |
| College/Associate Degree | 3,033 (36.1%) | 5,360 (63.9%) |
| Bachelor's Degree or higher | 2,559 (60.2%) | 1,692 (39.8%) |
Occupancy by Age of Householder in Pontiac
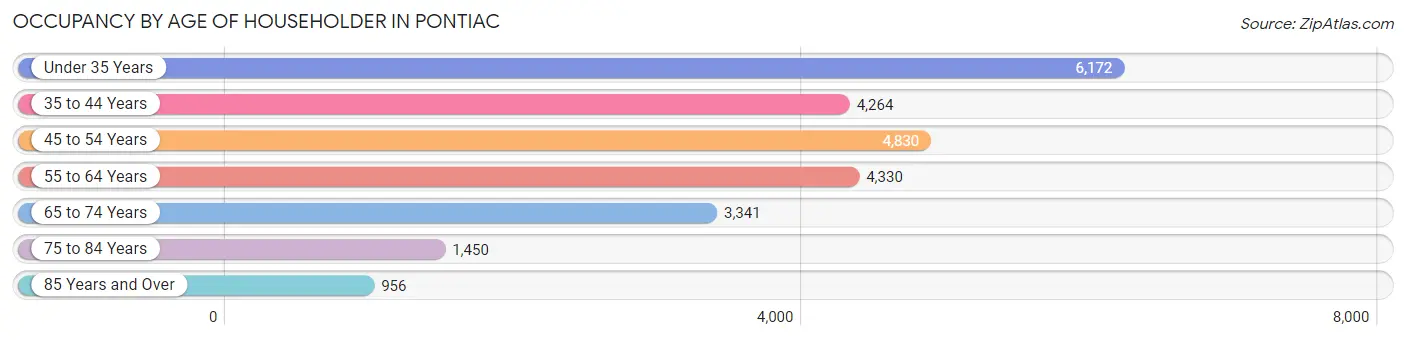
| Age Bracket | # Households | % Households |
| Under 35 Years | 6,172 | 24.3% |
| 35 to 44 Years | 4,264 | 16.8% |
| 45 to 54 Years | 4,830 | 19.1% |
| 55 to 64 Years | 4,330 | 17.1% |
| 65 to 74 Years | 3,341 | 13.2% |
| 75 to 84 Years | 1,450 | 5.7% |
| 85 Years and Over | 956 | 3.8% |
| Total | 25,343 | 100.0% |
Housing Finances in Pontiac
Median Income by Occupancy in Pontiac
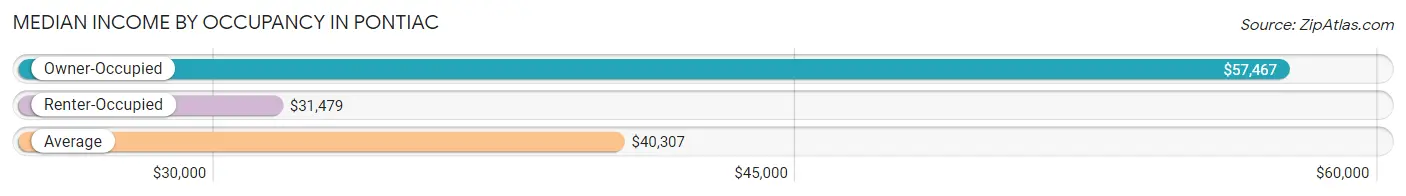
| Occupancy Type | # Households | Median Income |
| Owner-Occupied | 10,721 (42.3%) | $57,467 |
| Renter-Occupied | 14,622 (57.7%) | $31,479 |
| Average | 25,343 (100.0%) | $40,307 |
Occupancy by Householder Income Bracket in Pontiac
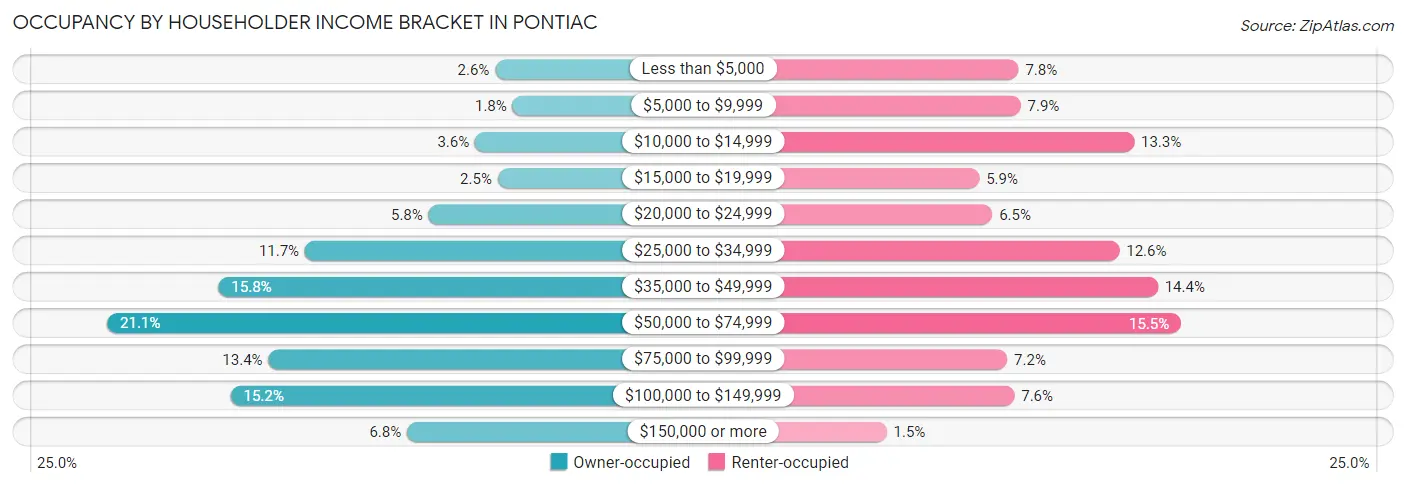
| Income Bracket | Owner-occupied | Renter-occupied |
| Less than $5,000 | 278 (2.6%) | 1,135 (7.8%) |
| $5,000 to $9,999 | 189 (1.8%) | 1,150 (7.9%) |
| $10,000 to $14,999 | 381 (3.5%) | 1,939 (13.3%) |
| $15,000 to $19,999 | 265 (2.5%) | 861 (5.9%) |
| $20,000 to $24,999 | 617 (5.8%) | 952 (6.5%) |
| $25,000 to $34,999 | 1,249 (11.7%) | 1,837 (12.6%) |
| $35,000 to $49,999 | 1,691 (15.8%) | 2,104 (14.4%) |
| $50,000 to $74,999 | 2,259 (21.1%) | 2,266 (15.5%) |
| $75,000 to $99,999 | 1,436 (13.4%) | 1,055 (7.2%) |
| $100,000 to $149,999 | 1,628 (15.2%) | 1,106 (7.6%) |
| $150,000 or more | 728 (6.8%) | 217 (1.5%) |
| Total | 10,721 (100.0%) | 14,622 (100.0%) |
Monthly Housing Cost Tiers in Pontiac
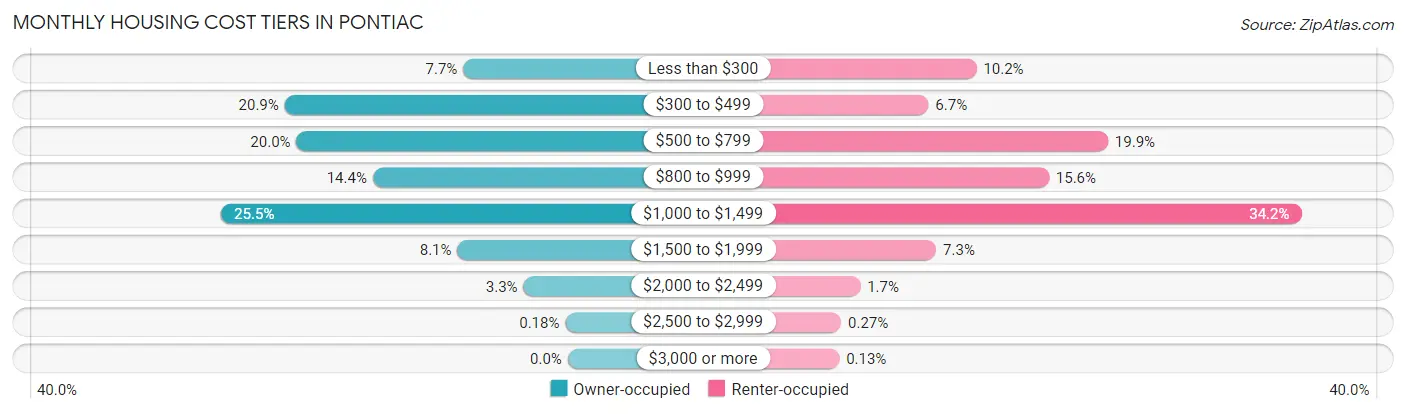
| Monthly Cost | Owner-occupied | Renter-occupied |
| Less than $300 | 826 (7.7%) | 1,497 (10.2%) |
| $300 to $499 | 2,235 (20.8%) | 980 (6.7%) |
| $500 to $799 | 2,142 (20.0%) | 2,913 (19.9%) |
| $800 to $999 | 1,540 (14.4%) | 2,276 (15.6%) |
| $1,000 to $1,499 | 2,737 (25.5%) | 4,995 (34.2%) |
| $1,500 to $1,999 | 872 (8.1%) | 1,063 (7.3%) |
| $2,000 to $2,499 | 350 (3.3%) | 246 (1.7%) |
| $2,500 to $2,999 | 19 (0.2%) | 39 (0.3%) |
| $3,000 or more | 0 (0.0%) | 19 (0.1%) |
| Total | 10,721 (100.0%) | 14,622 (100.0%) |
Physical Housing Characteristics in Pontiac
Housing Structures in Pontiac
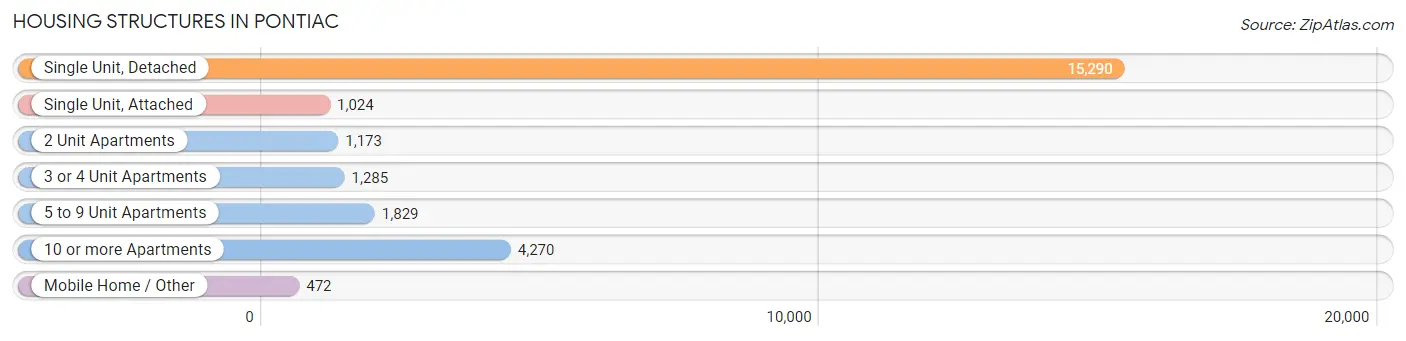
| Structure Type | # Housing Units | % Housing Units |
| Single Unit, Detached | 15,290 | 60.3% |
| Single Unit, Attached | 1,024 | 4.0% |
| 2 Unit Apartments | 1,173 | 4.6% |
| 3 or 4 Unit Apartments | 1,285 | 5.1% |
| 5 to 9 Unit Apartments | 1,829 | 7.2% |
| 10 or more Apartments | 4,270 | 16.9% |
| Mobile Home / Other | 472 | 1.9% |
| Total | 25,343 | 100.0% |
Housing Structures by Occupancy in Pontiac
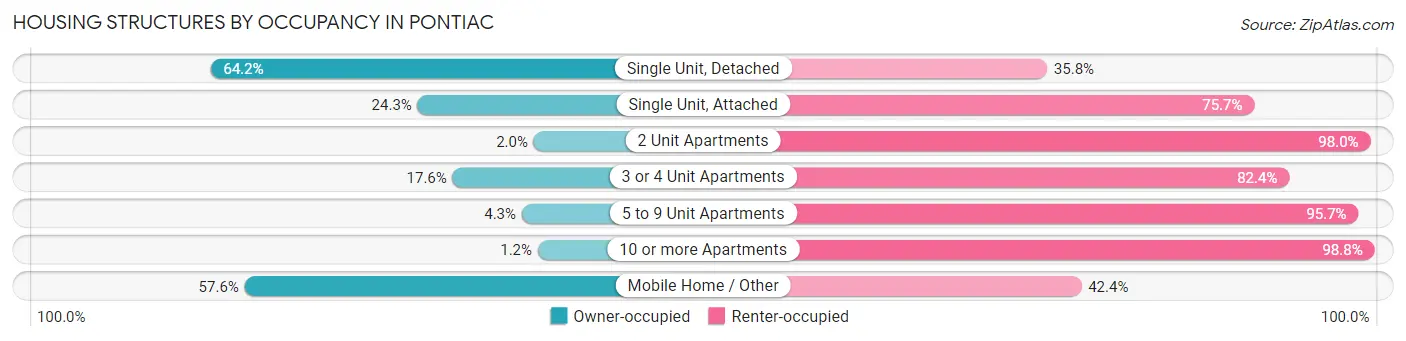
| Structure Type | Owner-occupied | Renter-occupied |
| Single Unit, Detached | 9,823 (64.2%) | 5,467 (35.8%) |
| Single Unit, Attached | 249 (24.3%) | 775 (75.7%) |
| 2 Unit Apartments | 23 (2.0%) | 1,150 (98.0%) |
| 3 or 4 Unit Apartments | 226 (17.6%) | 1,059 (82.4%) |
| 5 to 9 Unit Apartments | 78 (4.3%) | 1,751 (95.7%) |
| 10 or more Apartments | 50 (1.2%) | 4,220 (98.8%) |
| Mobile Home / Other | 272 (57.6%) | 200 (42.4%) |
| Total | 10,721 (42.3%) | 14,622 (57.7%) |
Housing Structures by Number of Rooms in Pontiac
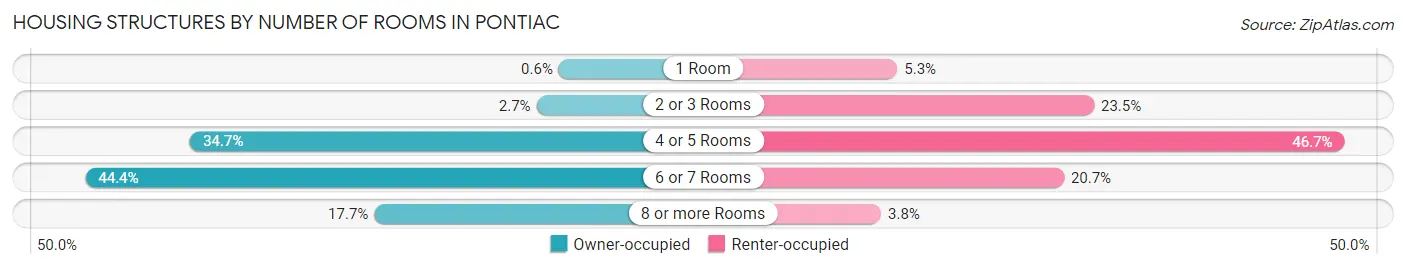
| Number of Rooms | Owner-occupied | Renter-occupied |
| 1 Room | 64 (0.6%) | 777 (5.3%) |
| 2 or 3 Rooms | 285 (2.7%) | 3,436 (23.5%) |
| 4 or 5 Rooms | 3,720 (34.7%) | 6,822 (46.7%) |
| 6 or 7 Rooms | 4,758 (44.4%) | 3,030 (20.7%) |
| 8 or more Rooms | 1,894 (17.7%) | 557 (3.8%) |
| Total | 10,721 (100.0%) | 14,622 (100.0%) |
Housing Structure by Heating Type in Pontiac
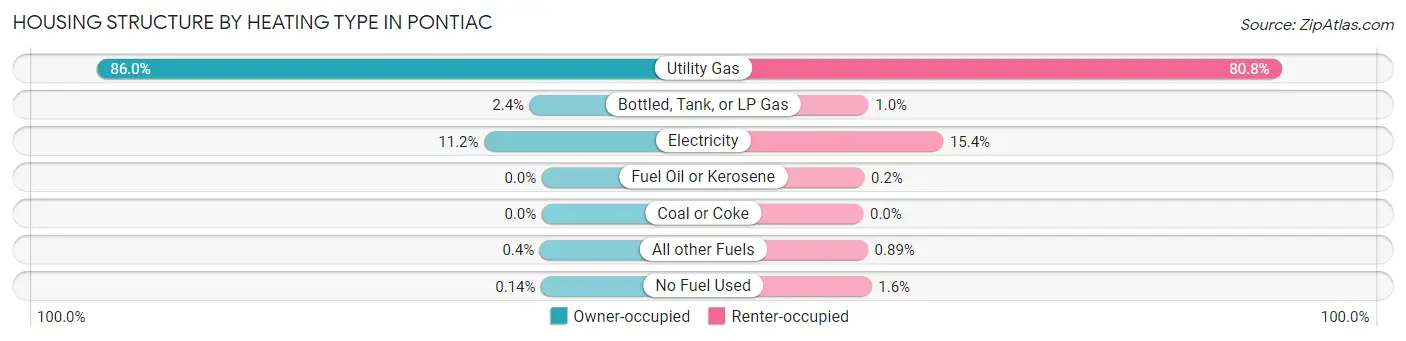
| Heating Type | Owner-occupied | Renter-occupied |
| Utility Gas | 9,215 (86.0%) | 11,821 (80.8%) |
| Bottled, Tank, or LP Gas | 252 (2.4%) | 150 (1.0%) |
| Electricity | 1,196 (11.2%) | 2,257 (15.4%) |
| Fuel Oil or Kerosene | 0 (0.0%) | 29 (0.2%) |
| Coal or Coke | 0 (0.0%) | 0 (0.0%) |
| All other Fuels | 43 (0.4%) | 130 (0.9%) |
| No Fuel Used | 15 (0.1%) | 235 (1.6%) |
| Total | 10,721 (100.0%) | 14,622 (100.0%) |
Household Vehicle Usage in Pontiac
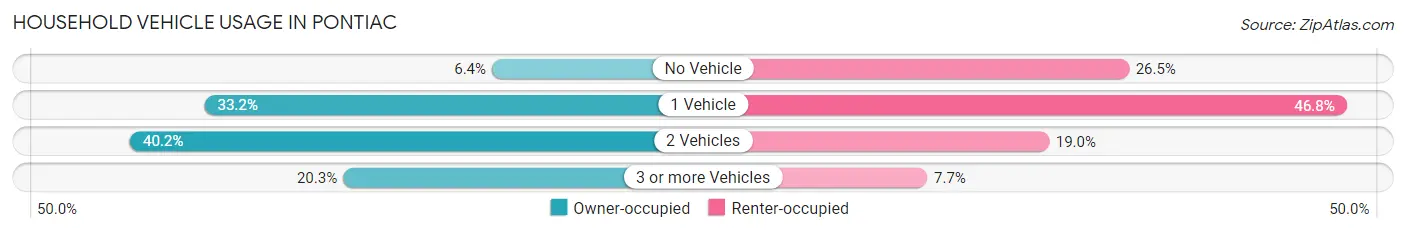
| Vehicles per Household | Owner-occupied | Renter-occupied |
| No Vehicle | 684 (6.4%) | 3,873 (26.5%) |
| 1 Vehicle | 3,559 (33.2%) | 6,846 (46.8%) |
| 2 Vehicles | 4,304 (40.2%) | 2,782 (19.0%) |
| 3 or more Vehicles | 2,174 (20.3%) | 1,121 (7.7%) |
| Total | 10,721 (100.0%) | 14,622 (100.0%) |
Real Estate & Mortgages in Pontiac
Real Estate and Mortgage Overview in Pontiac
| Characteristic | Without Mortgage | With Mortgage |
| Housing Units | 4,780 | 5,941 |
| Median Property Value | $79,600 | $116,600 |
| Median Household Income | $44,021 | $570 |
| Monthly Housing Costs | $446 | $0 |
| Real Estate Taxes | $1,016 | $204 |
Property Value by Mortgage Status in Pontiac
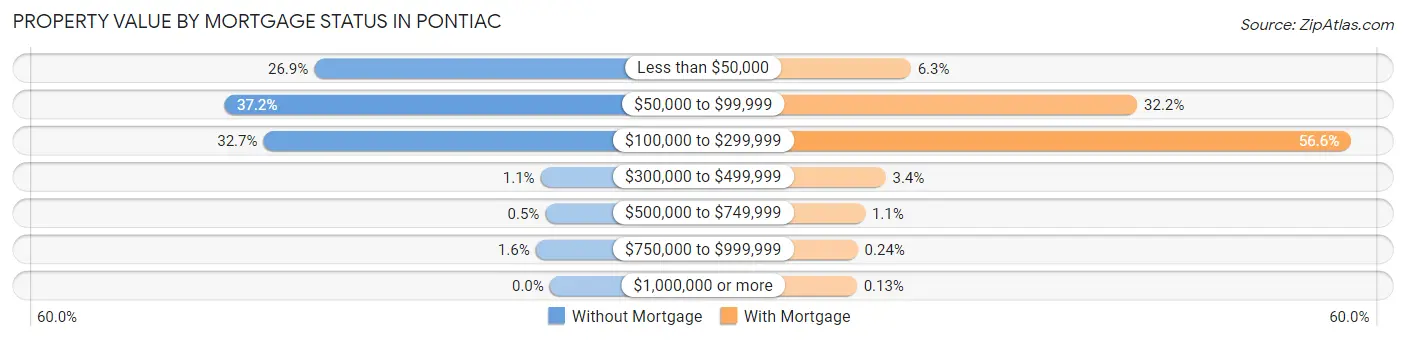
| Property Value | Without Mortgage | With Mortgage |
| Less than $50,000 | 1,287 (26.9%) | 375 (6.3%) |
| $50,000 to $99,999 | 1,778 (37.2%) | 1,912 (32.2%) |
| $100,000 to $299,999 | 1,564 (32.7%) | 3,364 (56.6%) |
| $300,000 to $499,999 | 50 (1.1%) | 204 (3.4%) |
| $500,000 to $749,999 | 24 (0.5%) | 64 (1.1%) |
| $750,000 to $999,999 | 77 (1.6%) | 14 (0.2%) |
| $1,000,000 or more | 0 (0.0%) | 8 (0.1%) |
| Total | 4,780 (100.0%) | 5,941 (100.0%) |
Household Income by Mortgage Status in Pontiac
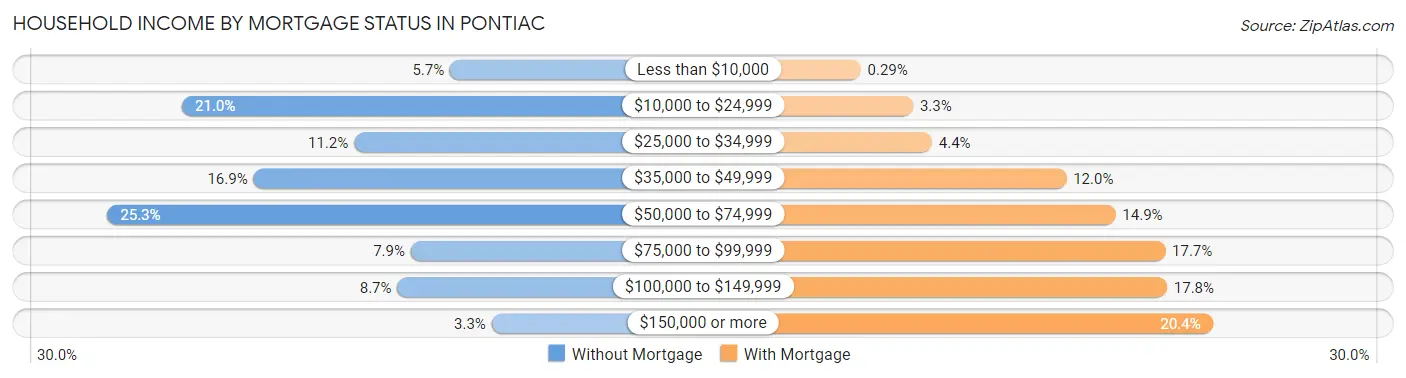
| Household Income | Without Mortgage | With Mortgage |
| Less than $10,000 | 272 (5.7%) | 17 (0.3%) |
| $10,000 to $24,999 | 1,004 (21.0%) | 195 (3.3%) |
| $25,000 to $34,999 | 534 (11.2%) | 259 (4.4%) |
| $35,000 to $49,999 | 809 (16.9%) | 715 (12.0%) |
| $50,000 to $74,999 | 1,208 (25.3%) | 882 (14.8%) |
| $75,000 to $99,999 | 379 (7.9%) | 1,051 (17.7%) |
| $100,000 to $149,999 | 416 (8.7%) | 1,057 (17.8%) |
| $150,000 or more | 158 (3.3%) | 1,212 (20.4%) |
| Total | 4,780 (100.0%) | 5,941 (100.0%) |
Property Value to Household Income Ratio in Pontiac
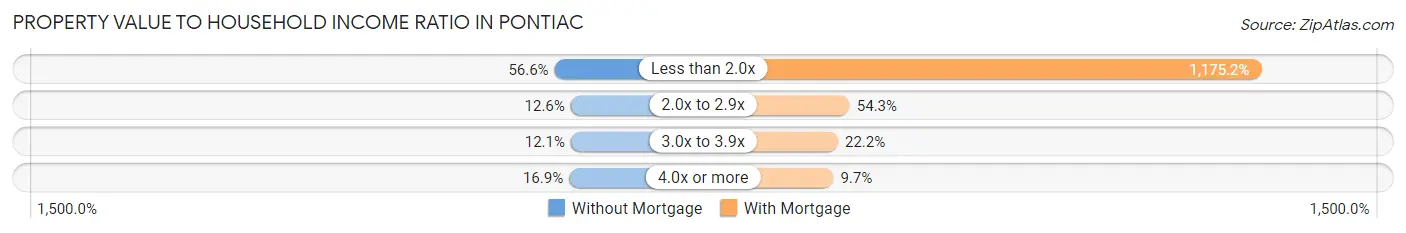
| Value-to-Income Ratio | Without Mortgage | With Mortgage |
| Less than 2.0x | 2,704 (56.6%) | 69,819 (1,175.2%) |
| 2.0x to 2.9x | 603 (12.6%) | 3,226 (54.3%) |
| 3.0x to 3.9x | 579 (12.1%) | 1,317 (22.2%) |
| 4.0x or more | 809 (16.9%) | 576 (9.7%) |
| Total | 4,780 (100.0%) | 5,941 (100.0%) |
Real Estate Taxes by Mortgage Status in Pontiac
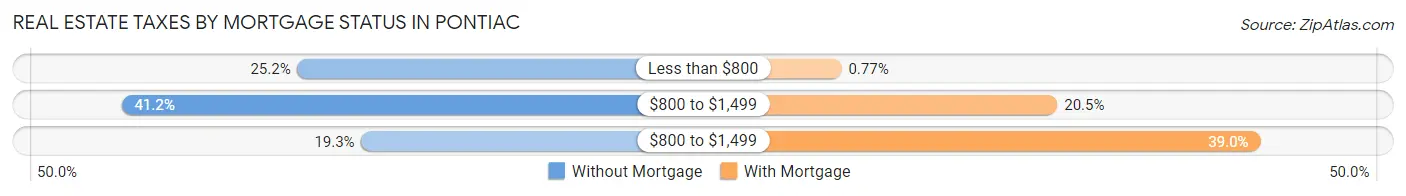
| Property Taxes | Without Mortgage | With Mortgage |
| Less than $800 | 1,203 (25.2%) | 46 (0.8%) |
| $800 to $1,499 | 1,967 (41.1%) | 1,217 (20.5%) |
| $800 to $1,499 | 924 (19.3%) | 2,319 (39.0%) |
| Total | 4,780 (100.0%) | 5,941 (100.0%) |
Health & Disability in Pontiac
Health Insurance Coverage by Age in Pontiac
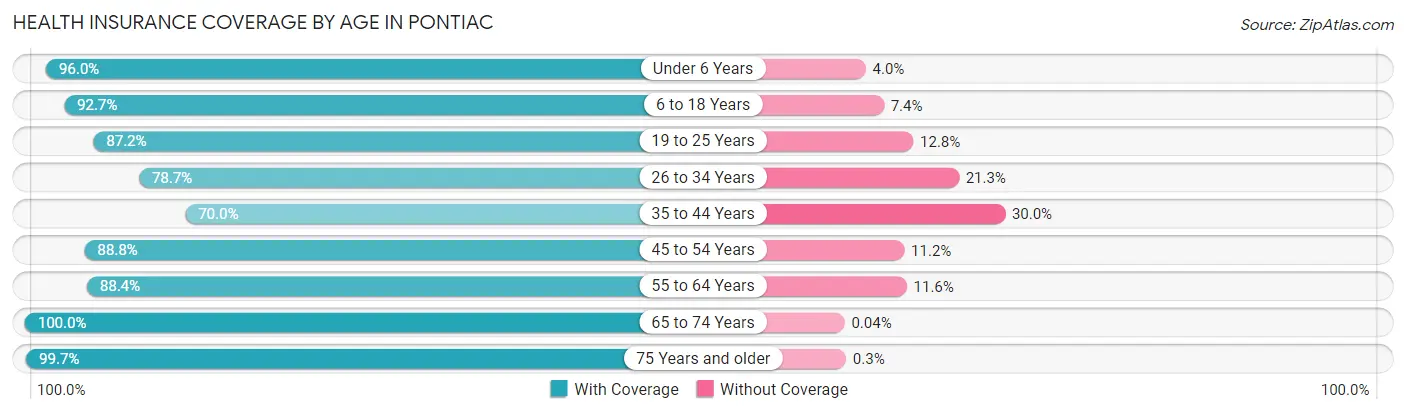
| Age Bracket | With Coverage | Without Coverage |
| Under 6 Years | 5,479 (96.0%) | 227 (4.0%) |
| 6 to 18 Years | 9,599 (92.6%) | 761 (7.3%) |
| 19 to 25 Years | 5,749 (87.2%) | 846 (12.8%) |
| 26 to 34 Years | 6,561 (78.7%) | 1,779 (21.3%) |
| 35 to 44 Years | 4,904 (70.0%) | 2,098 (30.0%) |
| 45 to 54 Years | 7,042 (88.8%) | 885 (11.2%) |
| 55 to 64 Years | 6,108 (88.4%) | 803 (11.6%) |
| 65 to 74 Years | 4,620 (100.0%) | 2 (0.0%) |
| 75 Years and older | 3,017 (99.7%) | 9 (0.3%) |
| Total | 53,079 (87.7%) | 7,410 (12.2%) |
Health Insurance Coverage by Citizenship Status in Pontiac
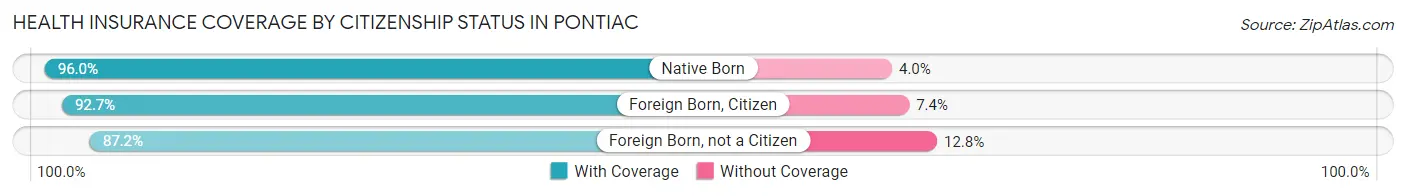
| Citizenship Status | With Coverage | Without Coverage |
| Native Born | 5,479 (96.0%) | 227 (4.0%) |
| Foreign Born, Citizen | 9,599 (92.6%) | 761 (7.3%) |
| Foreign Born, not a Citizen | 5,749 (87.2%) | 846 (12.8%) |
Health Insurance Coverage by Household Income in Pontiac
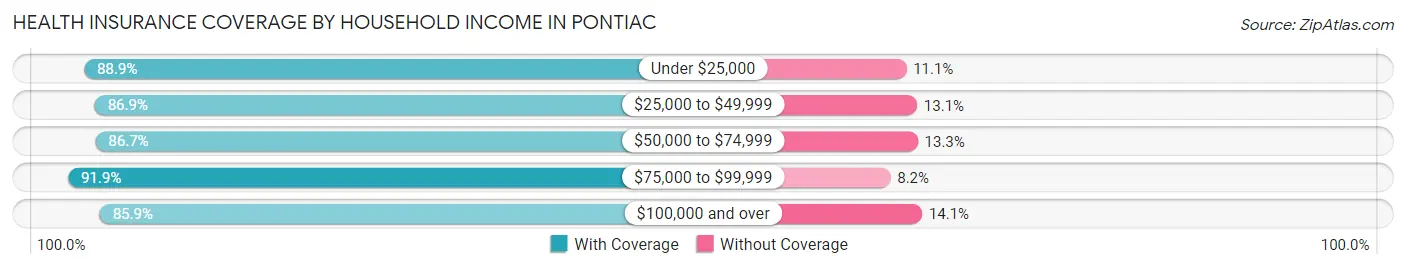
| Household Income | With Coverage | Without Coverage |
| Under $25,000 | 12,878 (88.9%) | 1,613 (11.1%) |
| $25,000 to $49,999 | 11,743 (86.9%) | 1,777 (13.1%) |
| $50,000 to $74,999 | 10,599 (86.7%) | 1,621 (13.3%) |
| $75,000 to $99,999 | 7,132 (91.8%) | 633 (8.2%) |
| $100,000 and over | 10,402 (85.9%) | 1,704 (14.1%) |
Public vs Private Health Insurance Coverage by Age in Pontiac
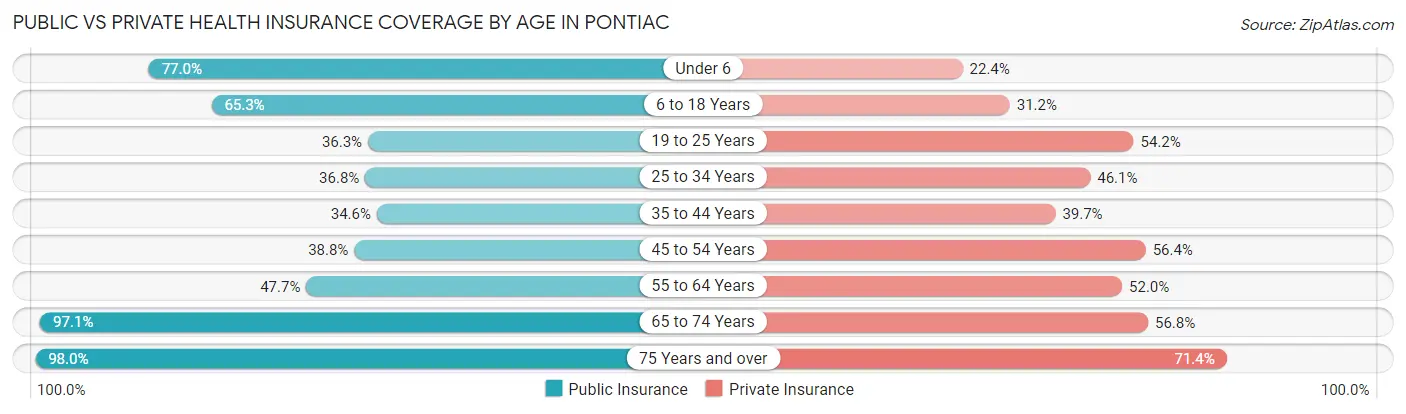
| Age Bracket | Public Insurance | Private Insurance |
| Under 6 | 4,391 (76.9%) | 1,279 (22.4%) |
| 6 to 18 Years | 6,766 (65.3%) | 3,231 (31.2%) |
| 19 to 25 Years | 2,392 (36.3%) | 3,571 (54.1%) |
| 25 to 34 Years | 3,068 (36.8%) | 3,846 (46.1%) |
| 35 to 44 Years | 2,425 (34.6%) | 2,777 (39.7%) |
| 45 to 54 Years | 3,077 (38.8%) | 4,472 (56.4%) |
| 55 to 64 Years | 3,298 (47.7%) | 3,596 (52.0%) |
| 65 to 74 Years | 4,489 (97.1%) | 2,627 (56.8%) |
| 75 Years and over | 2,966 (98.0%) | 2,161 (71.4%) |
| Total | 32,872 (54.3%) | 27,560 (45.6%) |
Disability Status by Sex by Age in Pontiac
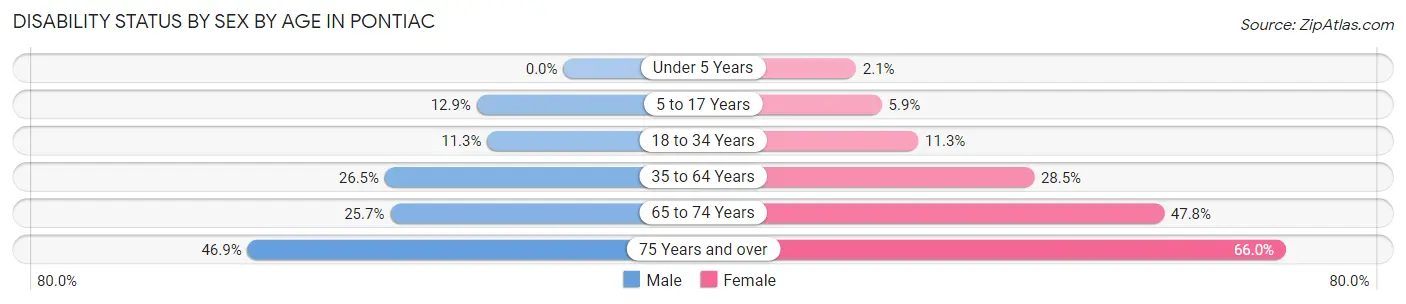
| Age Bracket | Male | Female |
| Under 5 Years | 0 (0.0%) | 49 (2.1%) |
| 5 to 17 Years | 673 (12.9%) | 323 (5.9%) |
| 18 to 34 Years | 848 (11.3%) | 930 (11.3%) |
| 35 to 64 Years | 2,842 (26.5%) | 3,171 (28.5%) |
| 65 to 74 Years | 576 (25.7%) | 1,139 (47.8%) |
| 75 Years and over | 378 (46.9%) | 1,464 (65.9%) |
Disability Class by Sex by Age in Pontiac
Disability Class: Hearing Difficulty
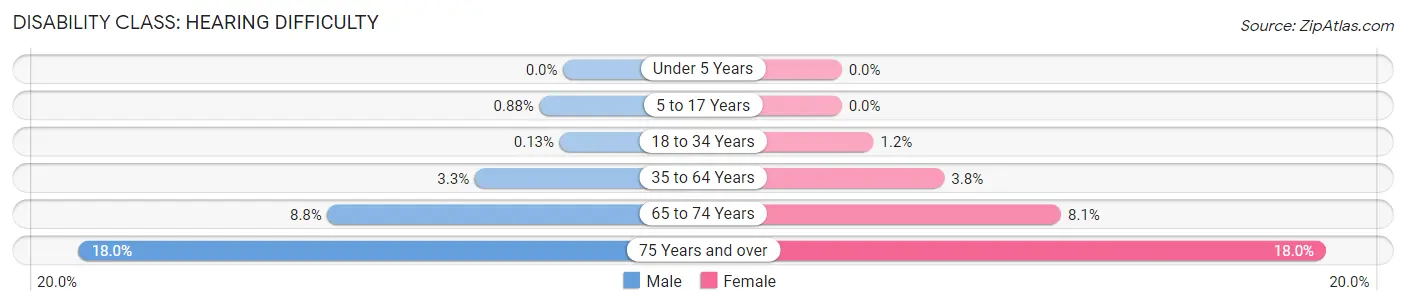
| Age Bracket | Male | Female |
| Under 5 Years | 0 (0.0%) | 0 (0.0%) |
| 5 to 17 Years | 46 (0.9%) | 0 (0.0%) |
| 18 to 34 Years | 10 (0.1%) | 97 (1.2%) |
| 35 to 64 Years | 352 (3.3%) | 423 (3.8%) |
| 65 to 74 Years | 196 (8.7%) | 194 (8.1%) |
| 75 Years and over | 145 (18.0%) | 399 (18.0%) |
Disability Class: Vision Difficulty
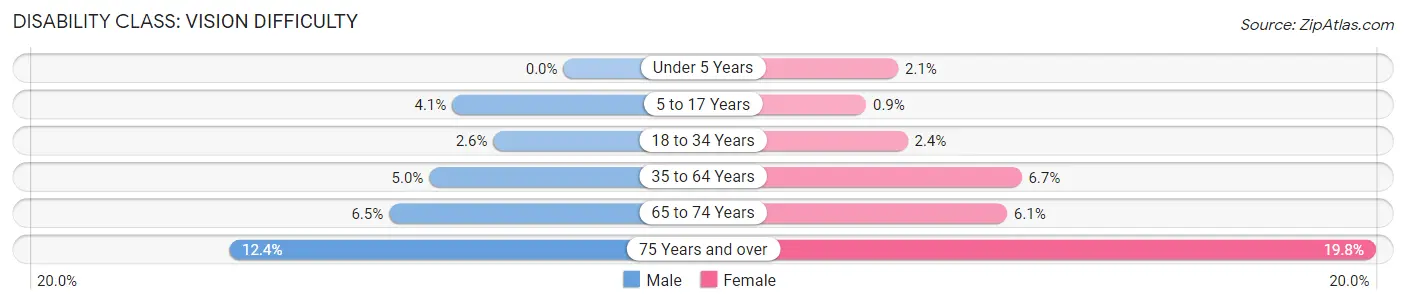
| Age Bracket | Male | Female |
| Under 5 Years | 0 (0.0%) | 49 (2.1%) |
| 5 to 17 Years | 216 (4.1%) | 49 (0.9%) |
| 18 to 34 Years | 195 (2.6%) | 200 (2.4%) |
| 35 to 64 Years | 534 (5.0%) | 741 (6.7%) |
| 65 to 74 Years | 145 (6.5%) | 146 (6.1%) |
| 75 Years and over | 100 (12.4%) | 440 (19.8%) |
Disability Class: Cognitive Difficulty
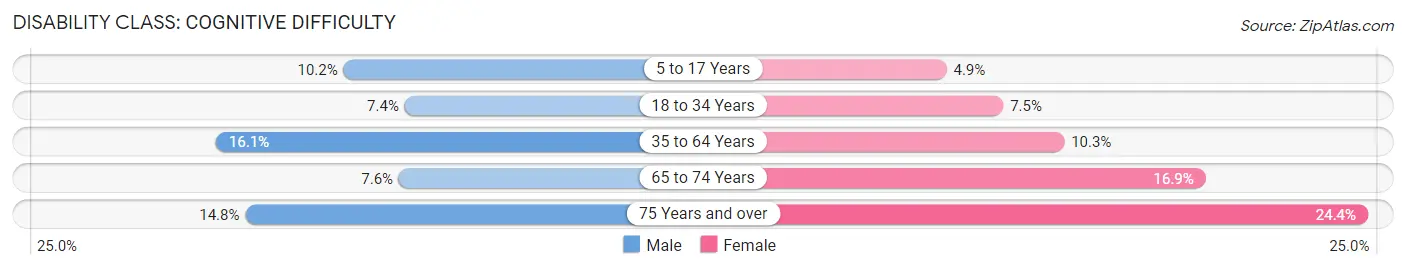
| Age Bracket | Male | Female |
| 5 to 17 Years | 533 (10.2%) | 266 (4.9%) |
| 18 to 34 Years | 553 (7.4%) | 614 (7.5%) |
| 35 to 64 Years | 1,729 (16.1%) | 1,147 (10.3%) |
| 65 to 74 Years | 171 (7.6%) | 402 (16.9%) |
| 75 Years and over | 119 (14.8%) | 542 (24.4%) |
Disability Class: Ambulatory Difficulty
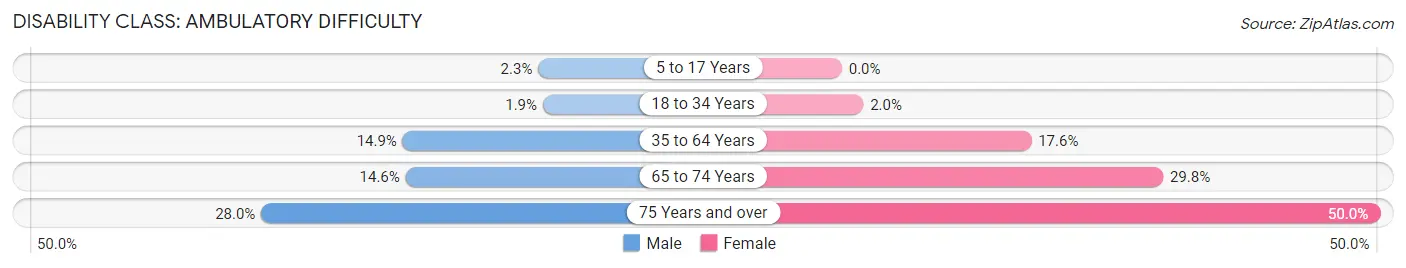
| Age Bracket | Male | Female |
| 5 to 17 Years | 122 (2.3%) | 0 (0.0%) |
| 18 to 34 Years | 143 (1.9%) | 163 (2.0%) |
| 35 to 64 Years | 1,599 (14.9%) | 1,954 (17.6%) |
| 65 to 74 Years | 328 (14.6%) | 710 (29.8%) |
| 75 Years and over | 226 (28.0%) | 1,109 (49.9%) |
Disability Class: Self-Care Difficulty
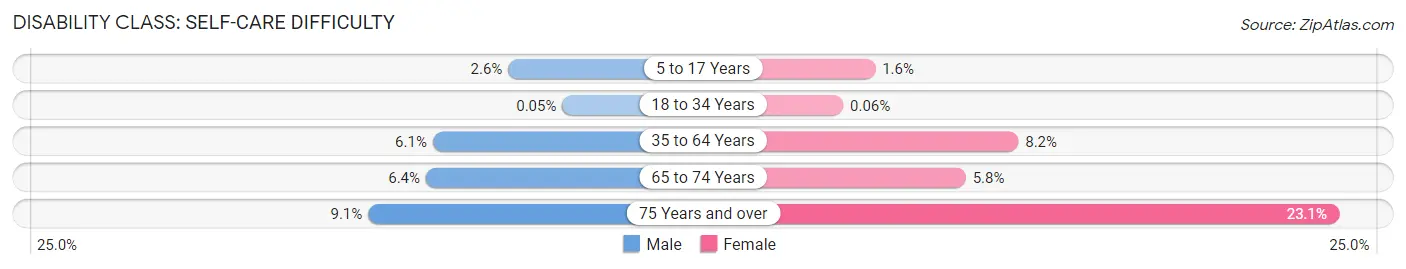
| Age Bracket | Male | Female |
| 5 to 17 Years | 134 (2.6%) | 85 (1.5%) |
| 18 to 34 Years | 4 (0.1%) | 5 (0.1%) |
| 35 to 64 Years | 650 (6.1%) | 910 (8.2%) |
| 65 to 74 Years | 143 (6.4%) | 137 (5.8%) |
| 75 Years and over | 73 (9.1%) | 512 (23.1%) |
Technology Access in Pontiac
Computing Device Access in Pontiac
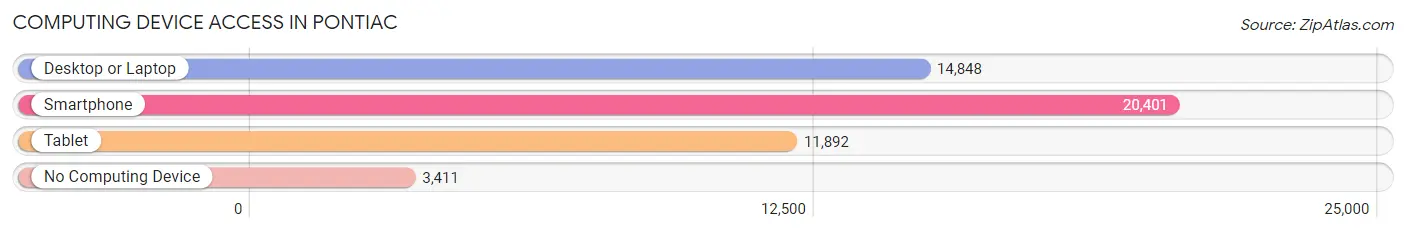
| Device Type | # Households | % Households |
| Desktop or Laptop | 14,848 | 58.6% |
| Smartphone | 20,401 | 80.5% |
| Tablet | 11,892 | 46.9% |
| No Computing Device | 3,411 | 13.5% |
| Total | 25,343 | 100.0% |
Internet Access in Pontiac
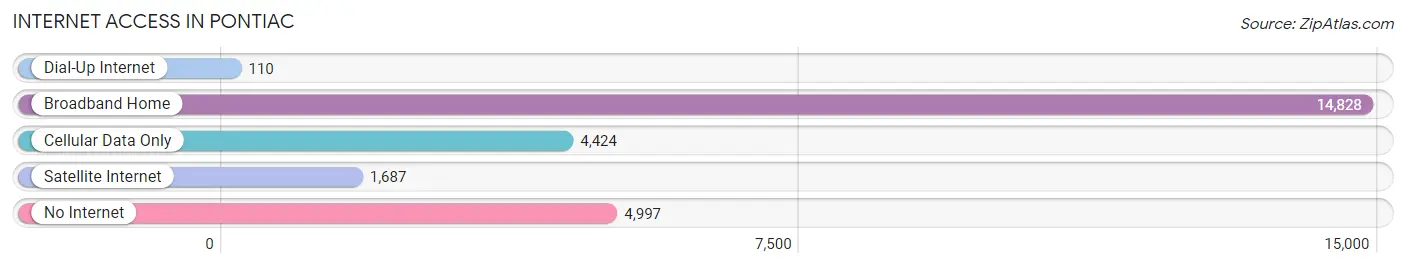
| Internet Type | # Households | % Households |
| Dial-Up Internet | 110 | 0.4% |
| Broadband Home | 14,828 | 58.5% |
| Cellular Data Only | 4,424 | 17.5% |
| Satellite Internet | 1,687 | 6.7% |
| No Internet | 4,997 | 19.7% |
| Total | 25,343 | 100.0% |
Pontiac Summary
Pontiac, Michigan is a city located in Oakland County, Michigan, United States. It is located about 30 miles northwest of Detroit and is part of the Detroit metropolitan area. The city has a population of 59,515 as of the 2010 census, making it the second largest city in Oakland County.
History
Pontiac was first settled in 1818 by a French-Canadian fur trader named Obadiah Brown. He named the settlement after the Ottawa chief, Chief Pontiac, who had led a rebellion against the British in the area in the late 1700s. The settlement grew slowly until the late 1800s when the automobile industry began to take off in Detroit. Pontiac became a popular destination for those looking to escape the hustle and bustle of the city.
In the early 1900s, Pontiac was incorporated as a village and then as a city in 1918. The city grew rapidly in the 1920s and 1930s, becoming a major manufacturing center for the automotive industry. During this time, Pontiac was home to several major automotive companies, including General Motors, Fisher Body, and Oakland Motor Car Company.
In the 1950s, Pontiac began to experience a decline in its manufacturing industry. This decline was due to the rise of suburbanization and the decline of the automotive industry in Detroit. The city's population began to decline as well, and by the 1970s, Pontiac had become a predominantly African-American city.
Geography
Pontiac is located in southeastern Michigan, about 30 miles northwest of Detroit. It is situated on the Clinton River, which flows through the city. The city is bordered by Auburn Hills to the north, Waterford Township to the east, Bloomfield Township to the south, and Troy to the west.
The city has a total area of 16.2 square miles, of which 15.9 square miles is land and 0.3 square miles is water. The terrain is mostly flat, with some rolling hills in the northern part of the city.
Economy
Pontiac's economy is largely based on the automotive industry. The city is home to several automotive-related businesses, including General Motors, Fisher Body, and Oakland Motor Car Company. In addition, the city is home to several other businesses, including healthcare, retail, and hospitality.
The city also has a growing technology sector, with several tech startups located in the city. The city is also home to several educational institutions, including Oakland University, Oakland Community College, and Baker College.
Demographics
As of the 2010 census, Pontiac had a population of 59,515. The racial makeup of the city was 57.2% African American, 33.3% White, 4.2% Hispanic or Latino, 2.2% Asian, and 0.7% Native American.
The median household income in Pontiac was $30,945 in 2018, and the median home value was $90,000. The city has a poverty rate of 28.3%, which is higher than the national average.
Conclusion
Pontiac, Michigan is a city located in Oakland County, Michigan, United States. It is located about 30 miles northwest of Detroit and is part of the Detroit metropolitan area. The city has a population of 59,515 as of the 2010 census, making it the second largest city in Oakland County. The city's economy is largely based on the automotive industry, with several automotive-related businesses located in the city. The city also has a growing technology sector, with several tech startups located in the city. The racial makeup of the city is 57.2% African American, 33.3% White, 4.2% Hispanic or Latino, 2.2% Asian, and 0.7% Native American. The median household income in Pontiac was $30,945 in 2018, and the median home value was $90,000. The city has a poverty rate of 28.3%, which is higher than the national average.
Common Questions
What is Per Capita Income in Pontiac?
Per Capita income in Pontiac is $23,024.
What is the Median Family Income in Pontiac?
Median Family Income in Pontiac is $53,386.
What is the Median Household income in Pontiac?
Median Household Income in Pontiac is $40,307.
What is Income or Wage Gap in Pontiac?
Income or Wage Gap in Pontiac is 15.8%.
Women in Pontiac earn 84.2 cents for every dollar earned by a man.
What is Family Income Deficit in Pontiac?
Family Income Deficit in Pontiac is $12,079.
Families that are below poverty line in Pontiac earn $12,079 less on average than the poverty threshold level.
What is Inequality or Gini Index in Pontiac?
Inequality or Gini Index in Pontiac is 0.45.
What is the Total Population of Pontiac?
Total Population of Pontiac is 61,965.
What is the Total Male Population of Pontiac?
Total Male Population of Pontiac is 29,966.
What is the Total Female Population of Pontiac?
Total Female Population of Pontiac is 31,999.
What is the Ratio of Males per 100 Females in Pontiac?
There are 93.65 Males per 100 Females in Pontiac.
What is the Ratio of Females per 100 Males in Pontiac?
There are 106.78 Females per 100 Males in Pontiac.
What is the Median Population Age in Pontiac?
Median Population Age in Pontiac is 33.8 Years.
What is the Average Family Size in Pontiac
Average Family Size in Pontiac is 3.3 People.
What is the Average Household Size in Pontiac
Average Household Size in Pontiac is 2.4 People.
How Large is the Labor Force in Pontiac?
There are 28,917 People in the Labor Forcein in Pontiac.
What is the Percentage of People in the Labor Force in Pontiac?
59.7% of People are in the Labor Force in Pontiac.
What is the Unemployment Rate in Pontiac?
Unemployment Rate in Pontiac is 9.5%.