Fenton, MI Map & Demographics
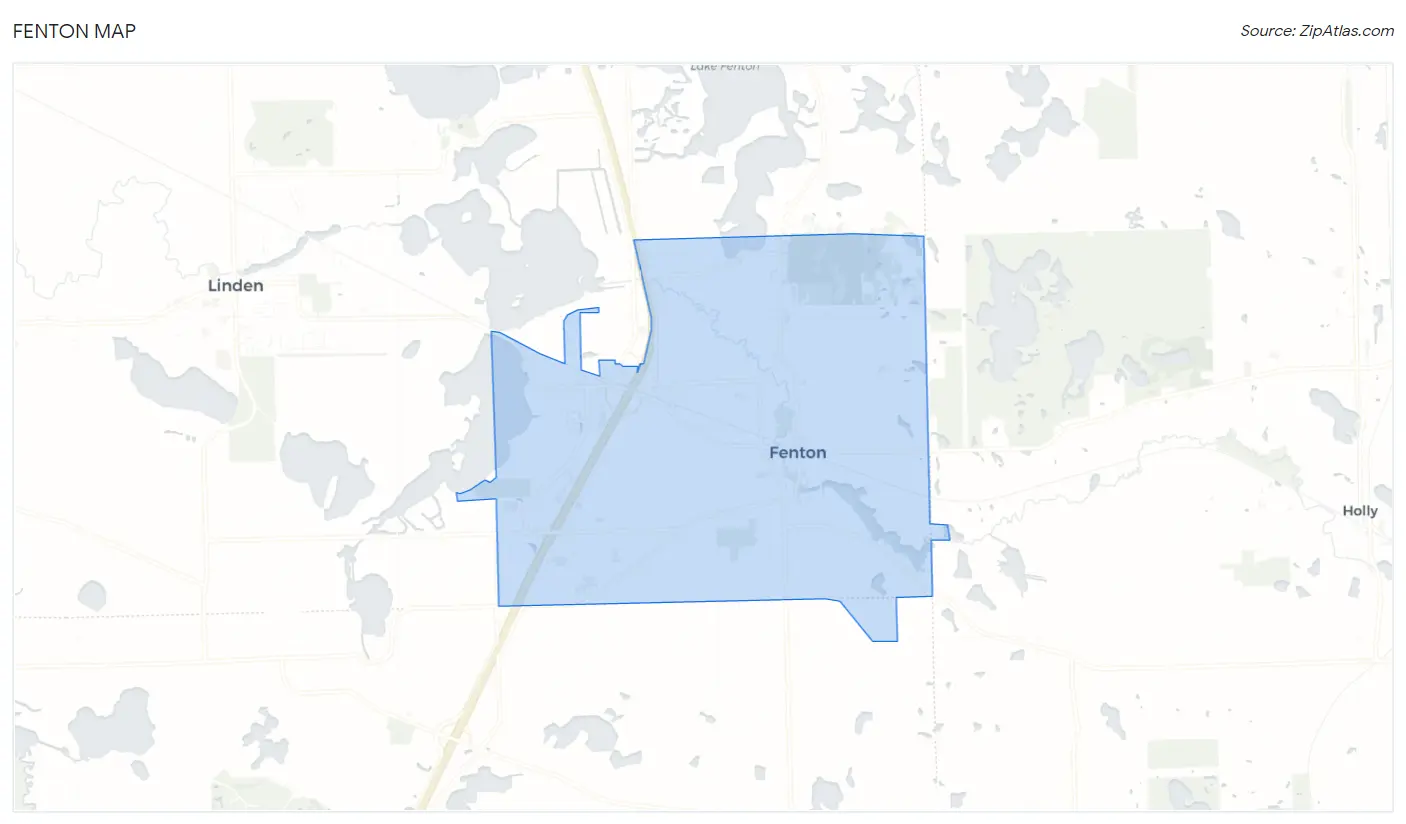
Fenton Map
Fenton Overview
$41,682
PER CAPITA INCOME
$104,128
AVG FAMILY INCOME
$76,195
AVG HOUSEHOLD INCOME
19.9%
WAGE / INCOME GAP [ % ]
80.1¢/ $1
WAGE / INCOME GAP [ $ ]
0.42
INEQUALITY / GINI INDEX
11,967
TOTAL POPULATION
5,363
MALE POPULATION
6,604
FEMALE POPULATION
81.21
MALES / 100 FEMALES
123.14
FEMALES / 100 MALES
38.1
MEDIAN AGE
2.9
AVG FAMILY SIZE
2.3
AVG HOUSEHOLD SIZE
6,569
LABOR FORCE [ PEOPLE ]
67.7%
PERCENT IN LABOR FORCE
4.7%
UNEMPLOYMENT RATE
Fenton Zip Codes
Income in Fenton
Income Overview in Fenton
Per Capita Income in Fenton is $41,682, while median incomes of families and households are $104,128 and $76,195 respectively.
| Characteristic | Number | Measure |
| Per Capita Income | 11,967 | $41,682 |
| Median Family Income | 3,022 | $104,128 |
| Mean Family Income | 3,022 | $117,674 |
| Median Household Income | 5,212 | $76,195 |
| Mean Household Income | 5,212 | $94,181 |
| Income Deficit | 3,022 | $0 |
| Wage / Income Gap (%) | 11,967 | 19.91% |
| Wage / Income Gap ($) | 11,967 | 80.09¢ per $1 |
| Gini / Inequality Index | 11,967 | 0.42 |
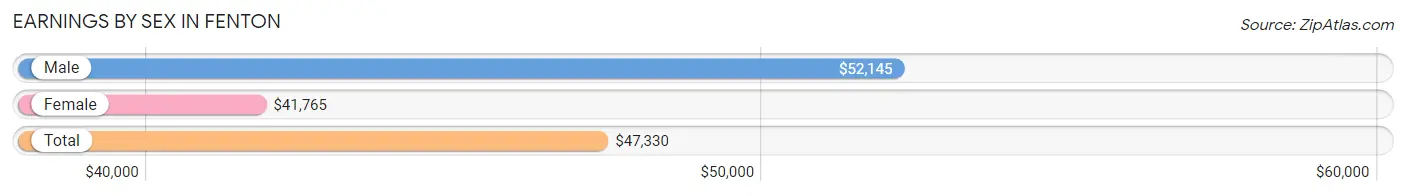
Earnings by Sex in Fenton
Average Earnings in Fenton are $47,330, $52,145 for men and $41,765 for women, a difference of 19.9%.
| Sex | Number | Average Earnings |
| Male | 3,341 (49.2%) | $52,145 |
| Female | 3,451 (50.8%) | $41,765 |
| Total | 6,792 (100.0%) | $47,330 |
Earnings by Sex by Income Bracket in Fenton
The most common earnings brackets in Fenton are $100,000+ for men (887 | 26.6%) and $55,000 to $64,999 for women (387 | 11.2%).
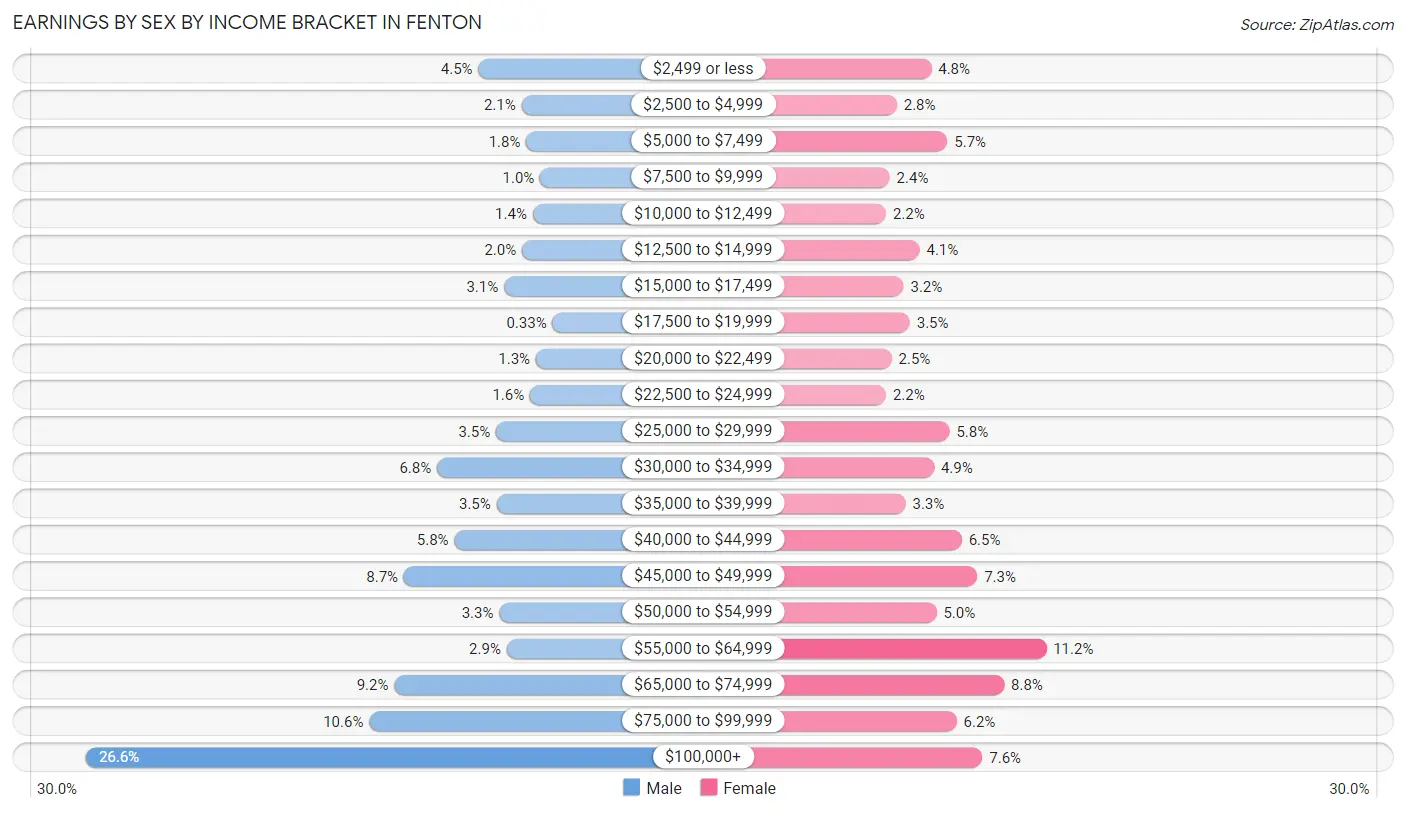
| Income | Male | Female |
| $2,499 or less | 150 (4.5%) | 164 (4.8%) |
| $2,500 to $4,999 | 69 (2.1%) | 97 (2.8%) |
| $5,000 to $7,499 | 60 (1.8%) | 195 (5.7%) |
| $7,500 to $9,999 | 34 (1.0%) | 83 (2.4%) |
| $10,000 to $12,499 | 48 (1.4%) | 76 (2.2%) |
| $12,500 to $14,999 | 68 (2.0%) | 141 (4.1%) |
| $15,000 to $17,499 | 102 (3.0%) | 110 (3.2%) |
| $17,500 to $19,999 | 11 (0.3%) | 122 (3.5%) |
| $20,000 to $22,499 | 42 (1.3%) | 87 (2.5%) |
| $22,500 to $24,999 | 53 (1.6%) | 76 (2.2%) |
| $25,000 to $29,999 | 117 (3.5%) | 199 (5.8%) |
| $30,000 to $34,999 | 228 (6.8%) | 169 (4.9%) |
| $35,000 to $39,999 | 116 (3.5%) | 114 (3.3%) |
| $40,000 to $44,999 | 195 (5.8%) | 223 (6.5%) |
| $45,000 to $49,999 | 290 (8.7%) | 253 (7.3%) |
| $50,000 to $54,999 | 111 (3.3%) | 174 (5.0%) |
| $55,000 to $64,999 | 97 (2.9%) | 387 (11.2%) |
| $65,000 to $74,999 | 308 (9.2%) | 305 (8.8%) |
| $75,000 to $99,999 | 355 (10.6%) | 213 (6.2%) |
| $100,000+ | 887 (26.6%) | 263 (7.6%) |
| Total | 3,341 (100.0%) | 3,451 (100.0%) |
Earnings by Sex by Educational Attainment in Fenton
Average earnings in Fenton are $67,928 for men and $45,837 for women, a difference of 32.5%. Men with an educational attainment of bachelor's degree enjoy the highest average annual earnings of $102,019, while those with high school diploma education earn the least with $40,781. Women with an educational attainment of graduate degree earn the most with the average annual earnings of $66,429, while those with high school diploma education have the smallest earnings of $26,354.
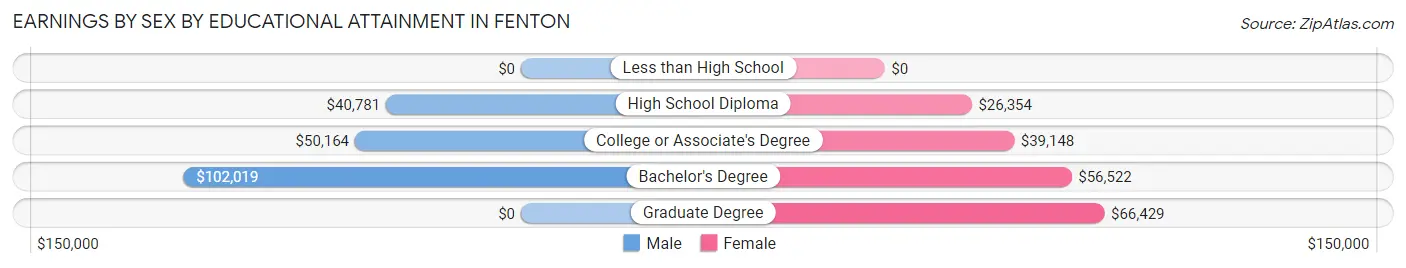
| Educational Attainment | Male Income | Female Income |
| Less than High School | - | - |
| High School Diploma | $40,781 | $26,354 |
| College or Associate's Degree | $50,164 | $39,148 |
| Bachelor's Degree | $102,019 | $56,522 |
| Graduate Degree | - | - |
| Total | $67,928 | $45,837 |
Family Income in Fenton
Family Income Brackets in Fenton
According to the Fenton family income data, there are 846 families falling into the $100,000 to $149,999 income range, which is the most common income bracket and makes up 28.0% of all families. Conversely, the $10,000 to $14,999 income bracket is the least frequent group with only 15 families (0.5%) belonging to this category.
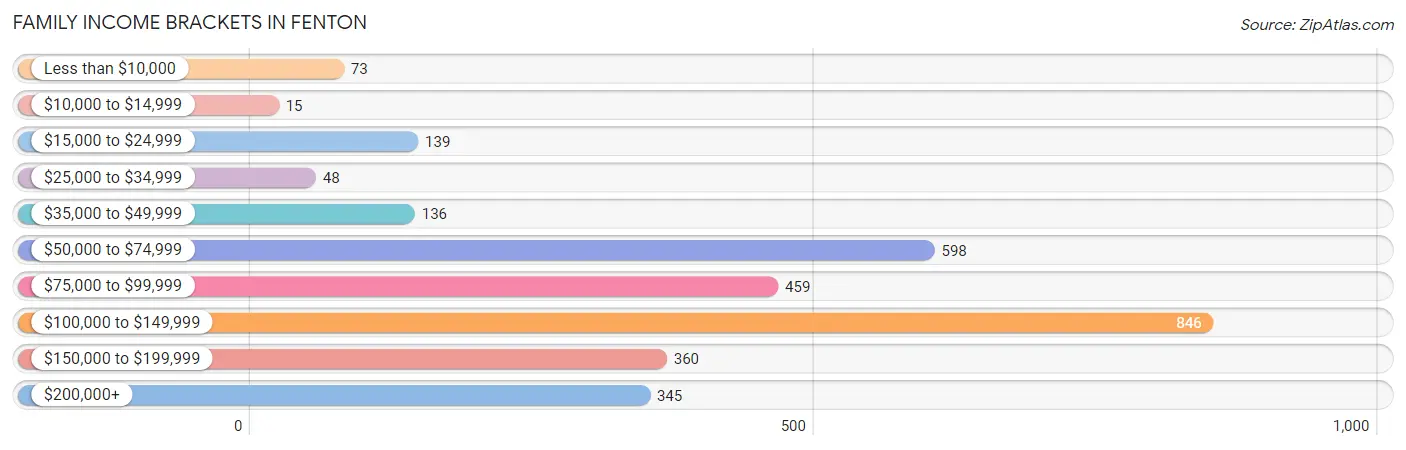
| Income Bracket | # Families | % Families |
| Less than $10,000 | 73 | 2.4% |
| $10,000 to $14,999 | 15 | 0.5% |
| $15,000 to $24,999 | 139 | 4.6% |
| $25,000 to $34,999 | 48 | 1.6% |
| $35,000 to $49,999 | 136 | 4.5% |
| $50,000 to $74,999 | 598 | 19.8% |
| $75,000 to $99,999 | 459 | 15.2% |
| $100,000 to $149,999 | 846 | 28.0% |
| $150,000 to $199,999 | 360 | 11.9% |
| $200,000+ | 345 | 11.4% |
Family Income by Famaliy Size in Fenton
4-person families (571 | 18.9%) account for the highest median family income in Fenton with $131,188 per family, while 2-person families (1,605 | 53.1%) have the highest median income of $46,426 per family member.
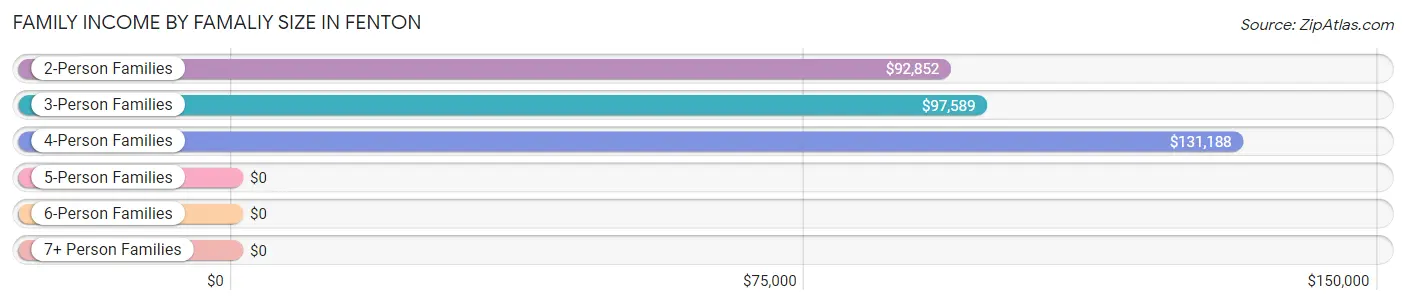
| Income Bracket | # Families | Median Income |
| 2-Person Families | 1,605 (53.1%) | $92,852 |
| 3-Person Families | 607 (20.1%) | $97,589 |
| 4-Person Families | 571 (18.9%) | $131,188 |
| 5-Person Families | 206 (6.8%) | $0 |
| 6-Person Families | 33 (1.1%) | $0 |
| 7+ Person Families | 0 (0.0%) | $0 |
| Total | 3,022 (100.0%) | $104,128 |
Family Income by Number of Earners in Fenton
The median family income in Fenton is $104,128, with families comprising 3+ earners (270) having the highest median family income of $145,333, while families with 1 earner (1,112) have the lowest median family income of $74,052, accounting for 8.9% and 36.8% of families, respectively.
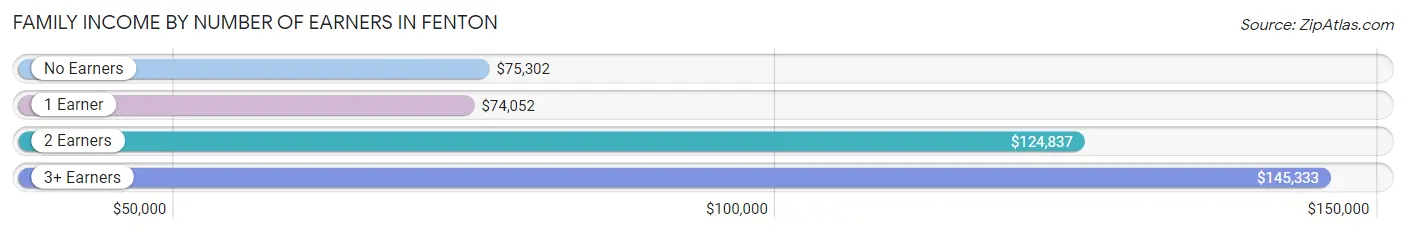
| Number of Earners | # Families | Median Income |
| No Earners | 273 (9.0%) | $75,302 |
| 1 Earner | 1,112 (36.8%) | $74,052 |
| 2 Earners | 1,367 (45.2%) | $124,837 |
| 3+ Earners | 270 (8.9%) | $145,333 |
| Total | 3,022 (100.0%) | $104,128 |
Household Income in Fenton
Household Income Brackets in Fenton
With 995 households falling in the category, the $100,000 to $149,999 income range is the most frequent in Fenton, accounting for 19.1% of all households. In contrast, only 120 households (2.3%) fall into the $10,000 to $14,999 income bracket, making it the least populous group.
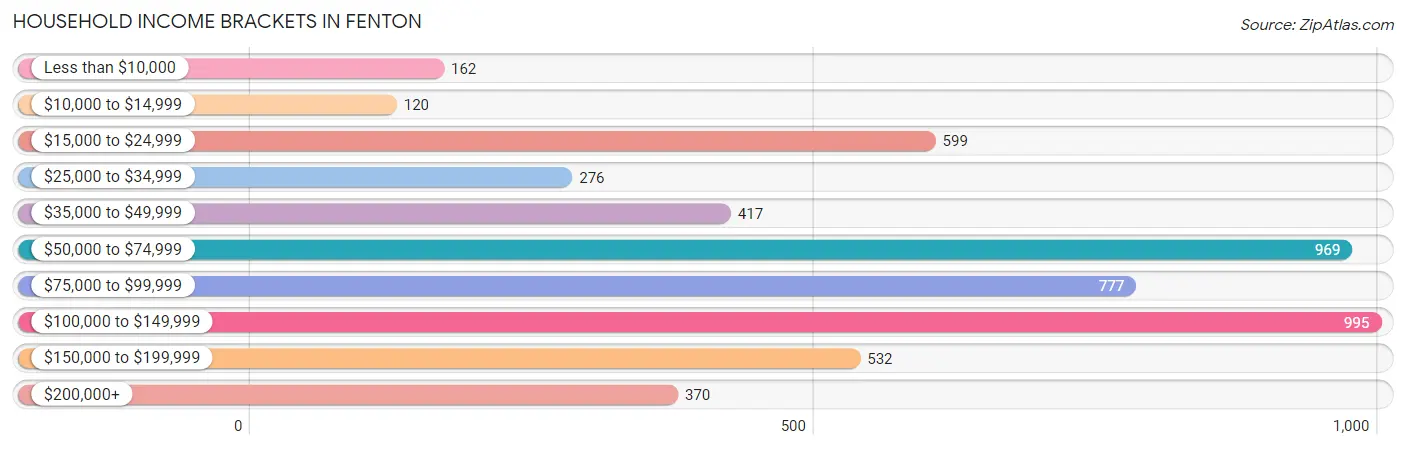
| Income Bracket | # Households | % Households |
| Less than $10,000 | 162 | 3.1% |
| $10,000 to $14,999 | 120 | 2.3% |
| $15,000 to $24,999 | 599 | 11.5% |
| $25,000 to $34,999 | 276 | 5.3% |
| $35,000 to $49,999 | 417 | 8.0% |
| $50,000 to $74,999 | 969 | 18.6% |
| $75,000 to $99,999 | 777 | 14.9% |
| $100,000 to $149,999 | 995 | 19.1% |
| $150,000 to $199,999 | 532 | 10.2% |
| $200,000+ | 370 | 7.1% |
Household Income by Householder Age in Fenton
The median household income in Fenton is $76,195, with the highest median household income of $93,962 found in the 25 to 44 years age bracket for the primary householder. A total of 1,960 households (37.6%) fall into this category. Meanwhile, the 15 to 24 years age bracket for the primary householder has the lowest median household income of $0, with 189 households (3.6%) in this group.
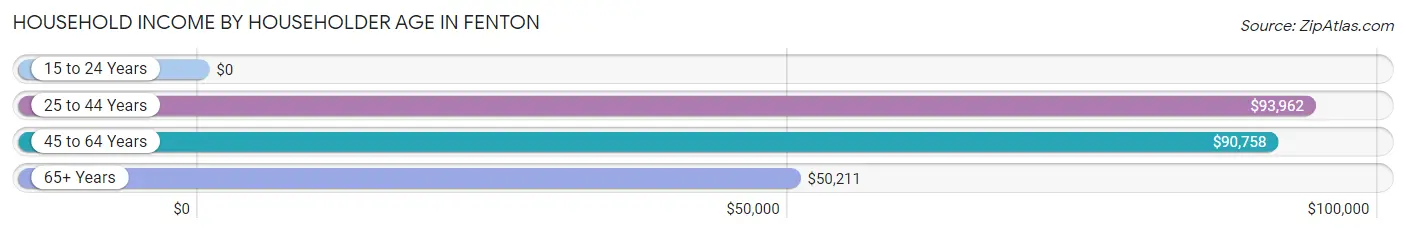
| Income Bracket | # Households | Median Income |
| 15 to 24 Years | 189 (3.6%) | $0 |
| 25 to 44 Years | 1,960 (37.6%) | $93,962 |
| 45 to 64 Years | 1,715 (32.9%) | $90,758 |
| 65+ Years | 1,348 (25.9%) | $50,211 |
| Total | 5,212 (100.0%) | $76,195 |
Poverty in Fenton
Income Below Poverty by Sex and Age in Fenton
With 11.2% poverty level for males and 10.0% for females among the residents of Fenton, 16 and 17 year old males and 5 year old females are the most vulnerable to poverty, with 49 males (80.3%) and 63 females (37.7%) in their respective age groups living below the poverty level.
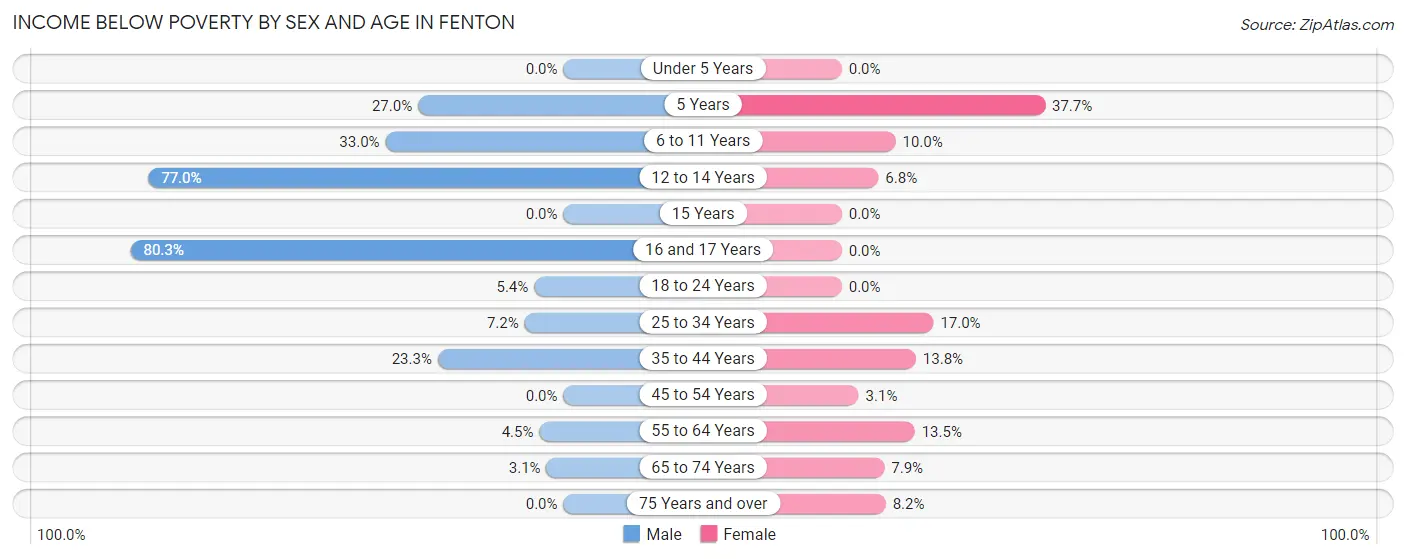
| Age Bracket | Male | Female |
| Under 5 Years | 0 (0.0%) | 0 (0.0%) |
| 5 Years | 17 (27.0%) | 63 (37.7%) |
| 6 to 11 Years | 109 (33.0%) | 53 (10.0%) |
| 12 to 14 Years | 114 (77.0%) | 14 (6.8%) |
| 15 Years | 0 (0.0%) | 0 (0.0%) |
| 16 and 17 Years | 49 (80.3%) | 0 (0.0%) |
| 18 to 24 Years | 21 (5.4%) | 0 (0.0%) |
| 25 to 34 Years | 76 (7.2%) | 191 (17.0%) |
| 35 to 44 Years | 149 (23.3%) | 130 (13.8%) |
| 45 to 54 Years | 0 (0.0%) | 22 (3.1%) |
| 55 to 64 Years | 28 (4.5%) | 85 (13.5%) |
| 65 to 74 Years | 16 (3.1%) | 50 (7.9%) |
| 75 Years and over | 0 (0.0%) | 44 (8.2%) |
| Total | 579 (11.2%) | 652 (10.0%) |
Income Above Poverty by Sex and Age in Fenton
According to the poverty statistics in Fenton, males aged under 5 years and females aged under 5 years are the age groups that are most secure financially, with 100.0% of males and 100.0% of females in these age groups living above the poverty line.
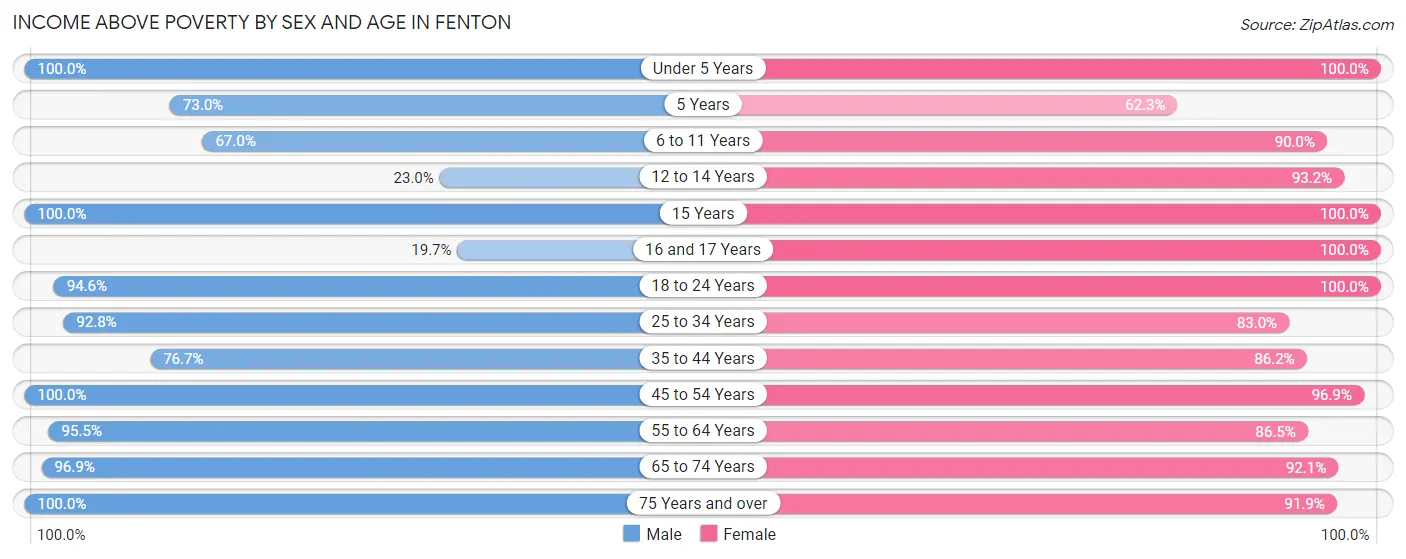
| Age Bracket | Male | Female |
| Under 5 Years | 345 (100.0%) | 226 (100.0%) |
| 5 Years | 46 (73.0%) | 104 (62.3%) |
| 6 to 11 Years | 221 (67.0%) | 478 (90.0%) |
| 12 to 14 Years | 34 (23.0%) | 192 (93.2%) |
| 15 Years | 80 (100.0%) | 49 (100.0%) |
| 16 and 17 Years | 12 (19.7%) | 294 (100.0%) |
| 18 to 24 Years | 366 (94.6%) | 467 (100.0%) |
| 25 to 34 Years | 978 (92.8%) | 932 (83.0%) |
| 35 to 44 Years | 490 (76.7%) | 815 (86.2%) |
| 45 to 54 Years | 792 (100.0%) | 680 (96.9%) |
| 55 to 64 Years | 600 (95.5%) | 543 (86.5%) |
| 65 to 74 Years | 494 (96.9%) | 583 (92.1%) |
| 75 Years and over | 152 (100.0%) | 496 (91.8%) |
| Total | 4,610 (88.8%) | 5,859 (90.0%) |
Income Below Poverty Among Married-Couple Families in Fenton
The poverty statistics for married-couple families in Fenton show that 3.9% or 83 of the total 2,119 families live below the poverty line. Families with 3 or 4 children have the highest poverty rate of 31.4%, comprising of 58 families. On the other hand, families with 1 or 2 children have the lowest poverty rate of 0.0%, which includes 0 families.
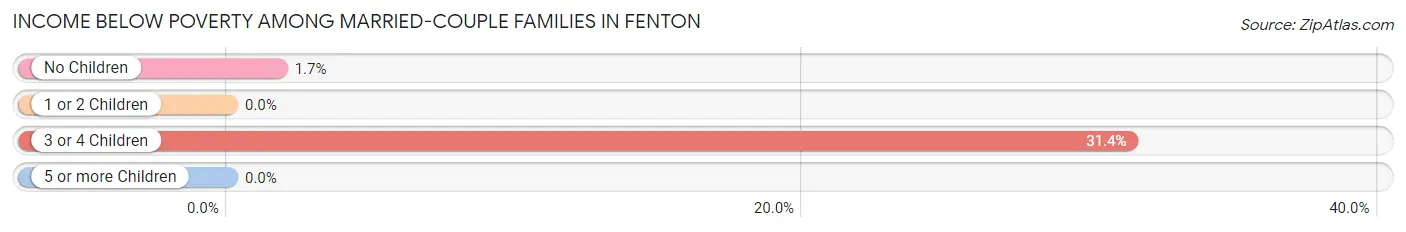
| Children | Above Poverty | Below Poverty |
| No Children | 1,422 (98.3%) | 25 (1.7%) |
| 1 or 2 Children | 487 (100.0%) | 0 (0.0%) |
| 3 or 4 Children | 127 (68.6%) | 58 (31.4%) |
| 5 or more Children | 0 (0.0%) | 0 (0.0%) |
| Total | 2,036 (96.1%) | 83 (3.9%) |
Income Below Poverty Among Single-Parent Households in Fenton
According to the poverty data in Fenton, 14.8% or 54 single-father households and 17.1% or 92 single-mother households are living below the poverty line. Among single-father households, those with 1 or 2 children have the highest poverty rate, with 54 households (27.6%) experiencing poverty. Likewise, among single-mother households, those with 3 or 4 children have the highest poverty rate, with 32 households (43.8%) falling below the poverty line.
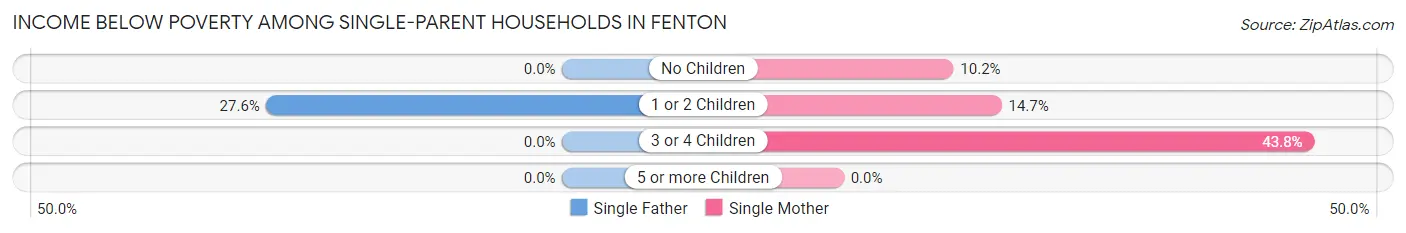
| Children | Single Father | Single Mother |
| No Children | 0 (0.0%) | 19 (10.2%) |
| 1 or 2 Children | 54 (27.6%) | 41 (14.7%) |
| 3 or 4 Children | 0 (0.0%) | 32 (43.8%) |
| 5 or more Children | 0 (0.0%) | 0 (0.0%) |
| Total | 54 (14.8%) | 92 (17.1%) |
Income Below Poverty Among Married-Couple vs Single-Parent Households in Fenton
The poverty data for Fenton shows that 83 of the married-couple family households (3.9%) and 146 of the single-parent households (16.2%) are living below the poverty level. Within the married-couple family households, those with 3 or 4 children have the highest poverty rate, with 58 households (31.4%) falling below the poverty line. Among the single-parent households, those with 1 or 2 children have the highest poverty rate, with 95 household (20.0%) living below poverty.
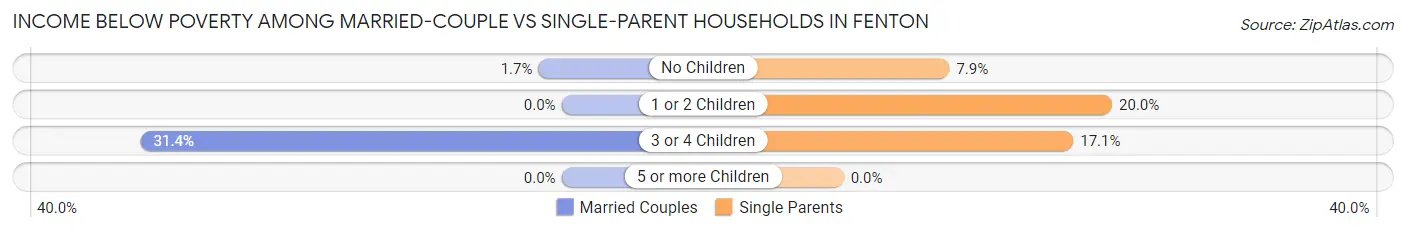
| Children | Married-Couple Families | Single-Parent Households |
| No Children | 25 (1.7%) | 19 (7.9%) |
| 1 or 2 Children | 0 (0.0%) | 95 (20.0%) |
| 3 or 4 Children | 58 (31.4%) | 32 (17.1%) |
| 5 or more Children | 0 (0.0%) | 0 (0.0%) |
| Total | 83 (3.9%) | 146 (16.2%) |
Race in Fenton
The most populous races in Fenton are White / Caucasian (11,058 | 92.4%), Hispanic or Latino (570 | 4.8%), and Two or more Races (440 | 3.7%).
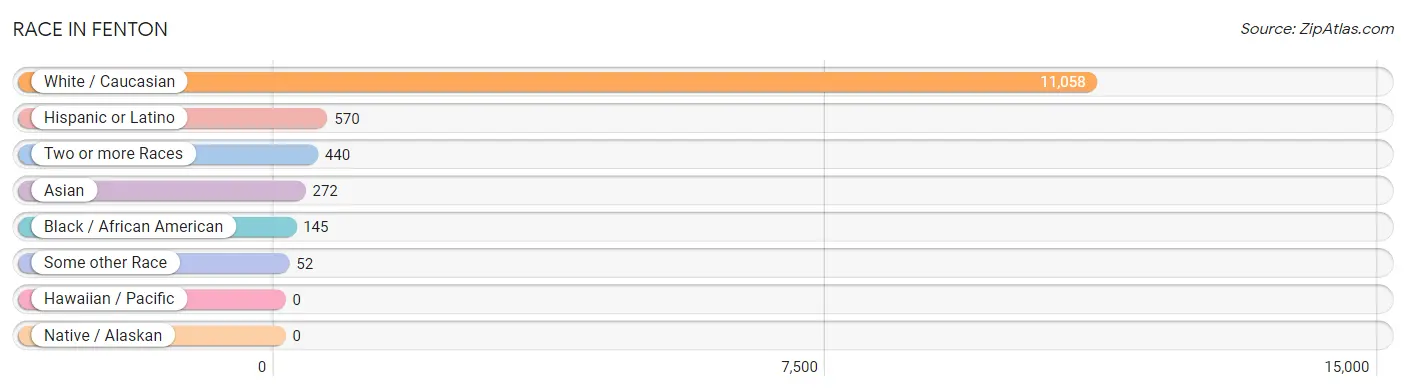
| Race | # Population | % Population |
| Asian | 272 | 2.3% |
| Black / African American | 145 | 1.2% |
| Hawaiian / Pacific | 0 | 0.0% |
| Hispanic or Latino | 570 | 4.8% |
| Native / Alaskan | 0 | 0.0% |
| White / Caucasian | 11,058 | 92.4% |
| Two or more Races | 440 | 3.7% |
| Some other Race | 52 | 0.4% |
| Total | 11,967 | 100.0% |
Ancestry in Fenton
The most populous ancestries reported in Fenton are German (2,338 | 19.5%), Irish (2,019 | 16.9%), English (1,614 | 13.5%), Polish (1,079 | 9.0%), and American (759 | 6.3%), together accounting for 65.3% of all Fenton residents.
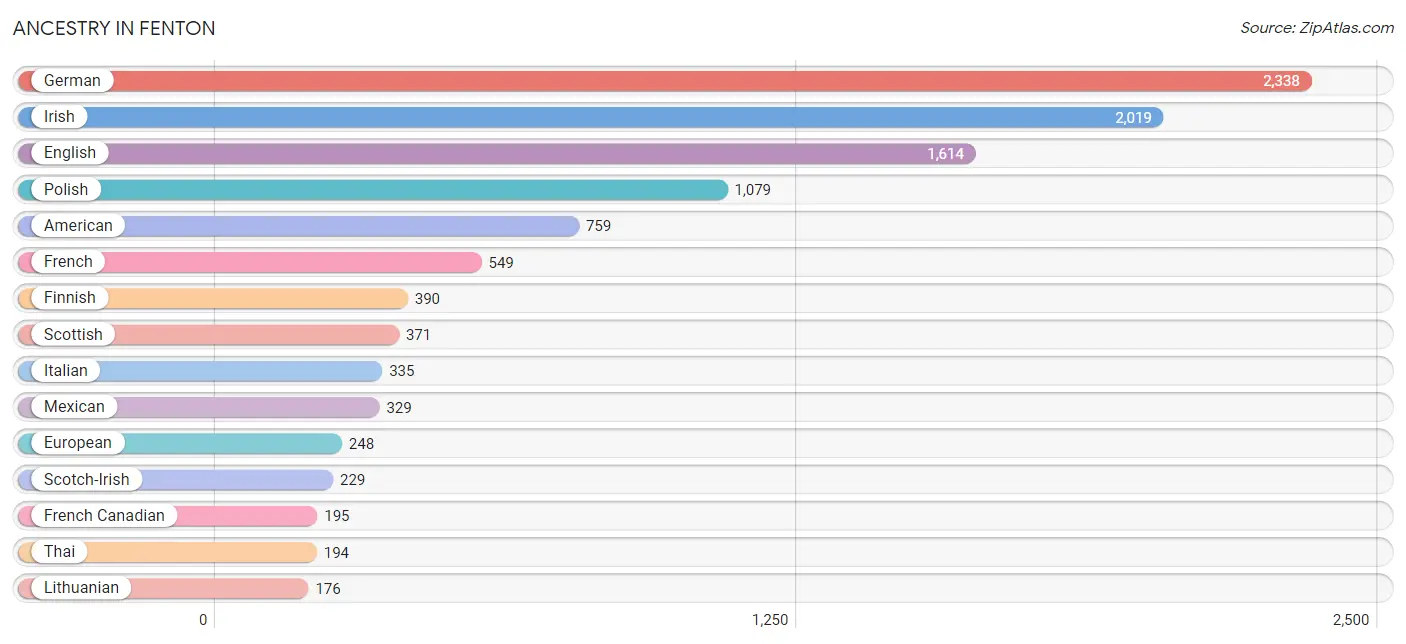
| Ancestry | # Population | % Population |
| African | 40 | 0.3% |
| American | 759 | 6.3% |
| Arab | 96 | 0.8% |
| Armenian | 12 | 0.1% |
| Belgian | 41 | 0.3% |
| Bhutanese | 45 | 0.4% |
| British | 42 | 0.4% |
| Burmese | 67 | 0.6% |
| Canadian | 28 | 0.2% |
| Carpatho Rusyn | 8 | 0.1% |
| Central American | 41 | 0.3% |
| Cherokee | 45 | 0.4% |
| Chippewa | 16 | 0.1% |
| Czech | 25 | 0.2% |
| Danish | 50 | 0.4% |
| Dominican | 68 | 0.6% |
| Dutch | 91 | 0.8% |
| Ecuadorian | 52 | 0.4% |
| English | 1,614 | 13.5% |
| European | 248 | 2.1% |
| Finnish | 390 | 3.3% |
| French | 549 | 4.6% |
| French American Indian | 6 | 0.1% |
| French Canadian | 195 | 1.6% |
| German | 2,338 | 19.5% |
| Greek | 74 | 0.6% |
| Hungarian | 141 | 1.2% |
| Indian (Asian) | 37 | 0.3% |
| Irish | 2,019 | 16.9% |
| Italian | 335 | 2.8% |
| Lebanese | 44 | 0.4% |
| Lithuanian | 176 | 1.5% |
| Macedonian | 16 | 0.1% |
| Mexican | 329 | 2.8% |
| Northern European | 7 | 0.1% |
| Norwegian | 143 | 1.2% |
| Polish | 1,079 | 9.0% |
| Russian | 64 | 0.5% |
| Salvadoran | 41 | 0.3% |
| Scandinavian | 55 | 0.5% |
| Scotch-Irish | 229 | 1.9% |
| Scottish | 371 | 3.1% |
| South American | 52 | 0.4% |
| Spanish | 64 | 0.5% |
| Subsaharan African | 40 | 0.3% |
| Swedish | 121 | 1.0% |
| Swiss | 22 | 0.2% |
| Thai | 194 | 1.6% |
| Ukrainian | 52 | 0.4% |
| Welsh | 85 | 0.7% | View All 50 Rows |
Immigrants in Fenton
The most numerous immigrant groups reported in Fenton came from Asia (272 | 2.3%), India (194 | 1.6%), South Central Asia (194 | 1.6%), Eastern Asia (78 | 0.6%), and Latin America (74 | 0.6%), together accounting for 6.8% of all Fenton residents.
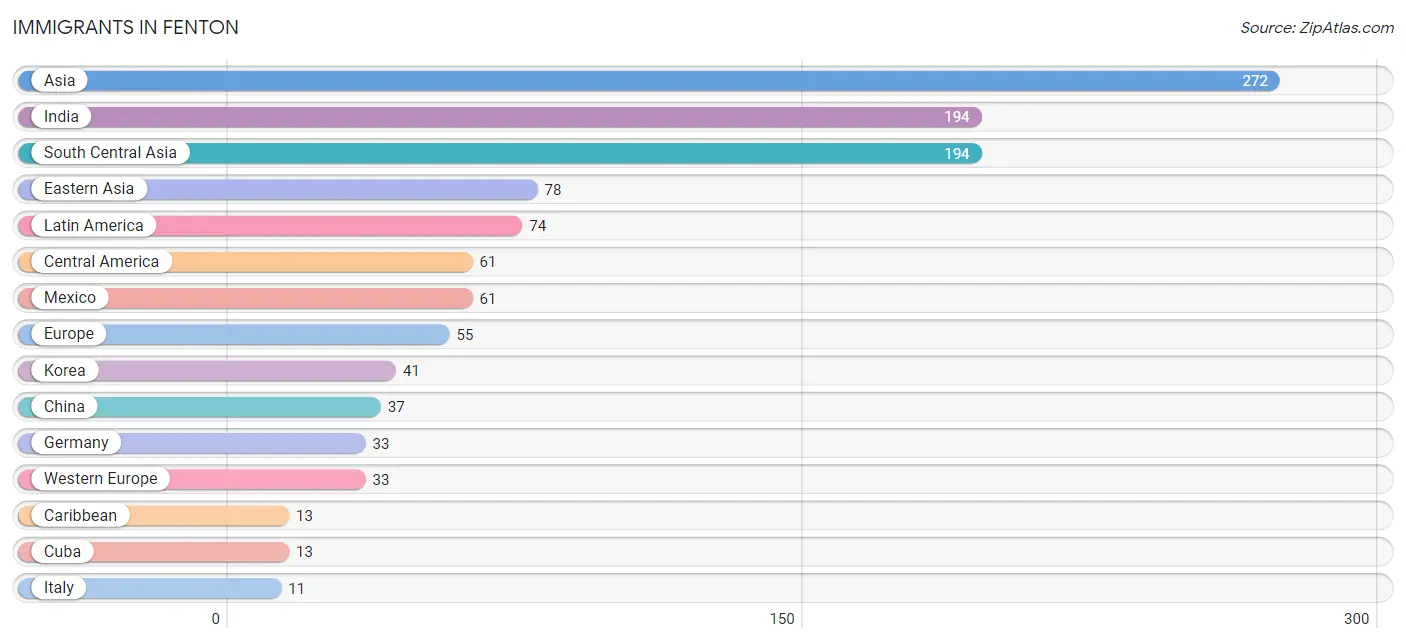
| Immigration Origin | # Population | % Population |
| Asia | 272 | 2.3% |
| Caribbean | 13 | 0.1% |
| Central America | 61 | 0.5% |
| China | 37 | 0.3% |
| Cuba | 13 | 0.1% |
| Eastern Asia | 78 | 0.6% |
| Europe | 55 | 0.5% |
| Germany | 33 | 0.3% |
| India | 194 | 1.6% |
| Italy | 11 | 0.1% |
| Korea | 41 | 0.3% |
| Latin America | 74 | 0.6% |
| Mexico | 61 | 0.5% |
| Northern Europe | 11 | 0.1% |
| Scotland | 11 | 0.1% |
| South Central Asia | 194 | 1.6% |
| Southern Europe | 11 | 0.1% |
| Western Europe | 33 | 0.3% | View All 18 Rows |
Sex and Age in Fenton
Sex and Age in Fenton
The most populous age groups in Fenton are 25 to 29 Years (565 | 10.5%) for men and 35 to 39 Years (606 | 9.2%) for women.
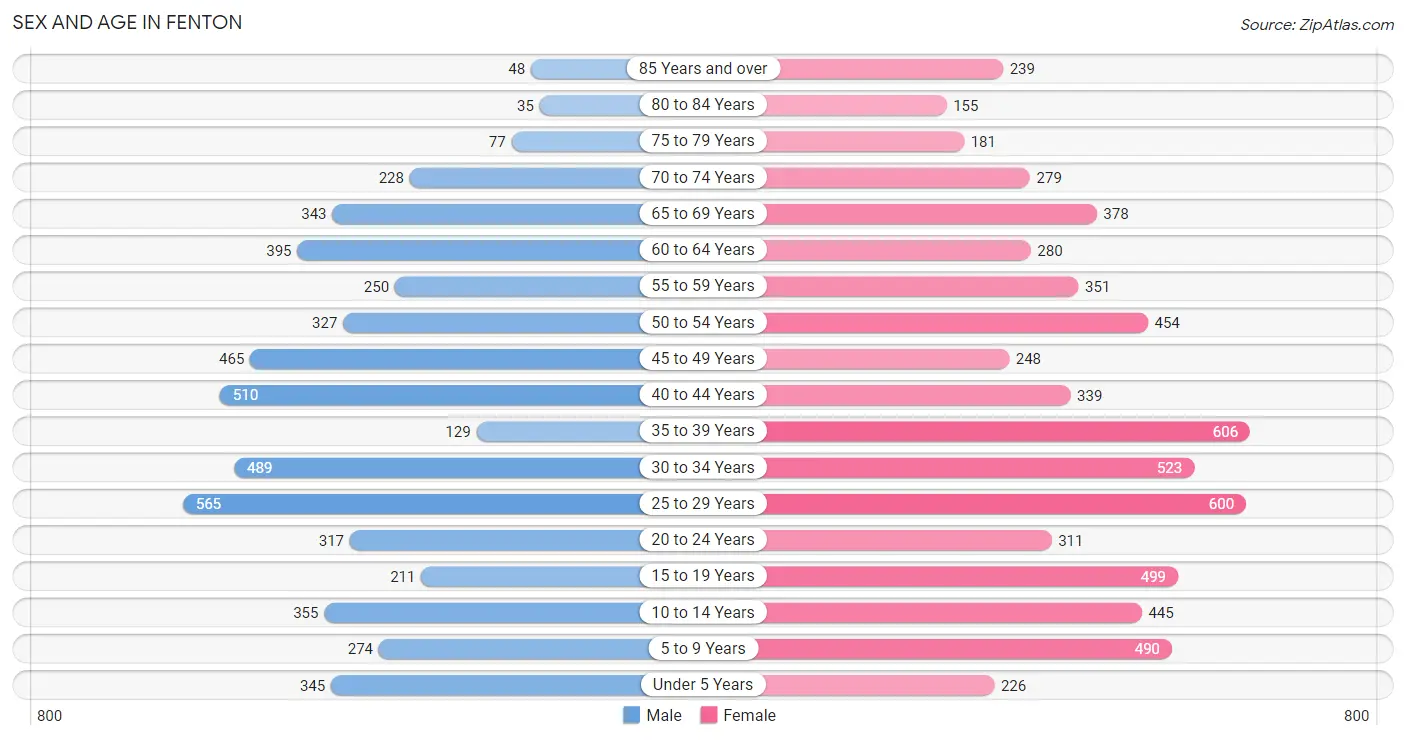
| Age Bracket | Male | Female |
| Under 5 Years | 345 (6.4%) | 226 (3.4%) |
| 5 to 9 Years | 274 (5.1%) | 490 (7.4%) |
| 10 to 14 Years | 355 (6.6%) | 445 (6.7%) |
| 15 to 19 Years | 211 (3.9%) | 499 (7.6%) |
| 20 to 24 Years | 317 (5.9%) | 311 (4.7%) |
| 25 to 29 Years | 565 (10.5%) | 600 (9.1%) |
| 30 to 34 Years | 489 (9.1%) | 523 (7.9%) |
| 35 to 39 Years | 129 (2.4%) | 606 (9.2%) |
| 40 to 44 Years | 510 (9.5%) | 339 (5.1%) |
| 45 to 49 Years | 465 (8.7%) | 248 (3.8%) |
| 50 to 54 Years | 327 (6.1%) | 454 (6.9%) |
| 55 to 59 Years | 250 (4.7%) | 351 (5.3%) |
| 60 to 64 Years | 395 (7.4%) | 280 (4.2%) |
| 65 to 69 Years | 343 (6.4%) | 378 (5.7%) |
| 70 to 74 Years | 228 (4.3%) | 279 (4.2%) |
| 75 to 79 Years | 77 (1.4%) | 181 (2.7%) |
| 80 to 84 Years | 35 (0.6%) | 155 (2.4%) |
| 85 Years and over | 48 (0.9%) | 239 (3.6%) |
| Total | 5,363 (100.0%) | 6,604 (100.0%) |
Families and Households in Fenton
Median Family Size in Fenton
The median family size in Fenton is 2.92 persons per family, with single female/mother families (538 | 17.8%) accounting for the largest median family size of 3.09 persons per family. On the other hand, married-couple families (2,119 | 70.1%) represent the smallest median family size with 2.87 persons per family.
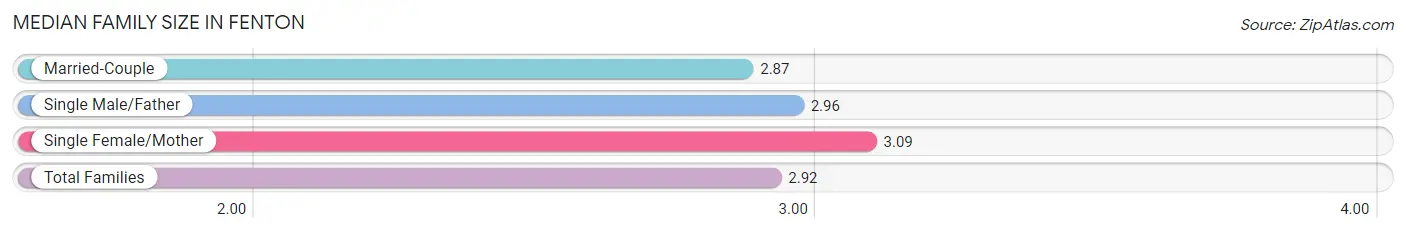
| Family Type | # Families | Family Size |
| Married-Couple | 2,119 (70.1%) | 2.87 |
| Single Male/Father | 365 (12.1%) | 2.96 |
| Single Female/Mother | 538 (17.8%) | 3.09 |
| Total Families | 3,022 (100.0%) | 2.92 |
Median Household Size in Fenton
The median household size in Fenton is 2.26 persons per household, with single male/father households (365 | 7.0%) accounting for the largest median household size of 3.78 persons per household. non-family households (2,190 | 42.0%) represent the smallest median household size with 1.11 persons per household.
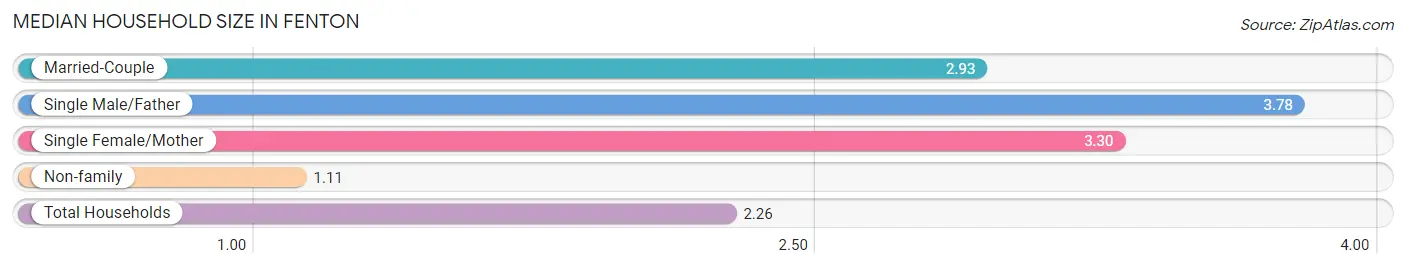
| Household Type | # Households | Household Size |
| Married-Couple | 2,119 (40.7%) | 2.93 |
| Single Male/Father | 365 (7.0%) | 3.78 |
| Single Female/Mother | 538 (10.3%) | 3.30 |
| Non-family | 2,190 (42.0%) | 1.11 |
| Total Households | 5,212 (100.0%) | 2.26 |
Household Size by Marriage Status in Fenton
Out of a total of 5,212 households in Fenton, 3,022 (58.0%) are family households, while 2,190 (42.0%) are nonfamily households. The most numerous type of family households are 2-person households, comprising 1,466, and the most common type of nonfamily households are 1-person households, comprising 1,899.
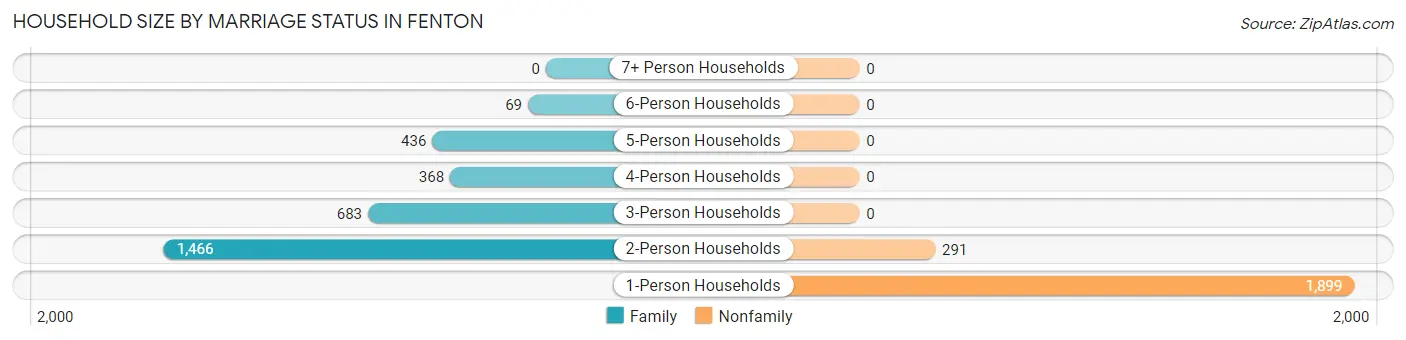
| Household Size | Family Households | Nonfamily Households |
| 1-Person Households | - | 1,899 (36.4%) |
| 2-Person Households | 1,466 (28.1%) | 291 (5.6%) |
| 3-Person Households | 683 (13.1%) | 0 (0.0%) |
| 4-Person Households | 368 (7.1%) | 0 (0.0%) |
| 5-Person Households | 436 (8.4%) | 0 (0.0%) |
| 6-Person Households | 69 (1.3%) | 0 (0.0%) |
| 7+ Person Households | 0 (0.0%) | 0 (0.0%) |
| Total | 3,022 (58.0%) | 2,190 (42.0%) |
Female Fertility in Fenton
Fertility by Age in Fenton
Average fertility rate in Fenton is 58.0 births per 1,000 women. Women in the age bracket of 20 to 34 years have the highest fertility rate with 120.0 births per 1,000 women. Women in the age bracket of 20 to 34 years acount for 93.5% of all women with births.
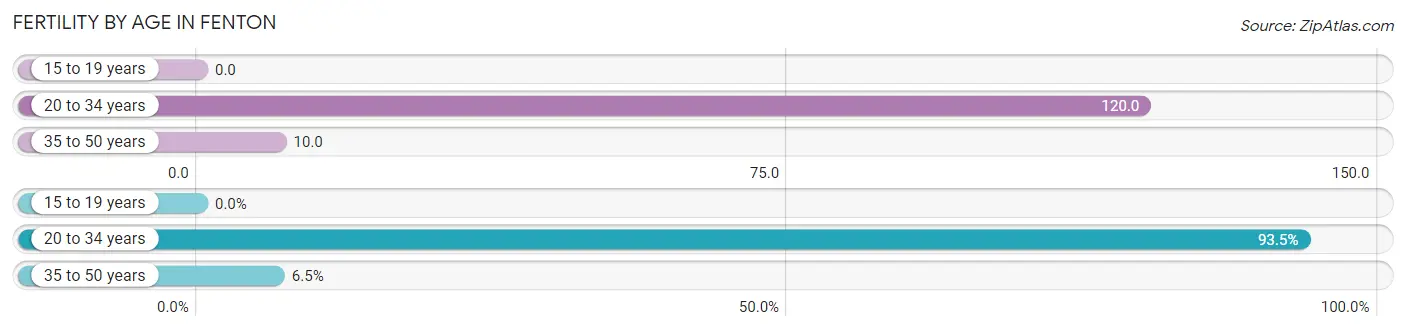
| Age Bracket | Women with Births | Births / 1,000 Women |
| 15 to 19 years | 0 (0.0%) | 0.0 |
| 20 to 34 years | 172 (93.5%) | 120.0 |
| 35 to 50 years | 12 (6.5%) | 10.0 |
| Total | 184 (100.0%) | 58.0 |
Fertility by Age by Marriage Status in Fenton
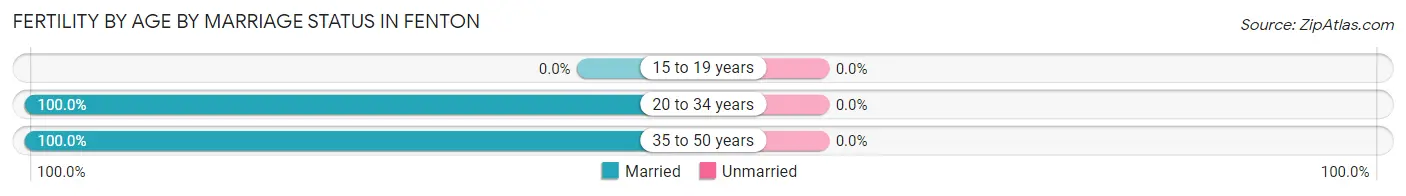
| Age Bracket | Married | Unmarried |
| 15 to 19 years | 0 (0.0%) | 0 (0.0%) |
| 20 to 34 years | 172 (100.0%) | 0 (0.0%) |
| 35 to 50 years | 12 (100.0%) | 0 (0.0%) |
| Total | 184 (100.0%) | 0 (0.0%) |
Fertility by Education in Fenton
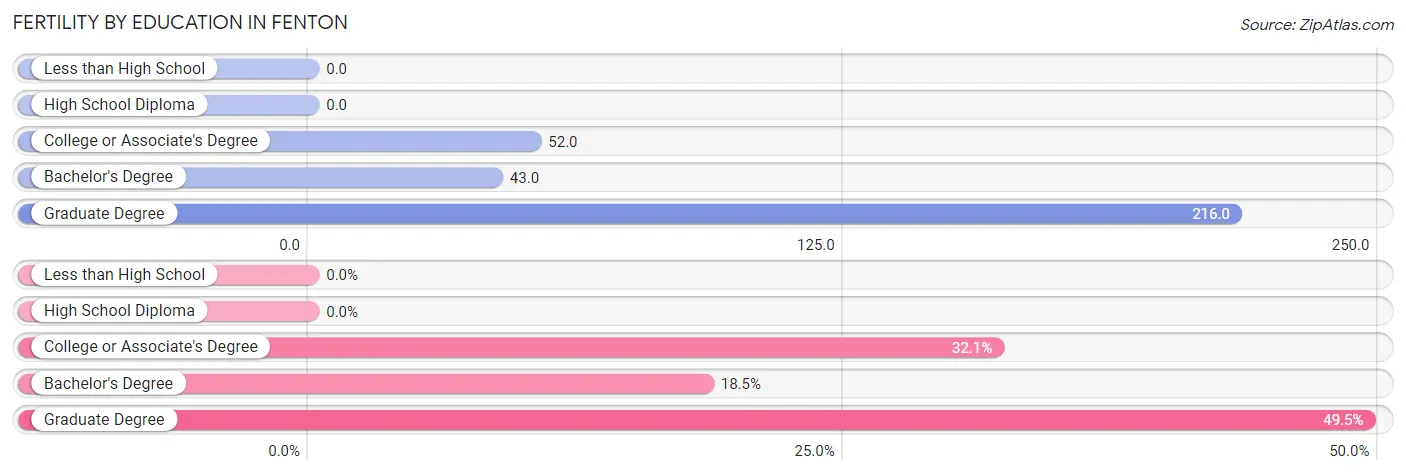
| Educational Attainment | Women with Births | Births / 1,000 Women |
| Less than High School | 0 (0.0%) | 0.0 |
| High School Diploma | 0 (0.0%) | 0.0 |
| College or Associate's Degree | 59 (32.1%) | 52.0 |
| Bachelor's Degree | 34 (18.5%) | 43.0 |
| Graduate Degree | 91 (49.5%) | 216.0 |
| Total | 184 (100.0%) | 58.0 |
Fertility by Education by Marriage Status in Fenton
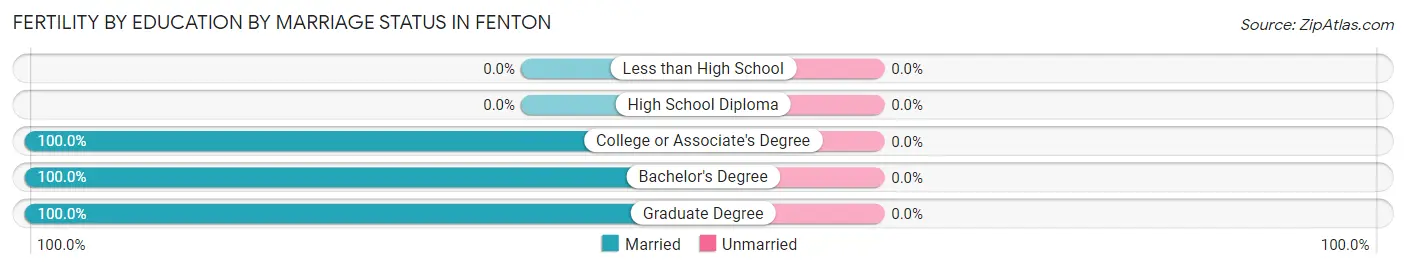
| Educational Attainment | Married | Unmarried |
| Less than High School | 0 (0.0%) | 0 (0.0%) |
| High School Diploma | 0 (0.0%) | 0 (0.0%) |
| College or Associate's Degree | 59 (100.0%) | 0 (0.0%) |
| Bachelor's Degree | 34 (100.0%) | 0 (0.0%) |
| Graduate Degree | 91 (100.0%) | 0 (0.0%) |
| Total | 184 (100.0%) | 0 (0.0%) |
Employment Characteristics in Fenton
Employment by Class of Employer in Fenton
Among the 6,202 employed individuals in Fenton, private company employees (4,291 | 69.2%), not-for-profit organizations (874 | 14.1%), and self-employed (not incorporated) (444 | 7.2%) make up the most common classes of employment.
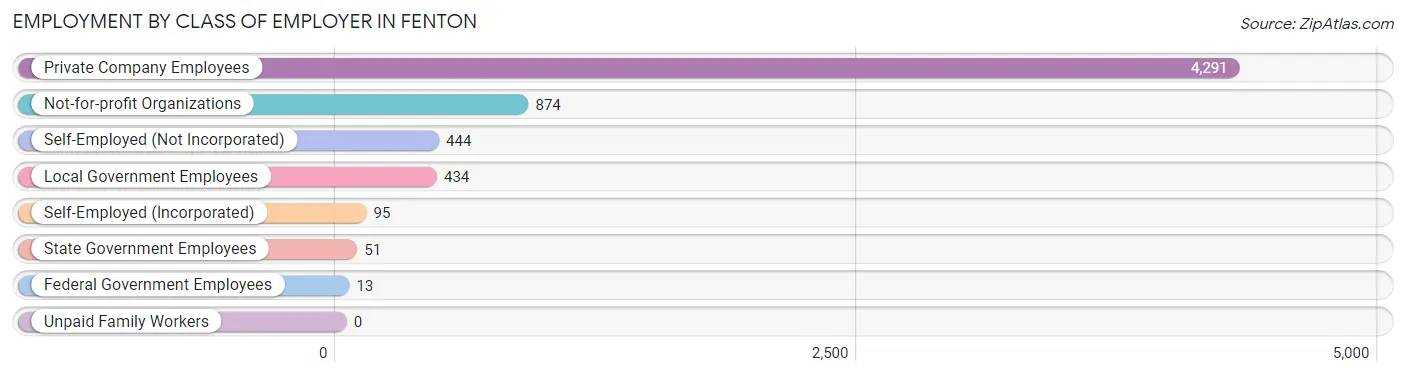
| Employer Class | # Employees | % Employees |
| Private Company Employees | 4,291 | 69.2% |
| Self-Employed (Incorporated) | 95 | 1.5% |
| Self-Employed (Not Incorporated) | 444 | 7.2% |
| Not-for-profit Organizations | 874 | 14.1% |
| Local Government Employees | 434 | 7.0% |
| State Government Employees | 51 | 0.8% |
| Federal Government Employees | 13 | 0.2% |
| Unpaid Family Workers | 0 | 0.0% |
| Total | 6,202 | 100.0% |
Employment Status by Age in Fenton
According to the labor force statistics for Fenton, out of the total population over 16 years of age (9,703), 67.7% or 6,569 individuals are in the labor force, with 4.7% or 309 of them unemployed. The age group with the highest labor force participation rate is 30 to 34 years, with 92.7% or 938 individuals in the labor force. Within the labor force, the 16 to 19 years age range has the highest percentage of unemployed individuals, with 44.0% or 114 of them being unemployed.
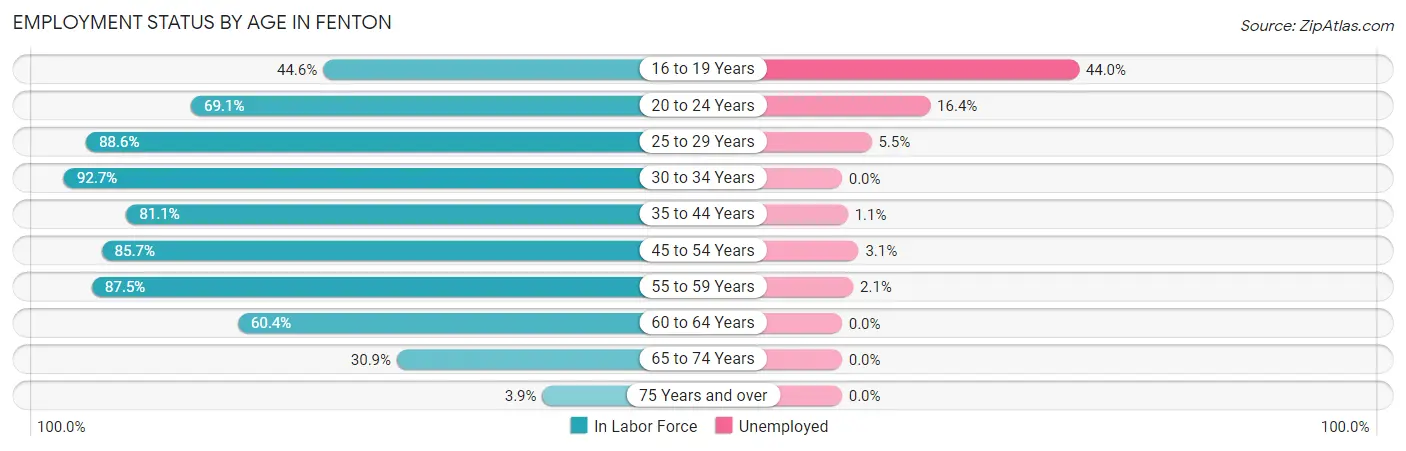
| Age Bracket | In Labor Force | Unemployed |
| 16 to 19 Years | 259 (44.6%) | 114 (44.0%) |
| 20 to 24 Years | 434 (69.1%) | 71 (16.4%) |
| 25 to 29 Years | 1,032 (88.6%) | 57 (5.5%) |
| 30 to 34 Years | 938 (92.7%) | 0 (0.0%) |
| 35 to 44 Years | 1,285 (81.1%) | 14 (1.1%) |
| 45 to 54 Years | 1,280 (85.7%) | 40 (3.1%) |
| 55 to 59 Years | 526 (87.5%) | 11 (2.1%) |
| 60 to 64 Years | 408 (60.4%) | 0 (0.0%) |
| 65 to 74 Years | 379 (30.9%) | 0 (0.0%) |
| 75 Years and over | 29 (3.9%) | 0 (0.0%) |
| Total | 6,569 (67.7%) | 309 (4.7%) |
Employment Status by Educational Attainment in Fenton
According to labor force statistics for Fenton, 83.7% of individuals (5,466) out of the total population between 25 and 64 years of age (6,531) are in the labor force, with 2.2% or 120 of them being unemployed. The group with the highest labor force participation rate are those with the educational attainment of bachelor's degree or higher, with 93.1% or 2,377 individuals in the labor force. Within the labor force, individuals with bachelor's degree or higher education have the highest percentage of unemployment, with 4.0% or 95 of them being unemployed.
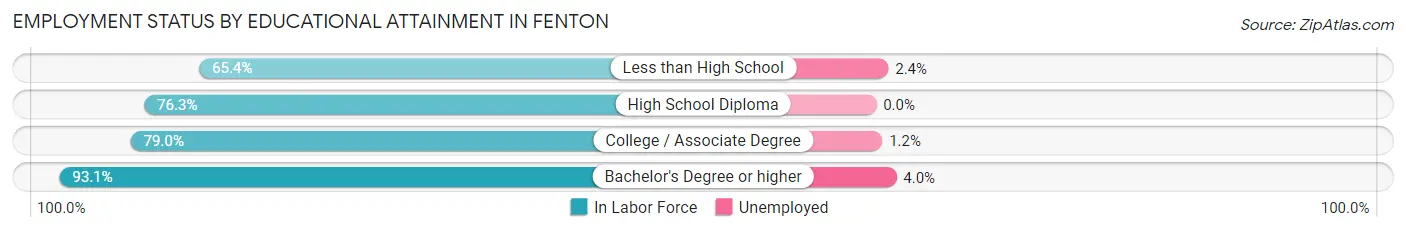
| Educational Attainment | In Labor Force | Unemployed |
| Less than High School | 85 (65.4%) | 3 (2.4%) |
| High School Diploma | 931 (76.3%) | 0 (0.0%) |
| College / Associate Degree | 2,076 (79.0%) | 32 (1.2%) |
| Bachelor's Degree or higher | 2,377 (93.1%) | 102 (4.0%) |
| Total | 5,466 (83.7%) | 144 (2.2%) |
Employment Occupations by Sex in Fenton
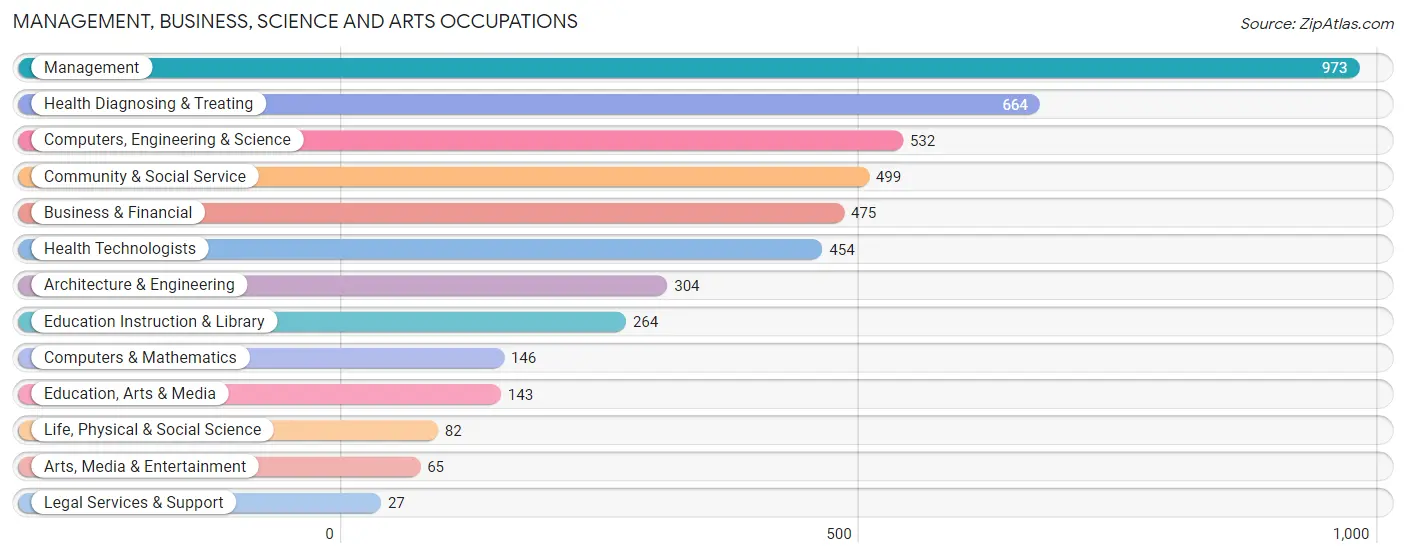
Management, Business, Science and Arts Occupations
The most common Management, Business, Science and Arts occupations in Fenton are Management (973 | 15.5%), Health Diagnosing & Treating (664 | 10.6%), Computers, Engineering & Science (532 | 8.5%), Community & Social Service (499 | 8.0%), and Business & Financial (475 | 7.6%).
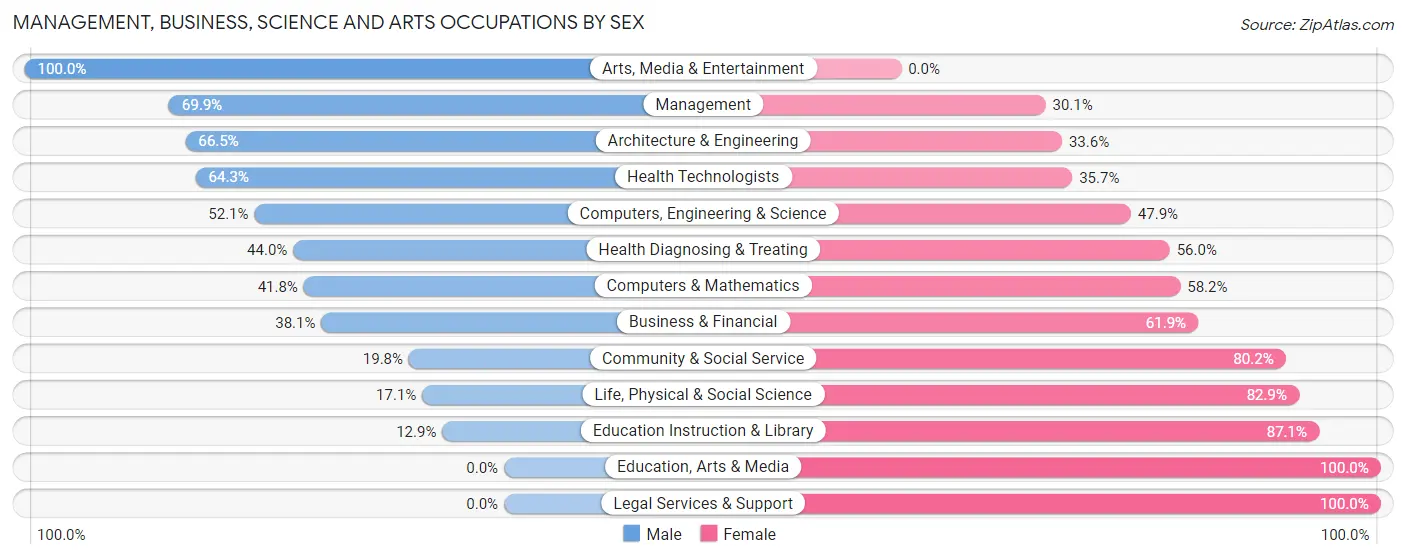
Management, Business, Science and Arts Occupations by Sex
Within the Management, Business, Science and Arts occupations in Fenton, the most male-oriented occupations are Arts, Media & Entertainment (100.0%), Management (69.9%), and Architecture & Engineering (66.4%), while the most female-oriented occupations are Education, Arts & Media (100.0%), Legal Services & Support (100.0%), and Education Instruction & Library (87.1%).
| Occupation | Male | Female |
| Management | 680 (69.9%) | 293 (30.1%) |
| Business & Financial | 181 (38.1%) | 294 (61.9%) |
| Computers, Engineering & Science | 277 (52.1%) | 255 (47.9%) |
| Computers & Mathematics | 61 (41.8%) | 85 (58.2%) |
| Architecture & Engineering | 202 (66.4%) | 102 (33.6%) |
| Life, Physical & Social Science | 14 (17.1%) | 68 (82.9%) |
| Community & Social Service | 99 (19.8%) | 400 (80.2%) |
| Education, Arts & Media | 0 (0.0%) | 143 (100.0%) |
| Legal Services & Support | 0 (0.0%) | 27 (100.0%) |
| Education Instruction & Library | 34 (12.9%) | 230 (87.1%) |
| Arts, Media & Entertainment | 65 (100.0%) | 0 (0.0%) |
| Health Diagnosing & Treating | 292 (44.0%) | 372 (56.0%) |
| Health Technologists | 292 (64.3%) | 162 (35.7%) |
| Total (Category) | 1,529 (48.6%) | 1,614 (51.3%) |
| Total (Overall) | 3,178 (50.7%) | 3,084 (49.2%) |
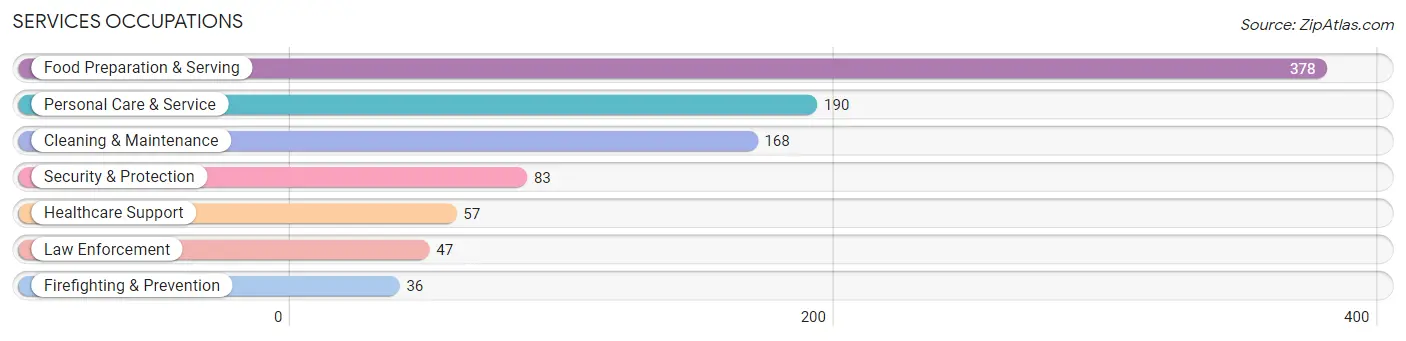
Services Occupations
The most common Services occupations in Fenton are Food Preparation & Serving (378 | 6.0%), Personal Care & Service (190 | 3.0%), Cleaning & Maintenance (168 | 2.7%), Security & Protection (83 | 1.3%), and Healthcare Support (57 | 0.9%).
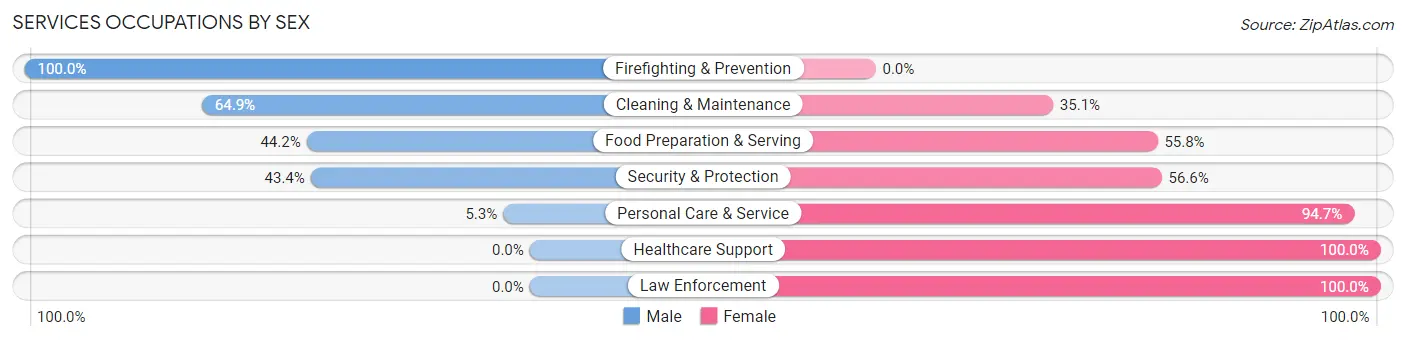
Services Occupations by Sex
Within the Services occupations in Fenton, the most male-oriented occupations are Firefighting & Prevention (100.0%), Cleaning & Maintenance (64.9%), and Food Preparation & Serving (44.2%), while the most female-oriented occupations are Healthcare Support (100.0%), Law Enforcement (100.0%), and Personal Care & Service (94.7%).
| Occupation | Male | Female |
| Healthcare Support | 0 (0.0%) | 57 (100.0%) |
| Security & Protection | 36 (43.4%) | 47 (56.6%) |
| Firefighting & Prevention | 36 (100.0%) | 0 (0.0%) |
| Law Enforcement | 0 (0.0%) | 47 (100.0%) |
| Food Preparation & Serving | 167 (44.2%) | 211 (55.8%) |
| Cleaning & Maintenance | 109 (64.9%) | 59 (35.1%) |
| Personal Care & Service | 10 (5.3%) | 180 (94.7%) |
| Total (Category) | 322 (36.8%) | 554 (63.2%) |
| Total (Overall) | 3,178 (50.7%) | 3,084 (49.2%) |
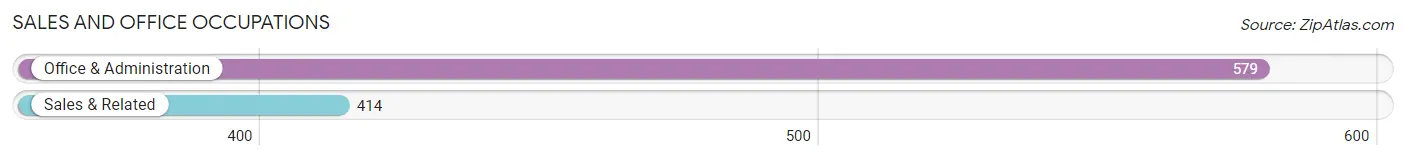
Sales and Office Occupations
The most common Sales and Office occupations in Fenton are Office & Administration (579 | 9.2%), and Sales & Related (414 | 6.6%).
Sales and Office Occupations by Sex
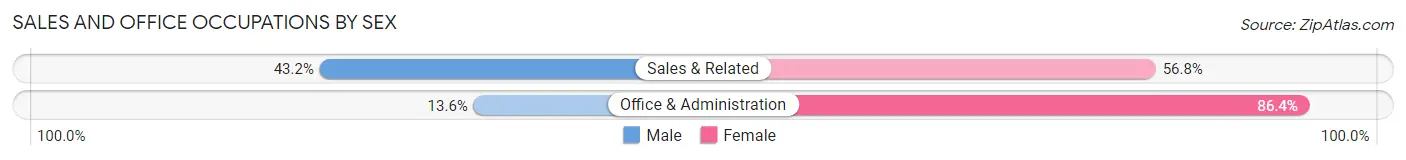
| Occupation | Male | Female |
| Sales & Related | 179 (43.2%) | 235 (56.8%) |
| Office & Administration | 79 (13.6%) | 500 (86.4%) |
| Total (Category) | 258 (26.0%) | 735 (74.0%) |
| Total (Overall) | 3,178 (50.7%) | 3,084 (49.2%) |
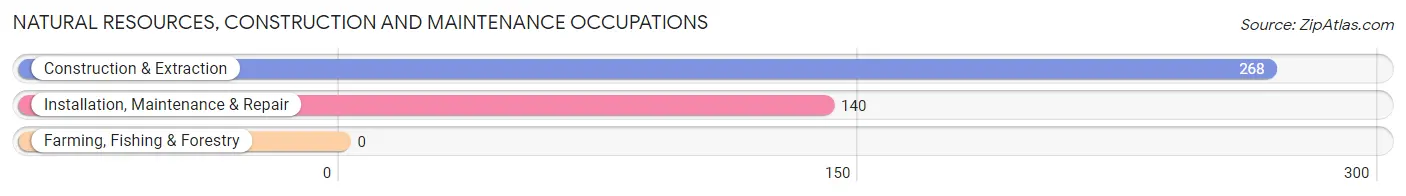
Natural Resources, Construction and Maintenance Occupations
The most common Natural Resources, Construction and Maintenance occupations in Fenton are Construction & Extraction (268 | 4.3%), and Installation, Maintenance & Repair (140 | 2.2%).
Natural Resources, Construction and Maintenance Occupations by Sex
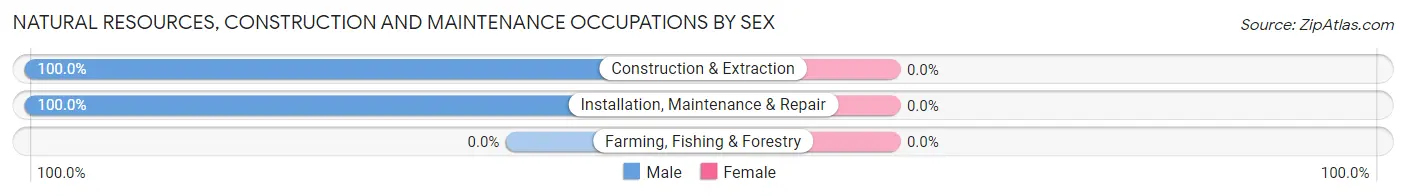
| Occupation | Male | Female |
| Farming, Fishing & Forestry | 0 (0.0%) | 0 (0.0%) |
| Construction & Extraction | 268 (100.0%) | 0 (0.0%) |
| Installation, Maintenance & Repair | 140 (100.0%) | 0 (0.0%) |
| Total (Category) | 408 (100.0%) | 0 (0.0%) |
| Total (Overall) | 3,178 (50.7%) | 3,084 (49.2%) |
Production, Transportation and Moving Occupations
The most common Production, Transportation and Moving occupations in Fenton are Production (459 | 7.3%), Material Moving (312 | 5.0%), and Transportation (71 | 1.1%).
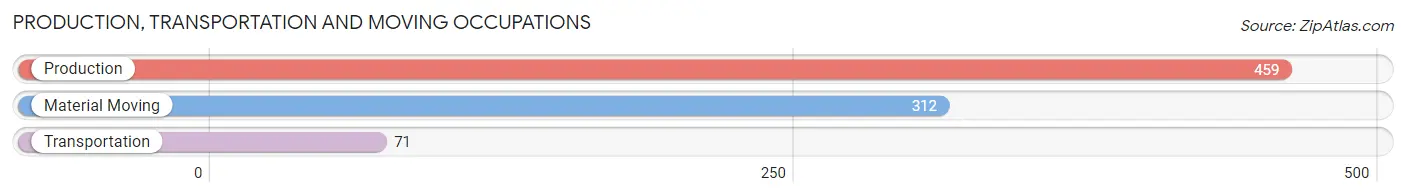
Production, Transportation and Moving Occupations by Sex
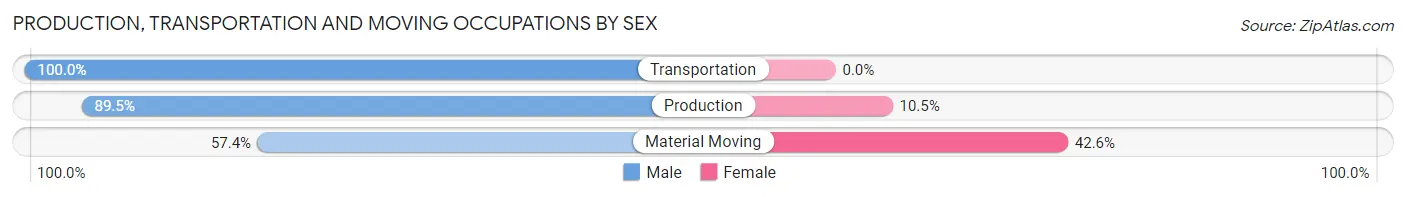
| Occupation | Male | Female |
| Production | 411 (89.5%) | 48 (10.5%) |
| Transportation | 71 (100.0%) | 0 (0.0%) |
| Material Moving | 179 (57.4%) | 133 (42.6%) |
| Total (Category) | 661 (78.5%) | 181 (21.5%) |
| Total (Overall) | 3,178 (50.7%) | 3,084 (49.2%) |
Employment Industries by Sex in Fenton
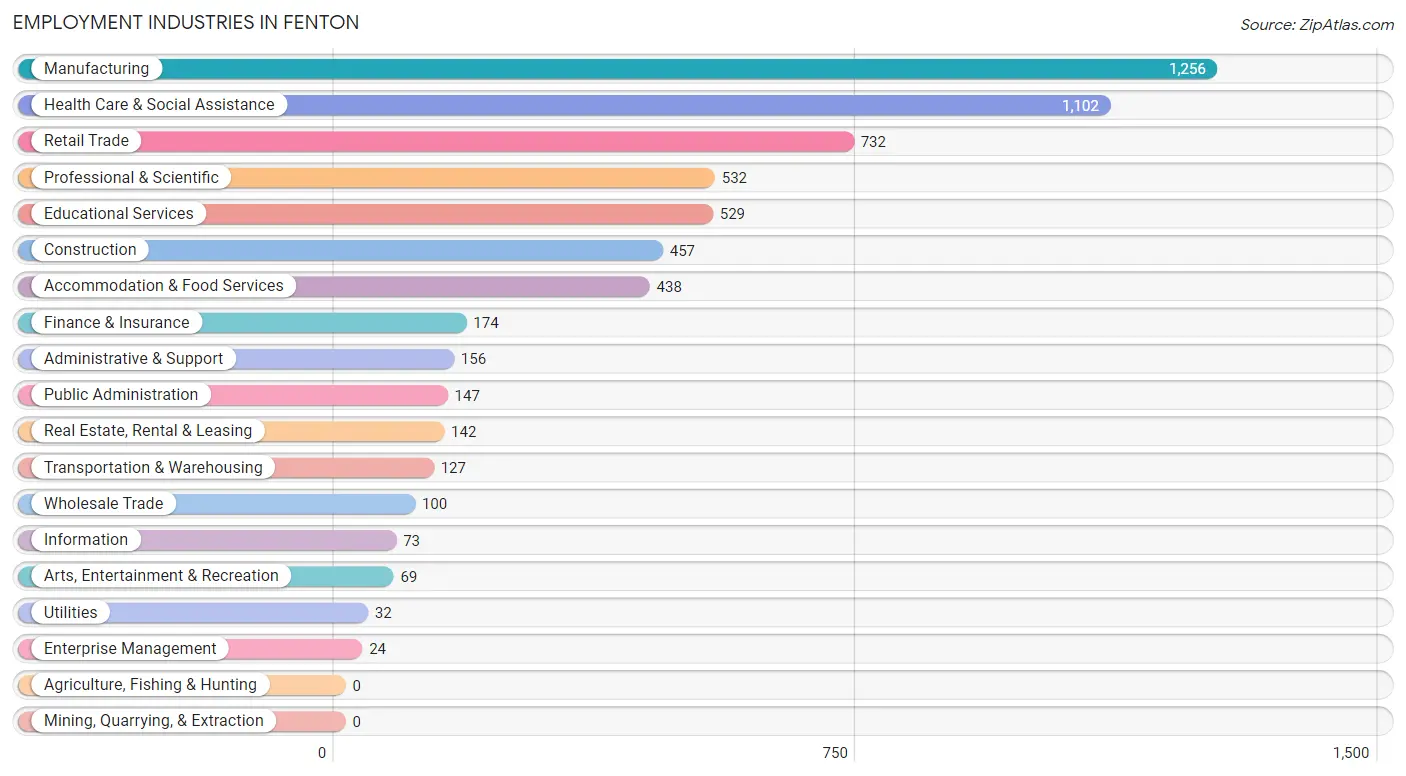
Employment Industries in Fenton
The major employment industries in Fenton include Manufacturing (1,256 | 20.1%), Health Care & Social Assistance (1,102 | 17.6%), Retail Trade (732 | 11.7%), Professional & Scientific (532 | 8.5%), and Educational Services (529 | 8.5%).
Employment Industries by Sex in Fenton
The Fenton industries that see more men than women are Wholesale Trade (100.0%), Utilities (100.0%), and Enterprise Management (100.0%), whereas the industries that tend to have a higher number of women are Real Estate, Rental & Leasing (91.5%), Educational Services (77.3%), and Information (72.6%).
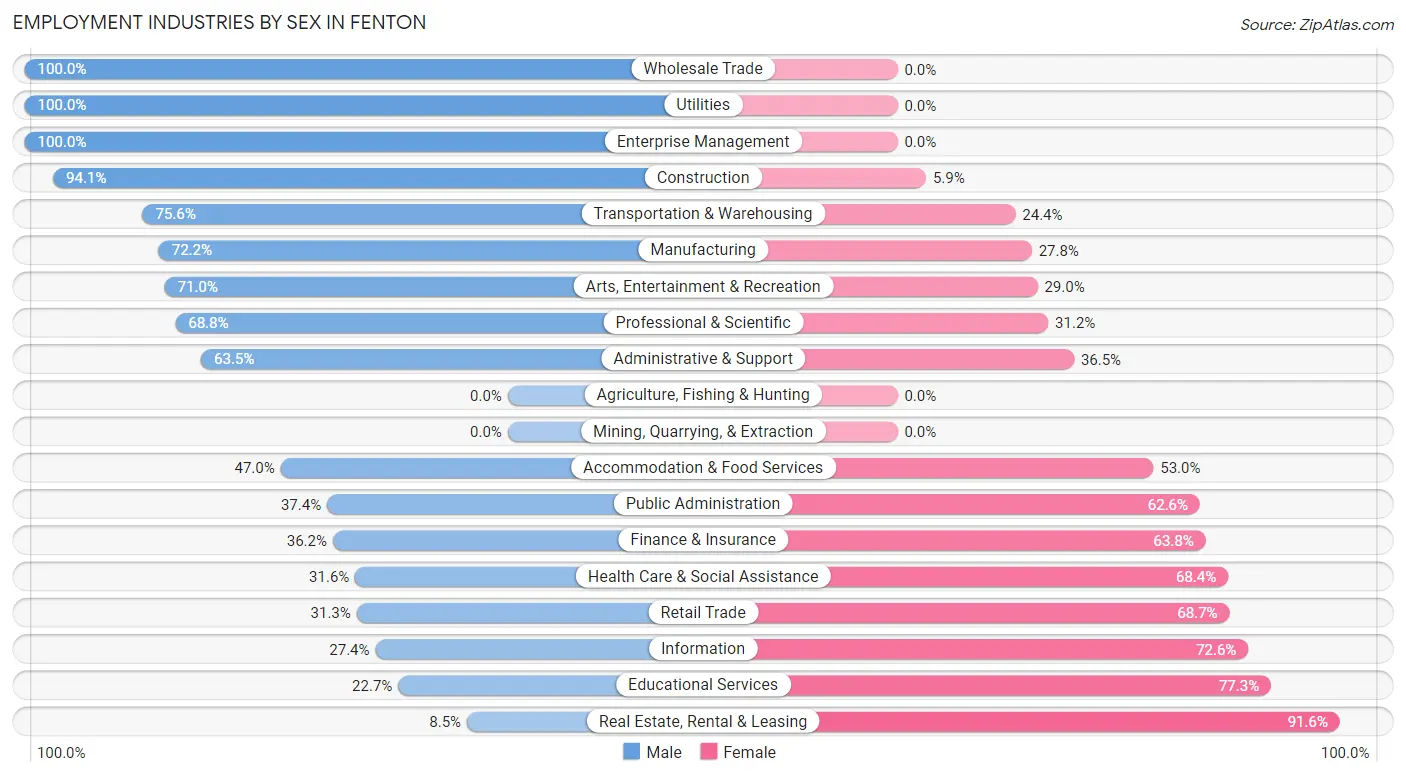
| Industry | Male | Female |
| Agriculture, Fishing & Hunting | 0 (0.0%) | 0 (0.0%) |
| Mining, Quarrying, & Extraction | 0 (0.0%) | 0 (0.0%) |
| Construction | 430 (94.1%) | 27 (5.9%) |
| Manufacturing | 907 (72.2%) | 349 (27.8%) |
| Wholesale Trade | 100 (100.0%) | 0 (0.0%) |
| Retail Trade | 229 (31.3%) | 503 (68.7%) |
| Transportation & Warehousing | 96 (75.6%) | 31 (24.4%) |
| Utilities | 32 (100.0%) | 0 (0.0%) |
| Information | 20 (27.4%) | 53 (72.6%) |
| Finance & Insurance | 63 (36.2%) | 111 (63.8%) |
| Real Estate, Rental & Leasing | 12 (8.5%) | 130 (91.5%) |
| Professional & Scientific | 366 (68.8%) | 166 (31.2%) |
| Enterprise Management | 24 (100.0%) | 0 (0.0%) |
| Administrative & Support | 99 (63.5%) | 57 (36.5%) |
| Educational Services | 120 (22.7%) | 409 (77.3%) |
| Health Care & Social Assistance | 348 (31.6%) | 754 (68.4%) |
| Arts, Entertainment & Recreation | 49 (71.0%) | 20 (29.0%) |
| Accommodation & Food Services | 206 (47.0%) | 232 (53.0%) |
| Public Administration | 55 (37.4%) | 92 (62.6%) |
| Total | 3,178 (50.7%) | 3,084 (49.2%) |
Education in Fenton
School Enrollment in Fenton
The most common levels of schooling among the 2,739 students in Fenton are high school (767 | 28.0%), middle school (569 | 20.8%), and elementary school (552 | 20.2%).
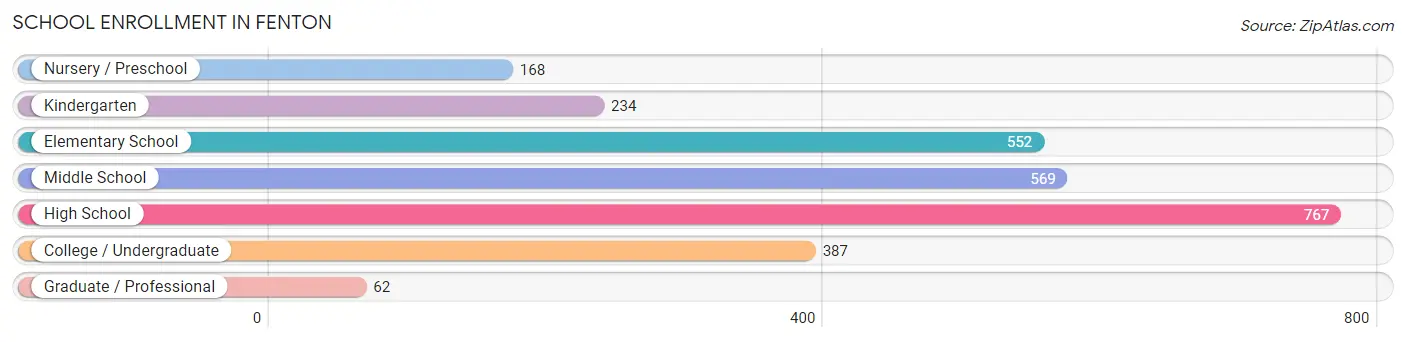
| School Level | # Students | % Students |
| Nursery / Preschool | 168 | 6.1% |
| Kindergarten | 234 | 8.5% |
| Elementary School | 552 | 20.2% |
| Middle School | 569 | 20.8% |
| High School | 767 | 28.0% |
| College / Undergraduate | 387 | 14.1% |
| Graduate / Professional | 62 | 2.3% |
| Total | 2,739 | 100.0% |
School Enrollment by Age by Funding Source in Fenton
Out of a total of 2,739 students who are enrolled in schools in Fenton, 118 (4.3%) attend a private institution, while the remaining 2,621 (95.7%) are enrolled in public schools. The age group of 3 to 4 year olds has the highest likelihood of being enrolled in private schools, with 70 (100.0% in the age bracket) enrolled. Conversely, the age group of 18 to 19 year olds has the lowest likelihood of being enrolled in a private school, with 178 (100.0% in the age bracket) attending a public institution.
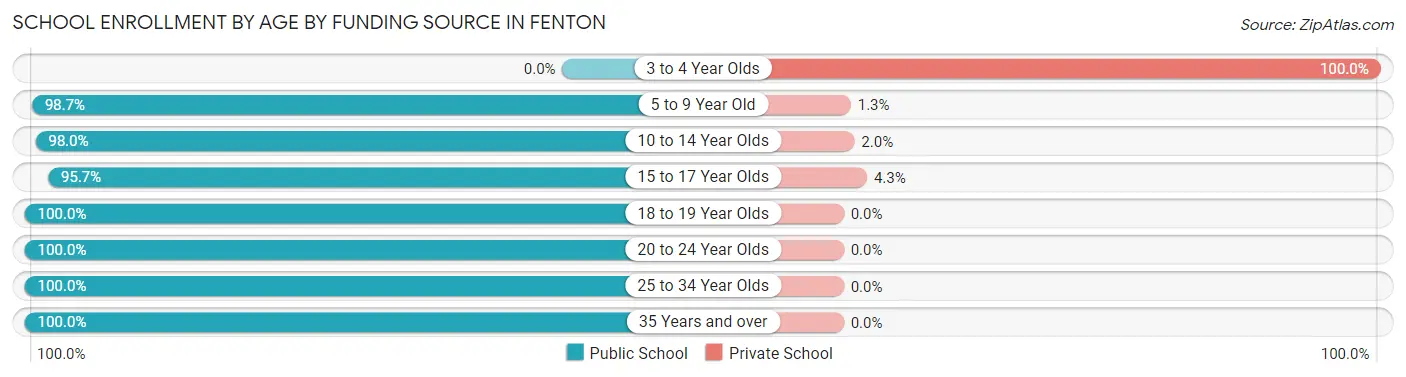
| Age Bracket | Public School | Private School |
| 3 to 4 Year Olds | 0 (0.0%) | 70 (100.0%) |
| 5 to 9 Year Old | 742 (98.7%) | 10 (1.3%) |
| 10 to 14 Year Olds | 784 (98.0%) | 16 (2.0%) |
| 15 to 17 Year Olds | 463 (95.7%) | 21 (4.3%) |
| 18 to 19 Year Olds | 178 (100.0%) | 0 (0.0%) |
| 20 to 24 Year Olds | 205 (100.0%) | 0 (0.0%) |
| 25 to 34 Year Olds | 183 (100.0%) | 0 (0.0%) |
| 35 Years and over | 67 (100.0%) | 0 (0.0%) |
| Total | 2,621 (95.7%) | 118 (4.3%) |
Educational Attainment by Field of Study in Fenton
Business (816 | 28.4%), science & technology (470 | 16.4%), engineering (418 | 14.5%), education (237 | 8.3%), and arts & humanities (224 | 7.8%) are the most common fields of study among 2,874 individuals in Fenton who have obtained a bachelor's degree or higher.
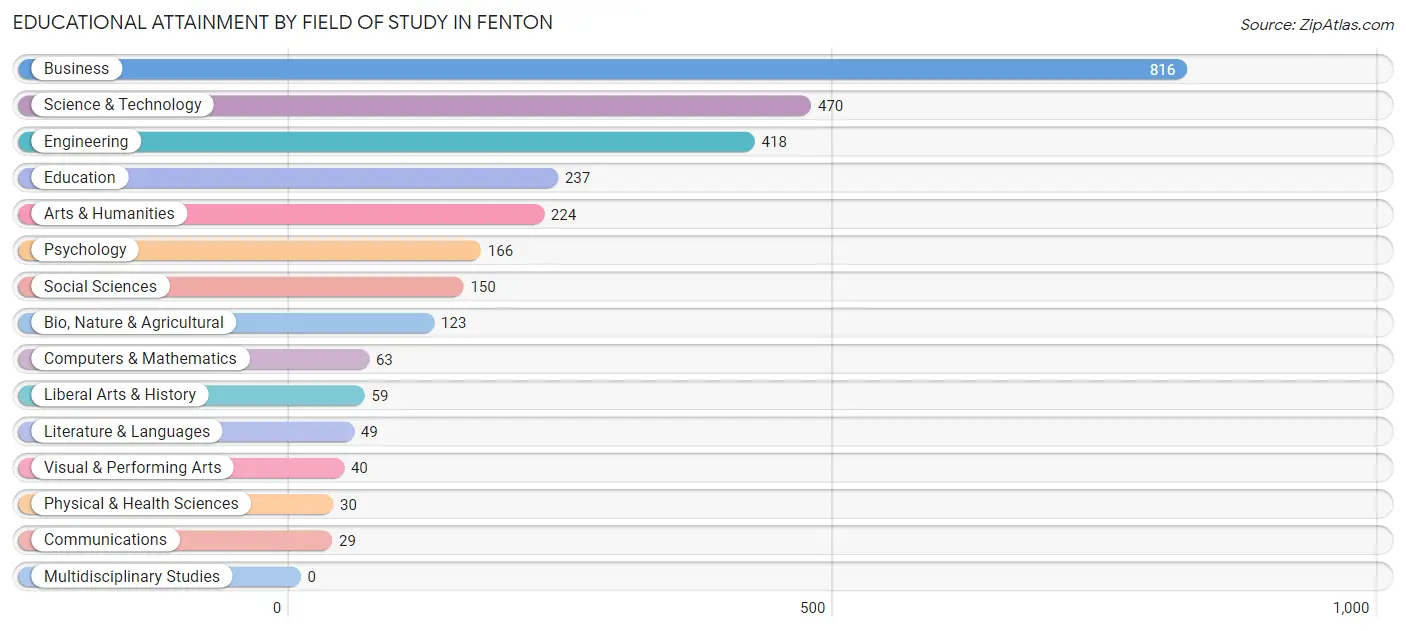
| Field of Study | # Graduates | % Graduates |
| Computers & Mathematics | 63 | 2.2% |
| Bio, Nature & Agricultural | 123 | 4.3% |
| Physical & Health Sciences | 30 | 1.0% |
| Psychology | 166 | 5.8% |
| Social Sciences | 150 | 5.2% |
| Engineering | 418 | 14.5% |
| Multidisciplinary Studies | 0 | 0.0% |
| Science & Technology | 470 | 16.4% |
| Business | 816 | 28.4% |
| Education | 237 | 8.3% |
| Literature & Languages | 49 | 1.7% |
| Liberal Arts & History | 59 | 2.1% |
| Visual & Performing Arts | 40 | 1.4% |
| Communications | 29 | 1.0% |
| Arts & Humanities | 224 | 7.8% |
| Total | 2,874 | 100.0% |
Transportation & Commute in Fenton
Vehicle Availability by Sex in Fenton
The most prevalent vehicle ownership categories in Fenton are males with 2 vehicles (1,691, accounting for 53.8%) and females with 2 vehicles (1,537, making up 55.3%).
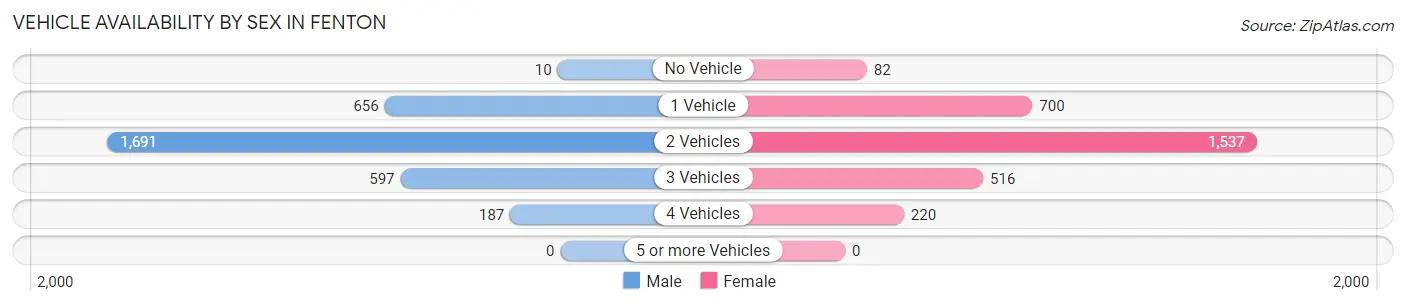
| Vehicles Available | Male | Female |
| No Vehicle | 10 (0.3%) | 82 (2.7%) |
| 1 Vehicle | 656 (20.9%) | 700 (22.9%) |
| 2 Vehicles | 1,691 (53.8%) | 1,537 (50.3%) |
| 3 Vehicles | 597 (19.0%) | 516 (16.9%) |
| 4 Vehicles | 187 (5.9%) | 220 (7.2%) |
| 5 or more Vehicles | 0 (0.0%) | 0 (0.0%) |
| Total | 3,141 (100.0%) | 3,055 (100.0%) |
Commute Time in Fenton
The most frequently occuring commute durations in Fenton are 45 to 59 minutes (810 commuters, 15.1%), 60 to 89 minutes (619 commuters, 11.5%), and 30 to 34 minutes (614 commuters, 11.5%).
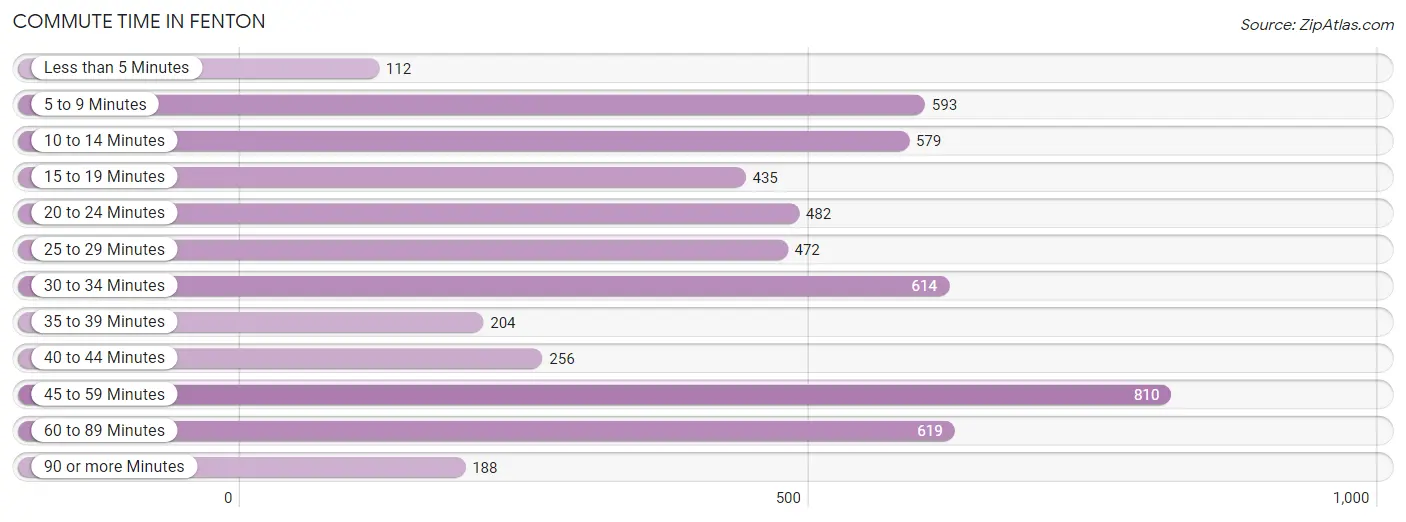
| Commute Time | # Commuters | % Commuters |
| Less than 5 Minutes | 112 | 2.1% |
| 5 to 9 Minutes | 593 | 11.1% |
| 10 to 14 Minutes | 579 | 10.8% |
| 15 to 19 Minutes | 435 | 8.1% |
| 20 to 24 Minutes | 482 | 9.0% |
| 25 to 29 Minutes | 472 | 8.8% |
| 30 to 34 Minutes | 614 | 11.5% |
| 35 to 39 Minutes | 204 | 3.8% |
| 40 to 44 Minutes | 256 | 4.8% |
| 45 to 59 Minutes | 810 | 15.1% |
| 60 to 89 Minutes | 619 | 11.5% |
| 90 or more Minutes | 188 | 3.5% |
Commute Time by Sex in Fenton
The most common commute times in Fenton are 60 to 89 minutes (514 commuters, 17.6%) for males and 45 to 59 minutes (500 commuters, 20.4%) for females.
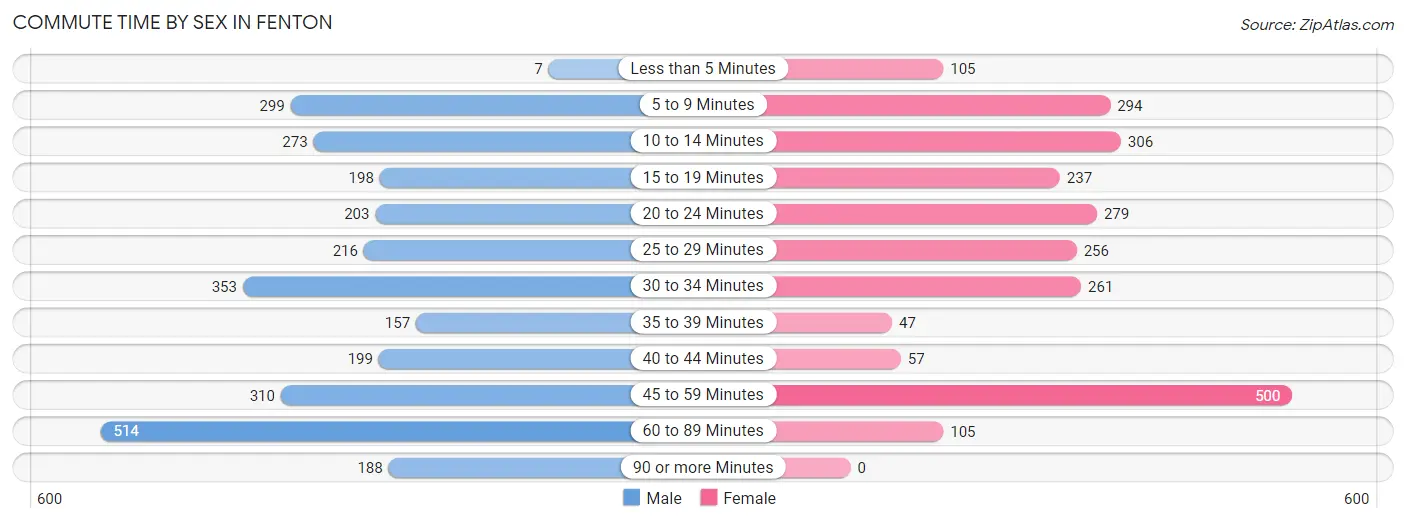
| Commute Time | Male | Female |
| Less than 5 Minutes | 7 (0.2%) | 105 (4.3%) |
| 5 to 9 Minutes | 299 (10.2%) | 294 (12.0%) |
| 10 to 14 Minutes | 273 (9.4%) | 306 (12.5%) |
| 15 to 19 Minutes | 198 (6.8%) | 237 (9.7%) |
| 20 to 24 Minutes | 203 (7.0%) | 279 (11.4%) |
| 25 to 29 Minutes | 216 (7.4%) | 256 (10.5%) |
| 30 to 34 Minutes | 353 (12.1%) | 261 (10.7%) |
| 35 to 39 Minutes | 157 (5.4%) | 47 (1.9%) |
| 40 to 44 Minutes | 199 (6.8%) | 57 (2.3%) |
| 45 to 59 Minutes | 310 (10.6%) | 500 (20.4%) |
| 60 to 89 Minutes | 514 (17.6%) | 105 (4.3%) |
| 90 or more Minutes | 188 (6.4%) | 0 (0.0%) |
Time of Departure to Work by Sex in Fenton
The most frequent times of departure to work in Fenton are 6:00 AM to 6:29 AM (436, 14.9%) for males and 8:00 AM to 8:29 AM (376, 15.4%) for females.
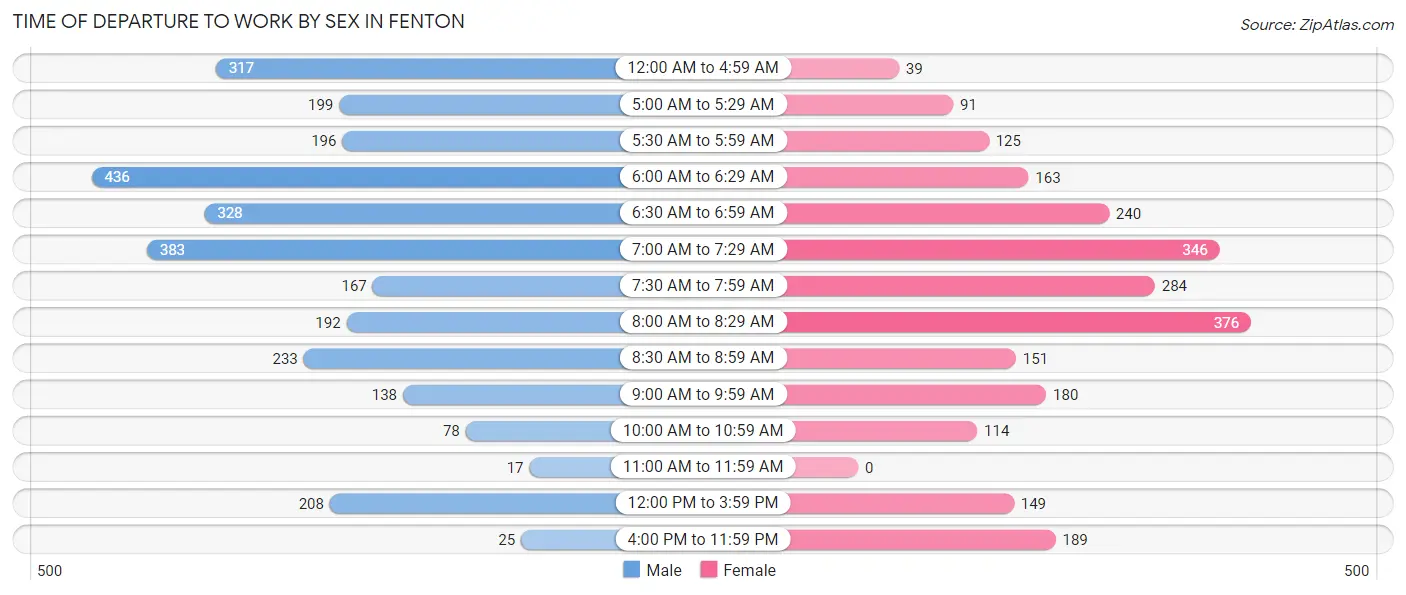
| Time of Departure | Male | Female |
| 12:00 AM to 4:59 AM | 317 (10.9%) | 39 (1.6%) |
| 5:00 AM to 5:29 AM | 199 (6.8%) | 91 (3.7%) |
| 5:30 AM to 5:59 AM | 196 (6.7%) | 125 (5.1%) |
| 6:00 AM to 6:29 AM | 436 (14.9%) | 163 (6.7%) |
| 6:30 AM to 6:59 AM | 328 (11.2%) | 240 (9.8%) |
| 7:00 AM to 7:29 AM | 383 (13.1%) | 346 (14.1%) |
| 7:30 AM to 7:59 AM | 167 (5.7%) | 284 (11.6%) |
| 8:00 AM to 8:29 AM | 192 (6.6%) | 376 (15.4%) |
| 8:30 AM to 8:59 AM | 233 (8.0%) | 151 (6.2%) |
| 9:00 AM to 9:59 AM | 138 (4.7%) | 180 (7.4%) |
| 10:00 AM to 10:59 AM | 78 (2.7%) | 114 (4.7%) |
| 11:00 AM to 11:59 AM | 17 (0.6%) | 0 (0.0%) |
| 12:00 PM to 3:59 PM | 208 (7.1%) | 149 (6.1%) |
| 4:00 PM to 11:59 PM | 25 (0.9%) | 189 (7.7%) |
| Total | 2,917 (100.0%) | 2,447 (100.0%) |
Housing Occupancy in Fenton
Occupancy by Ownership in Fenton
Of the total 5,212 dwellings in Fenton, owner-occupied units account for 3,233 (62.0%), while renter-occupied units make up 1,979 (38.0%).
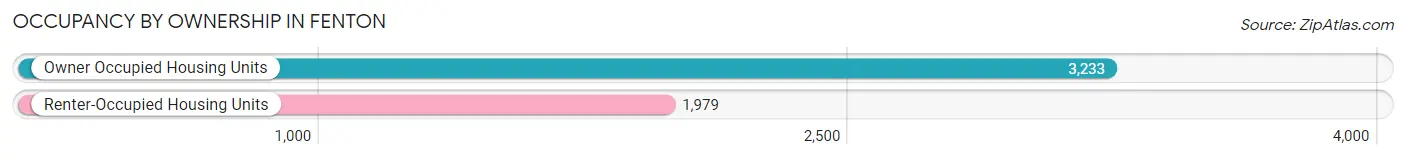
| Occupancy | # Housing Units | % Housing Units |
| Owner Occupied Housing Units | 3,233 | 62.0% |
| Renter-Occupied Housing Units | 1,979 | 38.0% |
| Total Occupied Housing Units | 5,212 | 100.0% |
Occupancy by Household Size in Fenton
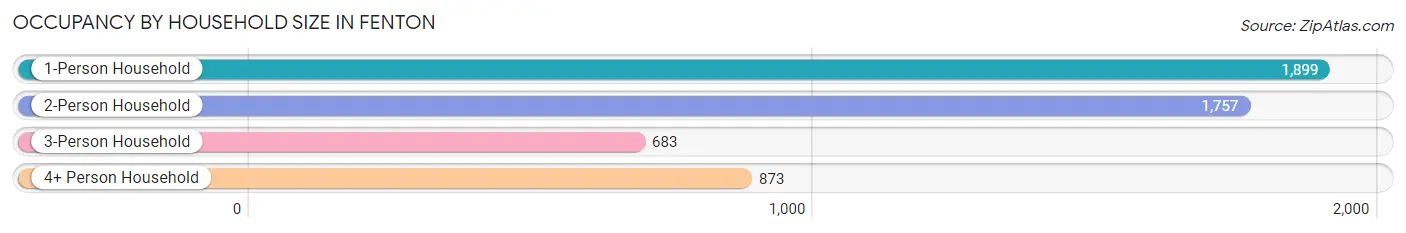
| Household Size | # Housing Units | % Housing Units |
| 1-Person Household | 1,899 | 36.4% |
| 2-Person Household | 1,757 | 33.7% |
| 3-Person Household | 683 | 13.1% |
| 4+ Person Household | 873 | 16.8% |
| Total Housing Units | 5,212 | 100.0% |
Occupancy by Ownership by Household Size in Fenton
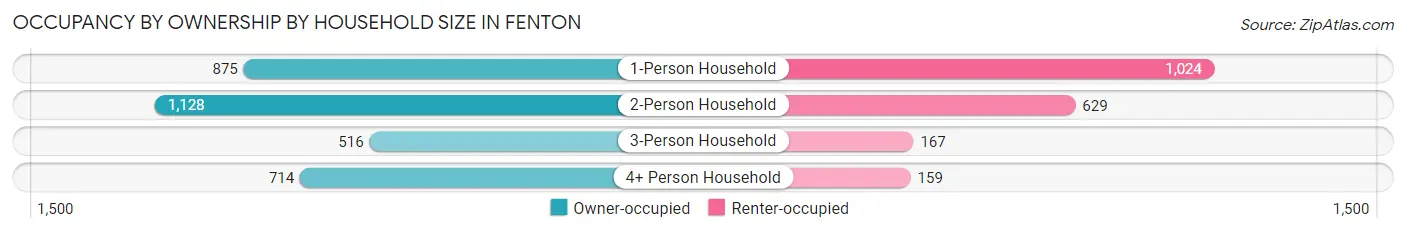
| Household Size | Owner-occupied | Renter-occupied |
| 1-Person Household | 875 (46.1%) | 1,024 (53.9%) |
| 2-Person Household | 1,128 (64.2%) | 629 (35.8%) |
| 3-Person Household | 516 (75.5%) | 167 (24.4%) |
| 4+ Person Household | 714 (81.8%) | 159 (18.2%) |
| Total Housing Units | 3,233 (62.0%) | 1,979 (38.0%) |
Occupancy by Educational Attainment in Fenton
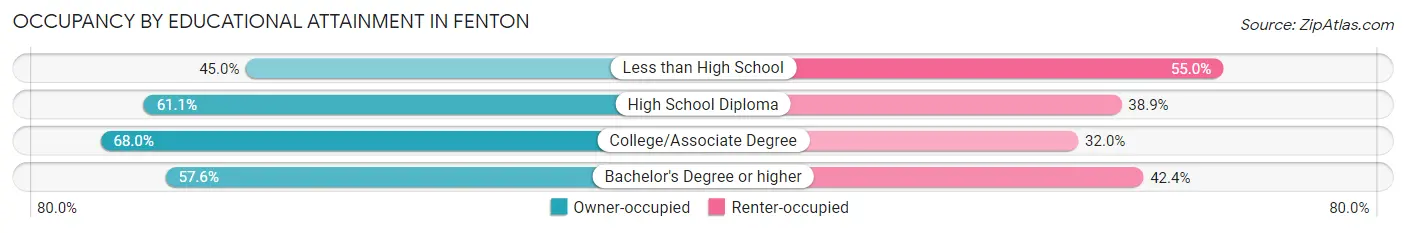
| Household Size | Owner-occupied | Renter-occupied |
| Less than High School | 54 (45.0%) | 66 (55.0%) |
| High School Diploma | 691 (61.1%) | 440 (38.9%) |
| College/Associate Degree | 1,349 (68.0%) | 636 (32.0%) |
| Bachelor's Degree or higher | 1,139 (57.6%) | 837 (42.4%) |
Occupancy by Age of Householder in Fenton
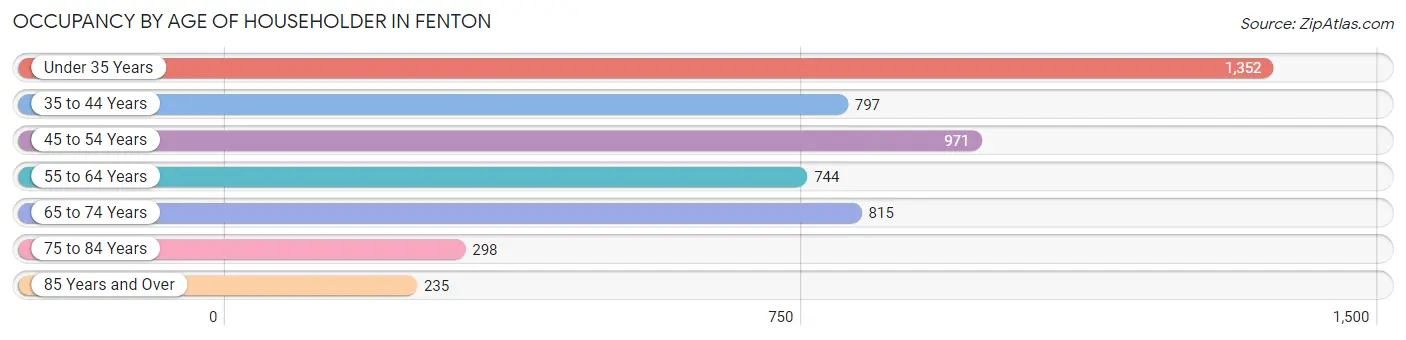
| Age Bracket | # Households | % Households |
| Under 35 Years | 1,352 | 25.9% |
| 35 to 44 Years | 797 | 15.3% |
| 45 to 54 Years | 971 | 18.6% |
| 55 to 64 Years | 744 | 14.3% |
| 65 to 74 Years | 815 | 15.6% |
| 75 to 84 Years | 298 | 5.7% |
| 85 Years and Over | 235 | 4.5% |
| Total | 5,212 | 100.0% |
Housing Finances in Fenton
Median Income by Occupancy in Fenton
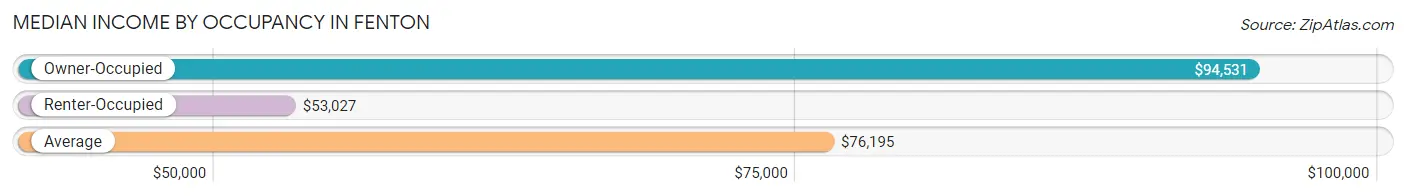
| Occupancy Type | # Households | Median Income |
| Owner-Occupied | 3,233 (62.0%) | $94,531 |
| Renter-Occupied | 1,979 (38.0%) | $53,027 |
| Average | 5,212 (100.0%) | $76,195 |
Occupancy by Householder Income Bracket in Fenton
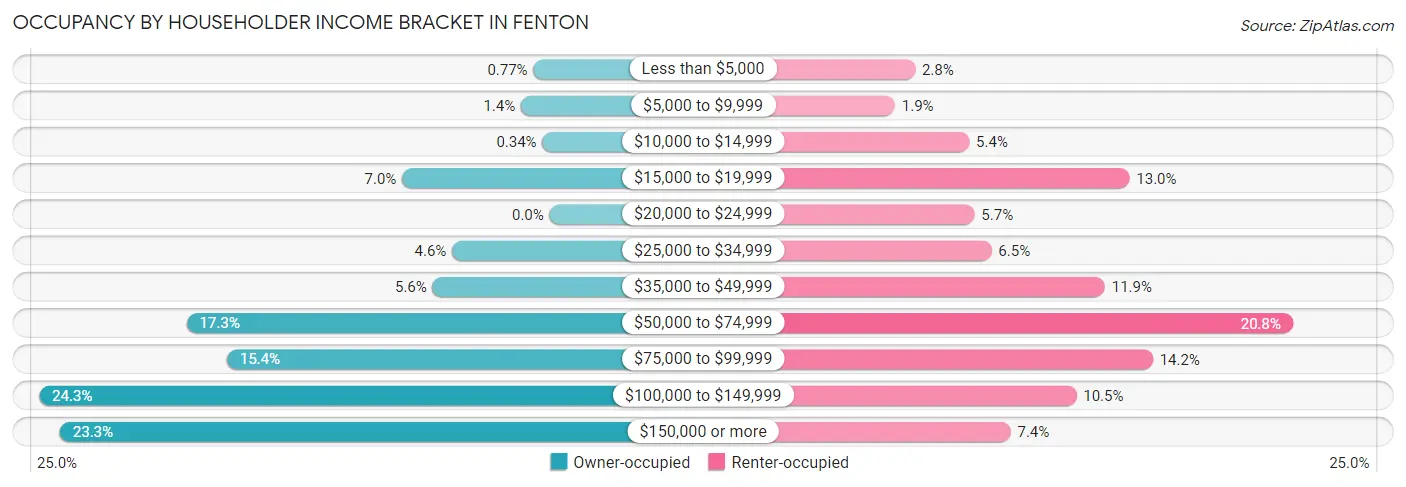
| Income Bracket | Owner-occupied | Renter-occupied |
| Less than $5,000 | 25 (0.8%) | 56 (2.8%) |
| $5,000 to $9,999 | 44 (1.4%) | 37 (1.9%) |
| $10,000 to $14,999 | 11 (0.3%) | 107 (5.4%) |
| $15,000 to $19,999 | 227 (7.0%) | 258 (13.0%) |
| $20,000 to $24,999 | 0 (0.0%) | 112 (5.7%) |
| $25,000 to $34,999 | 150 (4.6%) | 128 (6.5%) |
| $35,000 to $49,999 | 180 (5.6%) | 235 (11.9%) |
| $50,000 to $74,999 | 559 (17.3%) | 412 (20.8%) |
| $75,000 to $99,999 | 497 (15.4%) | 280 (14.1%) |
| $100,000 to $149,999 | 786 (24.3%) | 208 (10.5%) |
| $150,000 or more | 754 (23.3%) | 146 (7.4%) |
| Total | 3,233 (100.0%) | 1,979 (100.0%) |
Monthly Housing Cost Tiers in Fenton
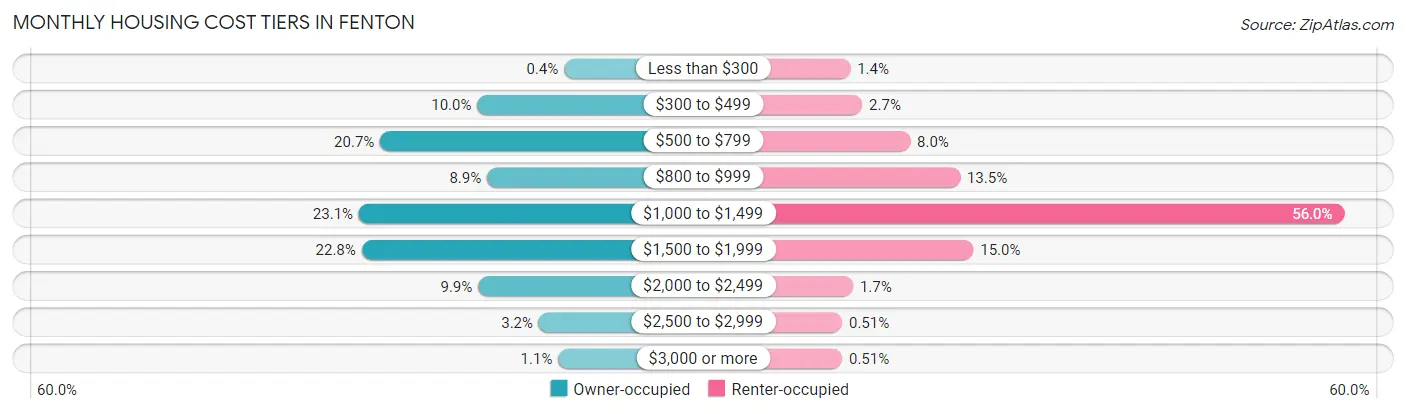
| Monthly Cost | Owner-occupied | Renter-occupied |
| Less than $300 | 13 (0.4%) | 28 (1.4%) |
| $300 to $499 | 323 (10.0%) | 54 (2.7%) |
| $500 to $799 | 670 (20.7%) | 159 (8.0%) |
| $800 to $999 | 288 (8.9%) | 268 (13.5%) |
| $1,000 to $1,499 | 746 (23.1%) | 1,108 (56.0%) |
| $1,500 to $1,999 | 736 (22.8%) | 297 (15.0%) |
| $2,000 to $2,499 | 320 (9.9%) | 34 (1.7%) |
| $2,500 to $2,999 | 103 (3.2%) | 10 (0.5%) |
| $3,000 or more | 34 (1.1%) | 10 (0.5%) |
| Total | 3,233 (100.0%) | 1,979 (100.0%) |
Physical Housing Characteristics in Fenton
Housing Structures in Fenton
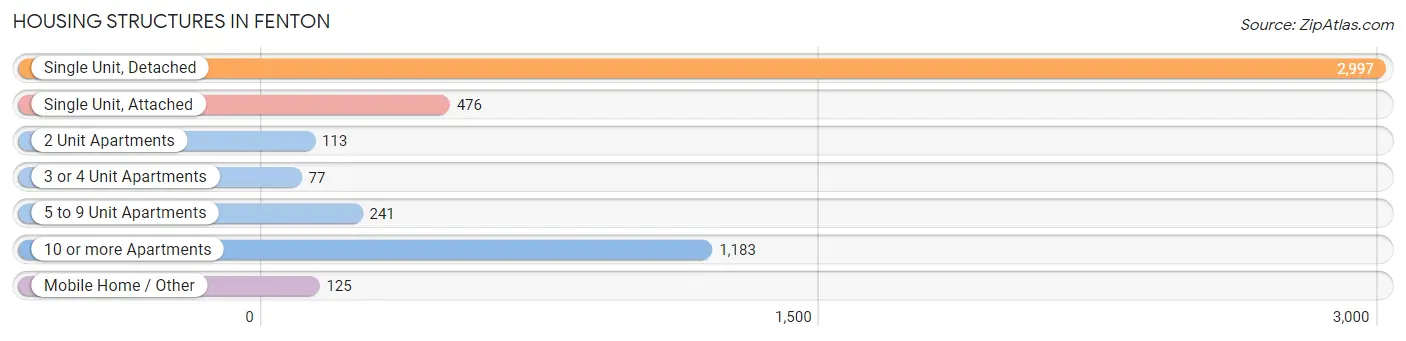
| Structure Type | # Housing Units | % Housing Units |
| Single Unit, Detached | 2,997 | 57.5% |
| Single Unit, Attached | 476 | 9.1% |
| 2 Unit Apartments | 113 | 2.2% |
| 3 or 4 Unit Apartments | 77 | 1.5% |
| 5 to 9 Unit Apartments | 241 | 4.6% |
| 10 or more Apartments | 1,183 | 22.7% |
| Mobile Home / Other | 125 | 2.4% |
| Total | 5,212 | 100.0% |
Housing Structures by Occupancy in Fenton
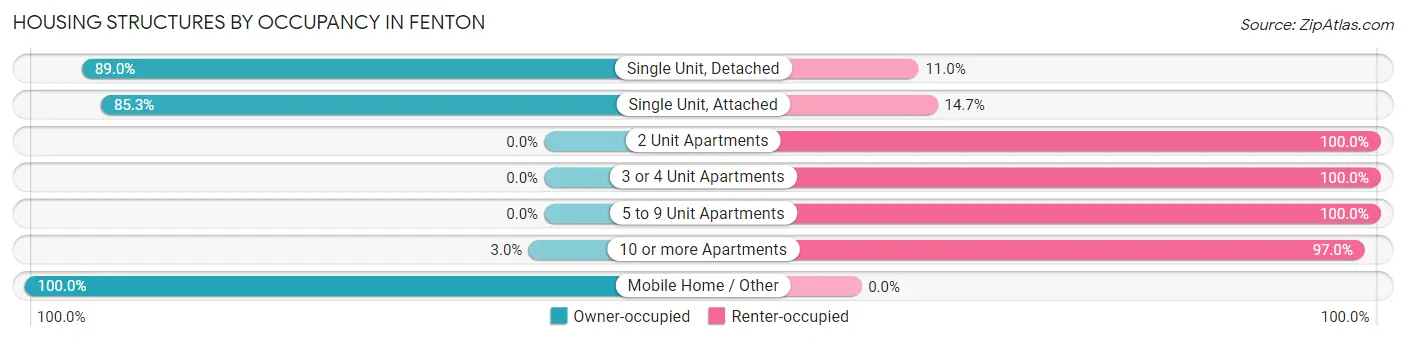
| Structure Type | Owner-occupied | Renter-occupied |
| Single Unit, Detached | 2,666 (89.0%) | 331 (11.0%) |
| Single Unit, Attached | 406 (85.3%) | 70 (14.7%) |
| 2 Unit Apartments | 0 (0.0%) | 113 (100.0%) |
| 3 or 4 Unit Apartments | 0 (0.0%) | 77 (100.0%) |
| 5 to 9 Unit Apartments | 0 (0.0%) | 241 (100.0%) |
| 10 or more Apartments | 36 (3.0%) | 1,147 (97.0%) |
| Mobile Home / Other | 125 (100.0%) | 0 (0.0%) |
| Total | 3,233 (62.0%) | 1,979 (38.0%) |
Housing Structures by Number of Rooms in Fenton
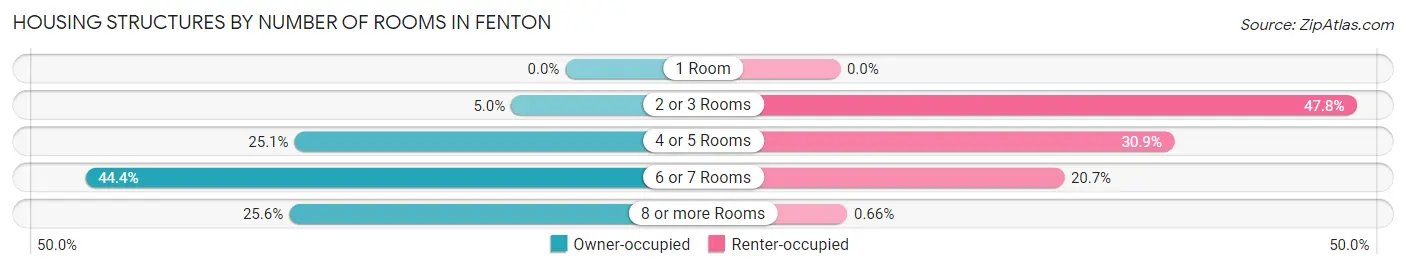
| Number of Rooms | Owner-occupied | Renter-occupied |
| 1 Room | 0 (0.0%) | 0 (0.0%) |
| 2 or 3 Rooms | 162 (5.0%) | 945 (47.7%) |
| 4 or 5 Rooms | 810 (25.1%) | 611 (30.9%) |
| 6 or 7 Rooms | 1,435 (44.4%) | 410 (20.7%) |
| 8 or more Rooms | 826 (25.6%) | 13 (0.7%) |
| Total | 3,233 (100.0%) | 1,979 (100.0%) |
Housing Structure by Heating Type in Fenton
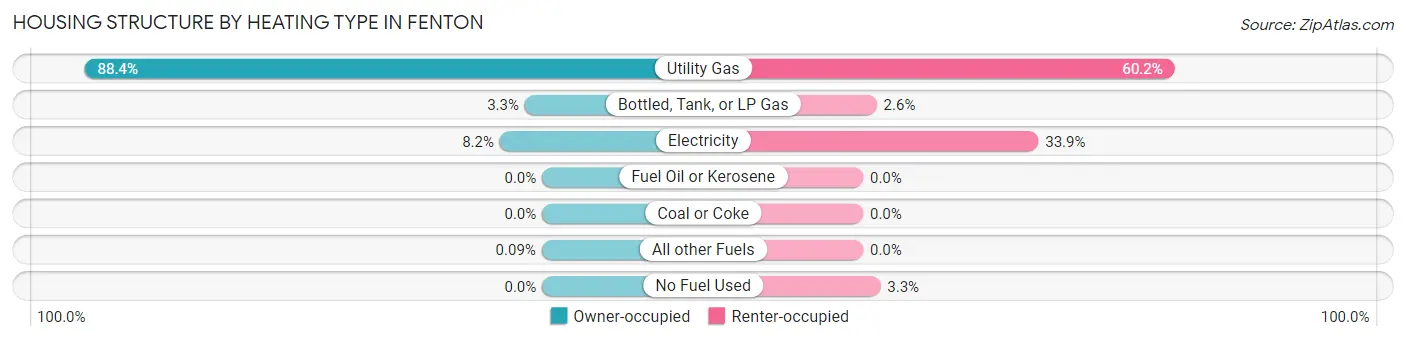
| Heating Type | Owner-occupied | Renter-occupied |
| Utility Gas | 2,858 (88.4%) | 1,191 (60.2%) |
| Bottled, Tank, or LP Gas | 108 (3.3%) | 52 (2.6%) |
| Electricity | 264 (8.2%) | 670 (33.9%) |
| Fuel Oil or Kerosene | 0 (0.0%) | 0 (0.0%) |
| Coal or Coke | 0 (0.0%) | 0 (0.0%) |
| All other Fuels | 3 (0.1%) | 0 (0.0%) |
| No Fuel Used | 0 (0.0%) | 66 (3.3%) |
| Total | 3,233 (100.0%) | 1,979 (100.0%) |
Household Vehicle Usage in Fenton
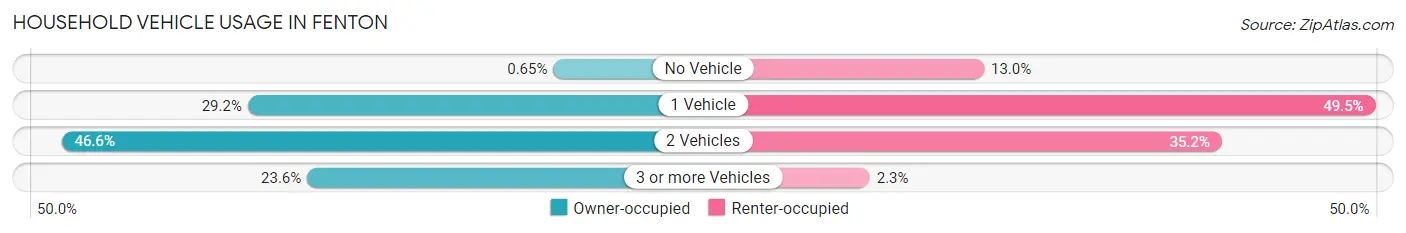
| Vehicles per Household | Owner-occupied | Renter-occupied |
| No Vehicle | 21 (0.6%) | 257 (13.0%) |
| 1 Vehicle | 943 (29.2%) | 980 (49.5%) |
| 2 Vehicles | 1,505 (46.6%) | 696 (35.2%) |
| 3 or more Vehicles | 764 (23.6%) | 46 (2.3%) |
| Total | 3,233 (100.0%) | 1,979 (100.0%) |
Real Estate & Mortgages in Fenton
Real Estate and Mortgage Overview in Fenton
| Characteristic | Without Mortgage | With Mortgage |
| Housing Units | 951 | 2,282 |
| Median Property Value | $168,900 | $205,200 |
| Median Household Income | $73,558 | $573 |
| Monthly Housing Costs | $605 | $34 |
| Real Estate Taxes | $2,460 | $57 |
Property Value by Mortgage Status in Fenton
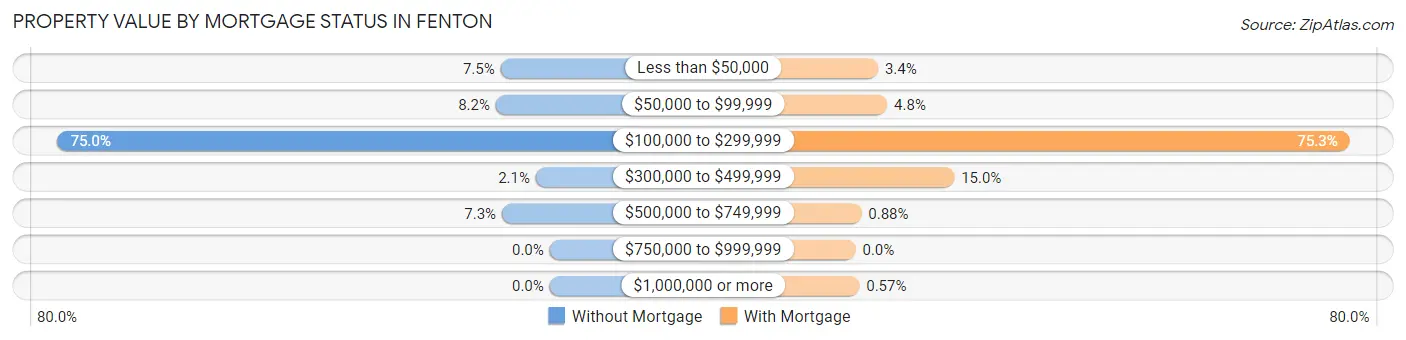
| Property Value | Without Mortgage | With Mortgage |
| Less than $50,000 | 71 (7.5%) | 78 (3.4%) |
| $50,000 to $99,999 | 78 (8.2%) | 110 (4.8%) |
| $100,000 to $299,999 | 713 (75.0%) | 1,718 (75.3%) |
| $300,000 to $499,999 | 20 (2.1%) | 343 (15.0%) |
| $500,000 to $749,999 | 69 (7.3%) | 20 (0.9%) |
| $750,000 to $999,999 | 0 (0.0%) | 0 (0.0%) |
| $1,000,000 or more | 0 (0.0%) | 13 (0.6%) |
| Total | 951 (100.0%) | 2,282 (100.0%) |
Household Income by Mortgage Status in Fenton
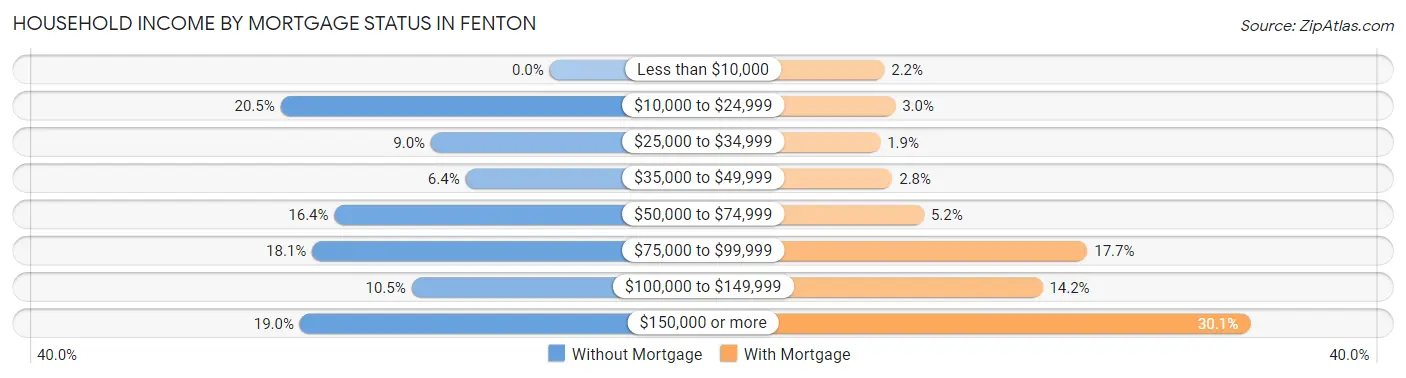
| Household Income | Without Mortgage | With Mortgage |
| Less than $10,000 | 0 (0.0%) | 50 (2.2%) |
| $10,000 to $24,999 | 195 (20.5%) | 69 (3.0%) |
| $25,000 to $34,999 | 86 (9.0%) | 43 (1.9%) |
| $35,000 to $49,999 | 61 (6.4%) | 64 (2.8%) |
| $50,000 to $74,999 | 156 (16.4%) | 119 (5.2%) |
| $75,000 to $99,999 | 172 (18.1%) | 403 (17.7%) |
| $100,000 to $149,999 | 100 (10.5%) | 325 (14.2%) |
| $150,000 or more | 181 (19.0%) | 686 (30.1%) |
| Total | 951 (100.0%) | 2,282 (100.0%) |
Property Value to Household Income Ratio in Fenton
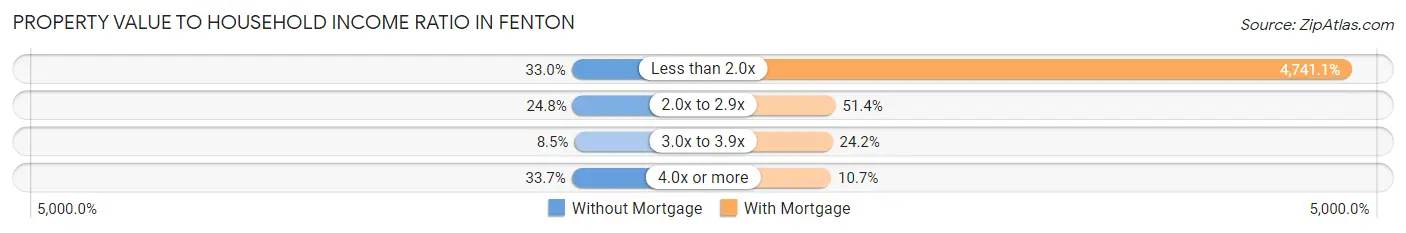
| Value-to-Income Ratio | Without Mortgage | With Mortgage |
| Less than 2.0x | 314 (33.0%) | 108,192 (4,741.1%) |
| 2.0x to 2.9x | 236 (24.8%) | 1,173 (51.4%) |
| 3.0x to 3.9x | 81 (8.5%) | 553 (24.2%) |
| 4.0x or more | 320 (33.7%) | 243 (10.6%) |
| Total | 951 (100.0%) | 2,282 (100.0%) |
Real Estate Taxes by Mortgage Status in Fenton
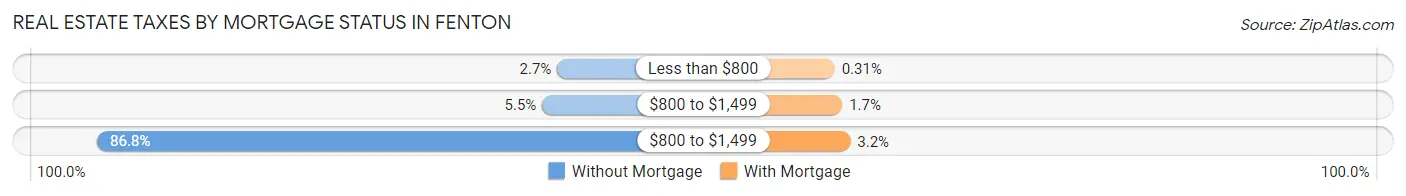
| Property Taxes | Without Mortgage | With Mortgage |
| Less than $800 | 26 (2.7%) | 7 (0.3%) |
| $800 to $1,499 | 52 (5.5%) | 38 (1.7%) |
| $800 to $1,499 | 825 (86.8%) | 72 (3.2%) |
| Total | 951 (100.0%) | 2,282 (100.0%) |
Health & Disability in Fenton
Health Insurance Coverage by Age in Fenton
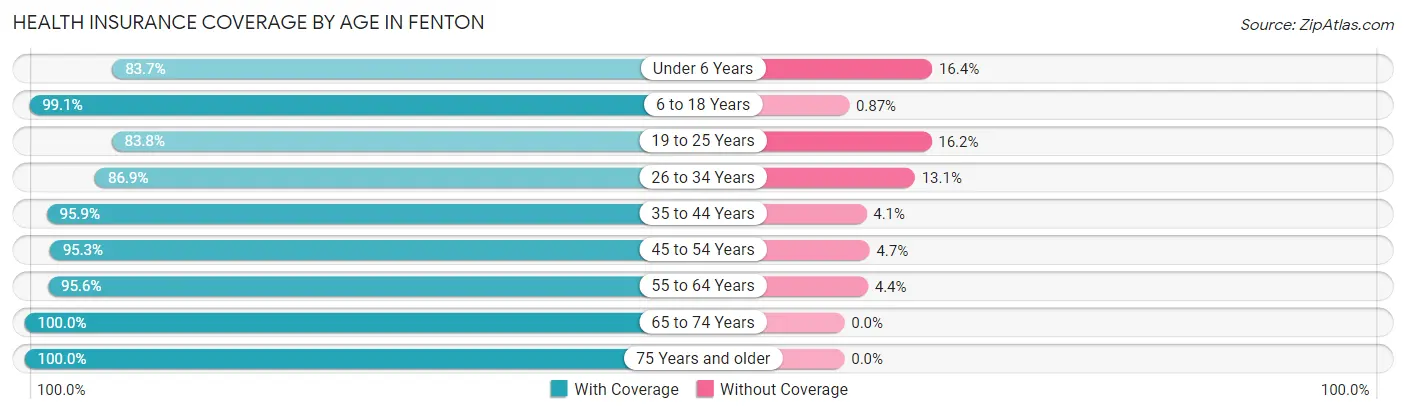
| Age Bracket | With Coverage | Without Coverage |
| Under 6 Years | 670 (83.7%) | 131 (16.4%) |
| 6 to 18 Years | 1,936 (99.1%) | 17 (0.9%) |
| 19 to 25 Years | 883 (83.8%) | 171 (16.2%) |
| 26 to 34 Years | 1,600 (86.9%) | 242 (13.1%) |
| 35 to 44 Years | 1,519 (95.9%) | 65 (4.1%) |
| 45 to 54 Years | 1,424 (95.3%) | 70 (4.7%) |
| 55 to 64 Years | 1,201 (95.6%) | 55 (4.4%) |
| 65 to 74 Years | 1,143 (100.0%) | 0 (0.0%) |
| 75 Years and older | 692 (100.0%) | 0 (0.0%) |
| Total | 11,068 (93.6%) | 751 (6.4%) |
Health Insurance Coverage by Citizenship Status in Fenton
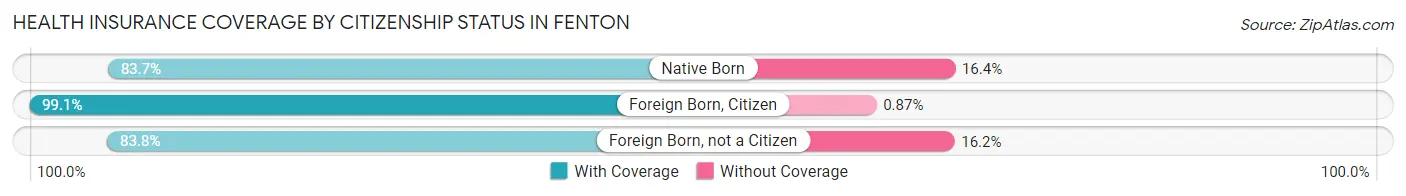
| Citizenship Status | With Coverage | Without Coverage |
| Native Born | 670 (83.7%) | 131 (16.4%) |
| Foreign Born, Citizen | 1,936 (99.1%) | 17 (0.9%) |
| Foreign Born, not a Citizen | 883 (83.8%) | 171 (16.2%) |
Health Insurance Coverage by Household Income in Fenton
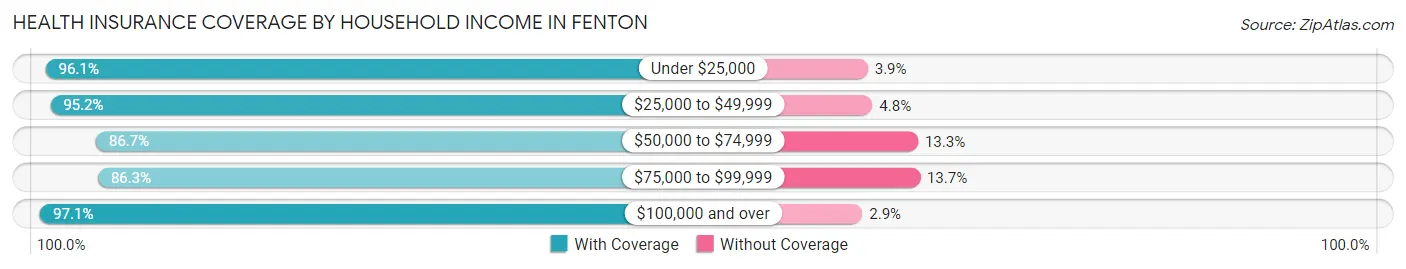
| Household Income | With Coverage | Without Coverage |
| Under $25,000 | 1,392 (96.1%) | 57 (3.9%) |
| $25,000 to $49,999 | 1,012 (95.2%) | 51 (4.8%) |
| $50,000 to $74,999 | 1,695 (86.7%) | 261 (13.3%) |
| $75,000 to $99,999 | 1,347 (86.3%) | 214 (13.7%) |
| $100,000 and over | 5,596 (97.1%) | 168 (2.9%) |
Public vs Private Health Insurance Coverage by Age in Fenton
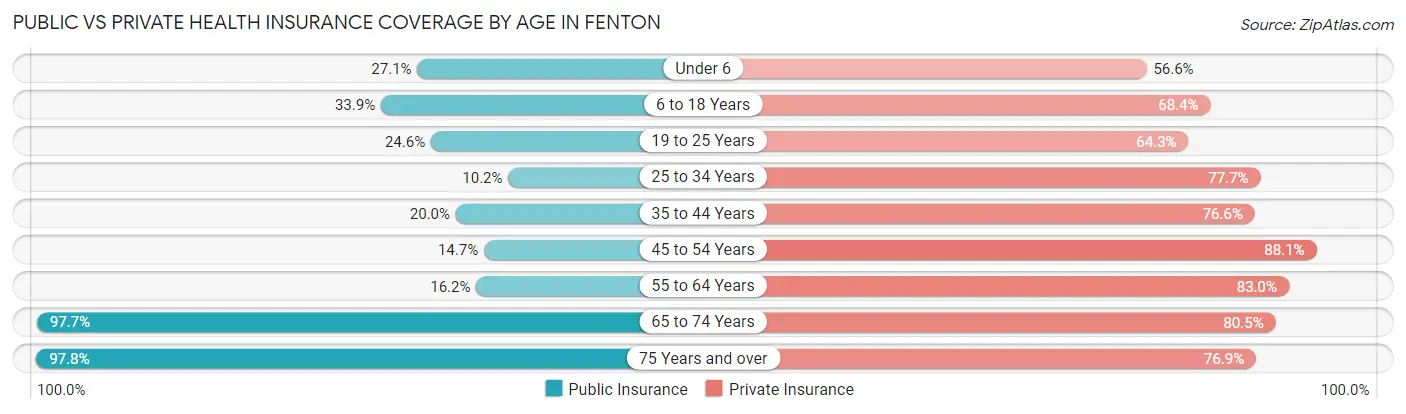
| Age Bracket | Public Insurance | Private Insurance |
| Under 6 | 217 (27.1%) | 453 (56.6%) |
| 6 to 18 Years | 661 (33.9%) | 1,336 (68.4%) |
| 19 to 25 Years | 259 (24.6%) | 678 (64.3%) |
| 25 to 34 Years | 188 (10.2%) | 1,431 (77.7%) |
| 35 to 44 Years | 316 (20.0%) | 1,214 (76.6%) |
| 45 to 54 Years | 220 (14.7%) | 1,316 (88.1%) |
| 55 to 64 Years | 203 (16.2%) | 1,042 (83.0%) |
| 65 to 74 Years | 1,117 (97.7%) | 920 (80.5%) |
| 75 Years and over | 677 (97.8%) | 532 (76.9%) |
| Total | 3,858 (32.6%) | 8,922 (75.5%) |
Disability Status by Sex by Age in Fenton
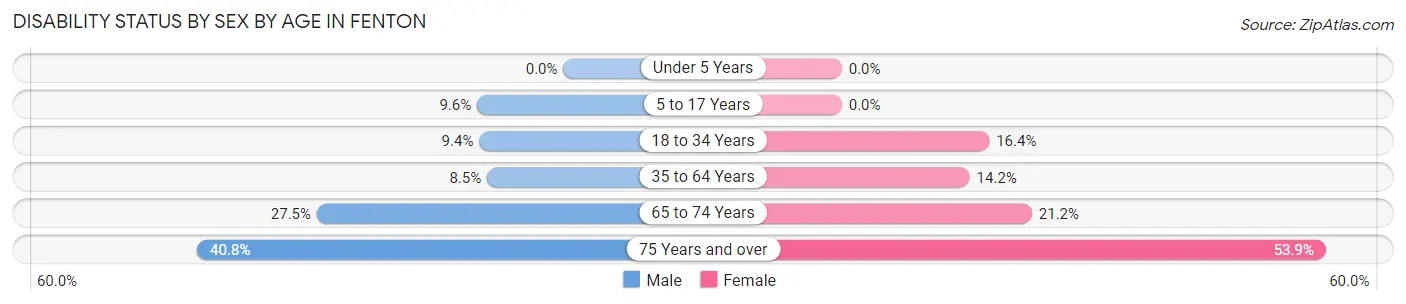
| Age Bracket | Male | Female |
| Under 5 Years | 0 (0.0%) | 0 (0.0%) |
| 5 to 17 Years | 74 (9.6%) | 0 (0.0%) |
| 18 to 34 Years | 135 (9.4%) | 261 (16.4%) |
| 35 to 64 Years | 175 (8.5%) | 324 (14.2%) |
| 65 to 74 Years | 140 (27.5%) | 134 (21.2%) |
| 75 Years and over | 62 (40.8%) | 291 (53.9%) |
Disability Class by Sex by Age in Fenton
Disability Class: Hearing Difficulty
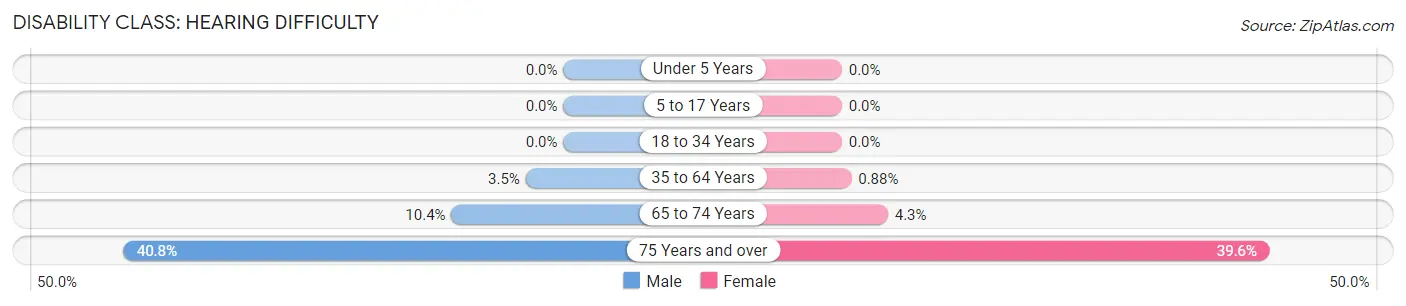
| Age Bracket | Male | Female |
| Under 5 Years | 0 (0.0%) | 0 (0.0%) |
| 5 to 17 Years | 0 (0.0%) | 0 (0.0%) |
| 18 to 34 Years | 0 (0.0%) | 0 (0.0%) |
| 35 to 64 Years | 72 (3.5%) | 20 (0.9%) |
| 65 to 74 Years | 53 (10.4%) | 27 (4.3%) |
| 75 Years and over | 62 (40.8%) | 214 (39.6%) |
Disability Class: Vision Difficulty
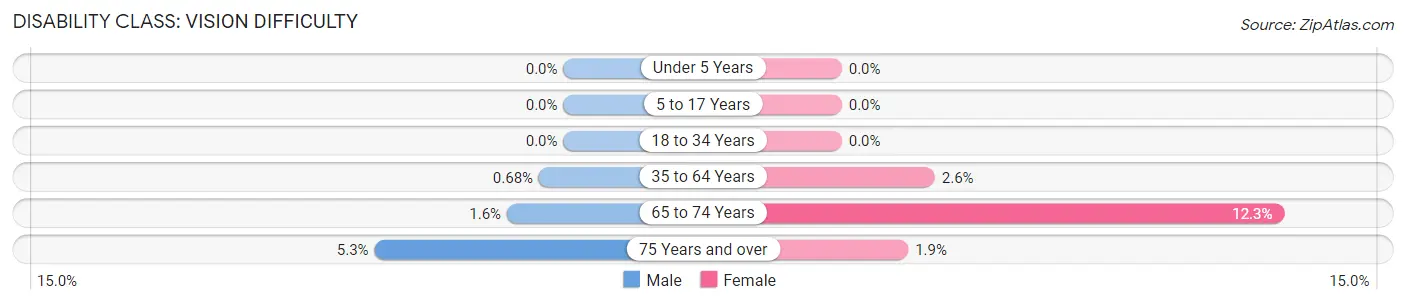
| Age Bracket | Male | Female |
| Under 5 Years | 0 (0.0%) | 0 (0.0%) |
| 5 to 17 Years | 0 (0.0%) | 0 (0.0%) |
| 18 to 34 Years | 0 (0.0%) | 0 (0.0%) |
| 35 to 64 Years | 14 (0.7%) | 59 (2.6%) |
| 65 to 74 Years | 8 (1.6%) | 78 (12.3%) |
| 75 Years and over | 8 (5.3%) | 10 (1.8%) |
Disability Class: Cognitive Difficulty
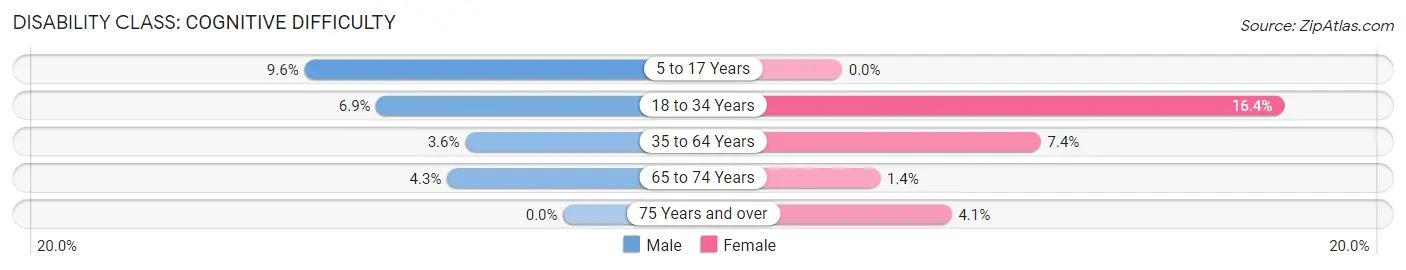
| Age Bracket | Male | Female |
| 5 to 17 Years | 74 (9.6%) | 0 (0.0%) |
| 18 to 34 Years | 100 (6.9%) | 261 (16.4%) |
| 35 to 64 Years | 75 (3.6%) | 168 (7.4%) |
| 65 to 74 Years | 22 (4.3%) | 9 (1.4%) |
| 75 Years and over | 0 (0.0%) | 22 (4.1%) |
Disability Class: Ambulatory Difficulty
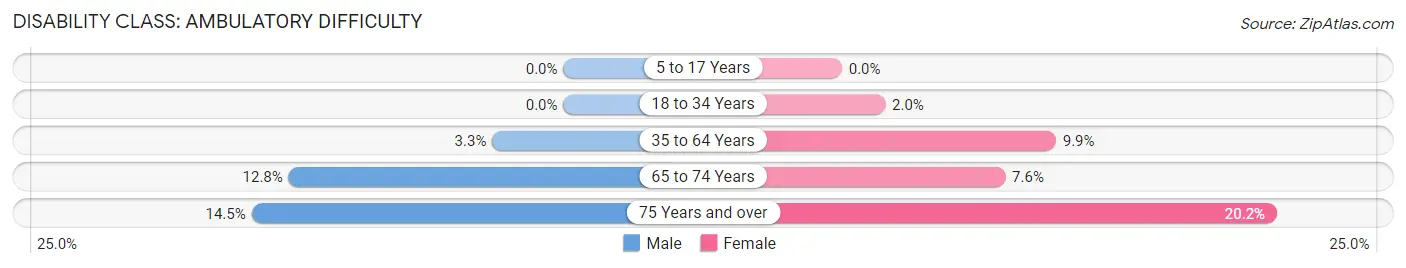
| Age Bracket | Male | Female |
| 5 to 17 Years | 0 (0.0%) | 0 (0.0%) |
| 18 to 34 Years | 0 (0.0%) | 32 (2.0%) |
| 35 to 64 Years | 68 (3.3%) | 226 (9.9%) |
| 65 to 74 Years | 65 (12.8%) | 48 (7.6%) |
| 75 Years and over | 22 (14.5%) | 109 (20.2%) |
Disability Class: Self-Care Difficulty
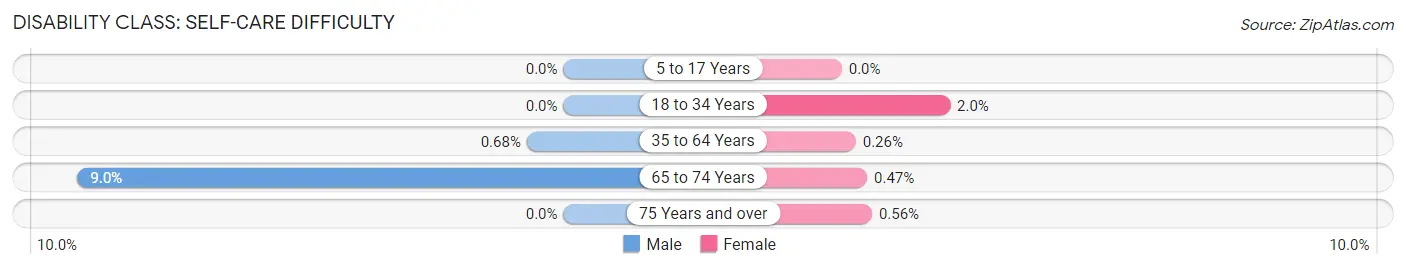
| Age Bracket | Male | Female |
| 5 to 17 Years | 0 (0.0%) | 0 (0.0%) |
| 18 to 34 Years | 0 (0.0%) | 32 (2.0%) |
| 35 to 64 Years | 14 (0.7%) | 6 (0.3%) |
| 65 to 74 Years | 46 (9.0%) | 3 (0.5%) |
| 75 Years and over | 0 (0.0%) | 3 (0.6%) |
Technology Access in Fenton
Computing Device Access in Fenton
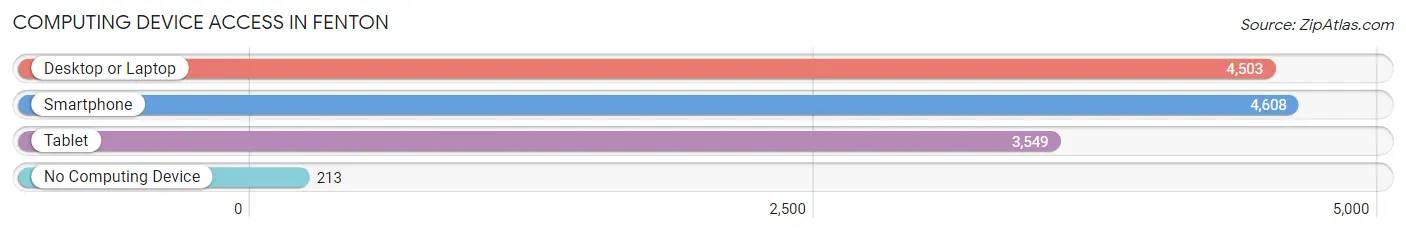
| Device Type | # Households | % Households |
| Desktop or Laptop | 4,503 | 86.4% |
| Smartphone | 4,608 | 88.4% |
| Tablet | 3,549 | 68.1% |
| No Computing Device | 213 | 4.1% |
| Total | 5,212 | 100.0% |
Internet Access in Fenton
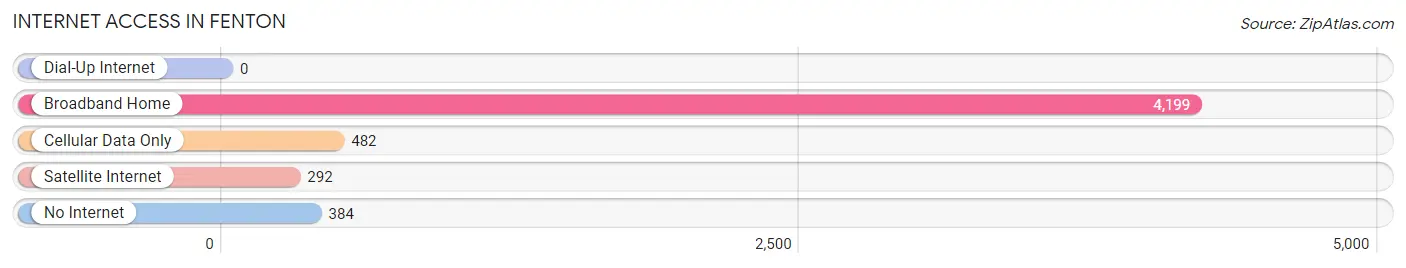
| Internet Type | # Households | % Households |
| Dial-Up Internet | 0 | 0.0% |
| Broadband Home | 4,199 | 80.6% |
| Cellular Data Only | 482 | 9.2% |
| Satellite Internet | 292 | 5.6% |
| No Internet | 384 | 7.4% |
| Total | 5,212 | 100.0% |
Fenton Summary
Fenton, Michigan is a small city located in Genesee County, Michigan. It is situated on the banks of the Shiawassee River, about 25 miles northwest of Detroit. The city has a population of 11,756, according to the 2010 census.
History
Fenton was first settled in 1834 by William Fenton, a settler from New York. He purchased land from the government and built a log cabin on the banks of the Shiawassee River. The settlement was originally known as Fentonville, but the name was changed to Fenton in 1837.
The city was incorporated in 1849 and grew rapidly in the late 19th century. It became a popular summer resort destination for wealthy Detroiters, who built large homes along the river. The city was also home to several factories, including a paper mill, a flour mill, and a furniture factory.
Geography
Fenton is located in southeastern Michigan, about 25 miles northwest of Detroit. It is situated on the banks of the Shiawassee River, which flows through the city. The city is surrounded by rolling hills and farmland.
The climate in Fenton is humid continental, with hot summers and cold winters. The average annual temperature is around 50 degrees Fahrenheit.
Economy
Fenton’s economy is largely based on manufacturing and retail. The city is home to several factories, including a paper mill, a flour mill, and a furniture factory. It is also home to several retail stores, including a Walmart Supercenter and a Meijer.
The city is also home to several small businesses, including restaurants, bars, and shops. The city is also home to several medical facilities, including a hospital and several clinics.
Demographics
Fenton has a population of 11,756, according to the 2010 census. The population is largely white (90.3%), with small percentages of African American (3.3%), Asian (2.2%), and Hispanic (2.2%) residents.
The median household income in Fenton is $50,845, and the median home value is $150,000. The city has a poverty rate of 11.3%.
Conclusion
Fenton, Michigan is a small city located in Genesee County, Michigan. It is situated on the banks of the Shiawassee River, about 25 miles northwest of Detroit. The city has a population of 11,756, according to the 2010 census. Fenton’s economy is largely based on manufacturing and retail, and the city is home to several factories, retail stores, and small businesses. The population is largely white, with small percentages of African American, Asian, and Hispanic residents. The median household income in Fenton is $50,845, and the median home value is $150,000.
Common Questions
What is Per Capita Income in Fenton?
Per Capita income in Fenton is $41,682.
What is the Median Family Income in Fenton?
Median Family Income in Fenton is $104,128.
What is the Median Household income in Fenton?
Median Household Income in Fenton is $76,195.
What is Income or Wage Gap in Fenton?
Income or Wage Gap in Fenton is 19.9%.
Women in Fenton earn 80.1 cents for every dollar earned by a man.
What is Inequality or Gini Index in Fenton?
Inequality or Gini Index in Fenton is 0.42.
What is the Total Population of Fenton?
Total Population of Fenton is 11,967.
What is the Total Male Population of Fenton?
Total Male Population of Fenton is 5,363.
What is the Total Female Population of Fenton?
Total Female Population of Fenton is 6,604.
What is the Ratio of Males per 100 Females in Fenton?
There are 81.21 Males per 100 Females in Fenton.
What is the Ratio of Females per 100 Males in Fenton?
There are 123.14 Females per 100 Males in Fenton.
What is the Median Population Age in Fenton?
Median Population Age in Fenton is 38.1 Years.
What is the Average Family Size in Fenton
Average Family Size in Fenton is 2.9 People.
What is the Average Household Size in Fenton
Average Household Size in Fenton is 2.3 People.
How Large is the Labor Force in Fenton?
There are 6,569 People in the Labor Forcein in Fenton.
What is the Percentage of People in the Labor Force in Fenton?
67.7% of People are in the Labor Force in Fenton.
What is the Unemployment Rate in Fenton?
Unemployment Rate in Fenton is 4.7%.