East Lansing, MI Map & Demographics
East Lansing Map
East Lansing Overview
$29,297
PER CAPITA INCOME
$121,250
AVG FAMILY INCOME
$44,094
AVG HOUSEHOLD INCOME
24.7%
WAGE / INCOME GAP [ % ]
75.3¢/ $1
WAGE / INCOME GAP [ $ ]
$7,025
FAMILY INCOME DEFICIT
0.60
INEQUALITY / GINI INDEX
45,403
TOTAL POPULATION
22,307
MALE POPULATION
23,096
FEMALE POPULATION
96.58
MALES / 100 FEMALES
103.54
FEMALES / 100 MALES
21.4
MEDIAN AGE
2.9
AVG FAMILY SIZE
2.2
AVG HOUSEHOLD SIZE
23,650
LABOR FORCE [ PEOPLE ]
56.3%
PERCENT IN LABOR FORCE
6.7%
UNEMPLOYMENT RATE
East Lansing Area Codes
Income in East Lansing
Income Overview in East Lansing
Per Capita Income in East Lansing is $29,297, while median incomes of families and households are $121,250 and $44,094 respectively.
| Characteristic | Number | Measure |
| Per Capita Income | 45,403 | $29,297 |
| Median Family Income | 4,749 | $121,250 |
| Mean Family Income | 4,749 | $168,885 |
| Median Household Income | 13,865 | $44,094 |
| Mean Household Income | 13,865 | $86,258 |
| Income Deficit | 4,749 | $7,025 |
| Wage / Income Gap (%) | 45,403 | 24.72% |
| Wage / Income Gap ($) | 45,403 | 75.28¢ per $1 |
| Gini / Inequality Index | 45,403 | 0.60 |
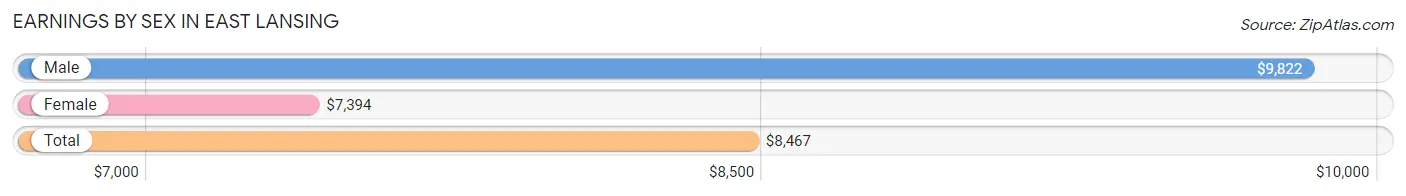
Earnings by Sex in East Lansing
Average Earnings in East Lansing are $8,467, $9,822 for men and $7,394 for women, a difference of 24.7%.
| Sex | Number | Average Earnings |
| Male | 15,685 (47.5%) | $9,822 |
| Female | 17,331 (52.5%) | $7,394 |
| Total | 33,016 (100.0%) | $8,467 |
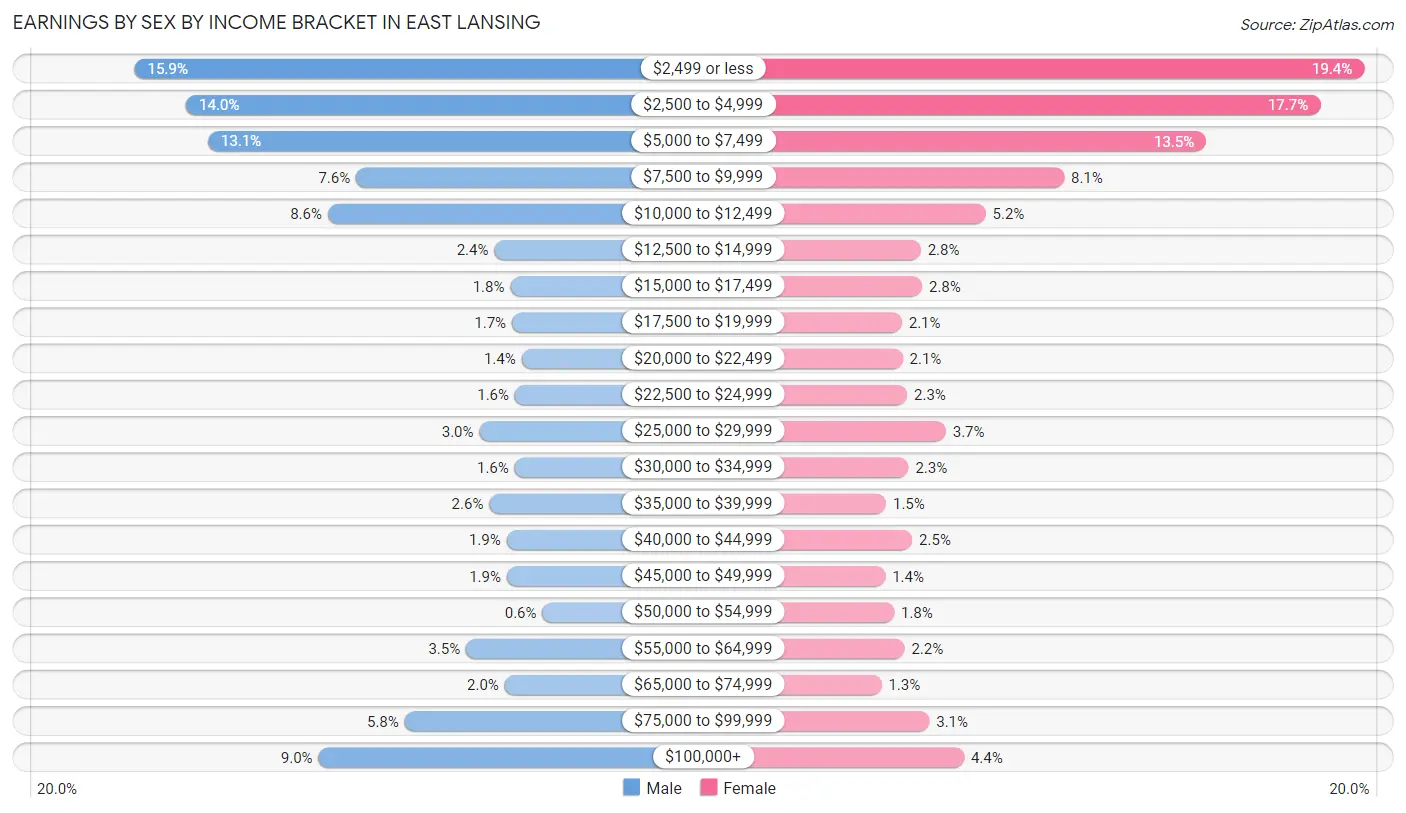
Earnings by Sex by Income Bracket in East Lansing
The most common earnings brackets in East Lansing are $2,499 or less for men (2,490 | 15.9%) and $2,499 or less for women (3,359 | 19.4%).
| Income | Male | Female |
| $2,499 or less | 2,490 (15.9%) | 3,359 (19.4%) |
| $2,500 to $4,999 | 2,188 (14.0%) | 3,072 (17.7%) |
| $5,000 to $7,499 | 2,060 (13.1%) | 2,333 (13.5%) |
| $7,500 to $9,999 | 1,189 (7.6%) | 1,411 (8.1%) |
| $10,000 to $12,499 | 1,355 (8.6%) | 902 (5.2%) |
| $12,500 to $14,999 | 376 (2.4%) | 480 (2.8%) |
| $15,000 to $17,499 | 282 (1.8%) | 488 (2.8%) |
| $17,500 to $19,999 | 273 (1.7%) | 357 (2.1%) |
| $20,000 to $22,499 | 217 (1.4%) | 363 (2.1%) |
| $22,500 to $24,999 | 255 (1.6%) | 392 (2.3%) |
| $25,000 to $29,999 | 464 (3.0%) | 643 (3.7%) |
| $30,000 to $34,999 | 257 (1.6%) | 401 (2.3%) |
| $35,000 to $39,999 | 407 (2.6%) | 254 (1.5%) |
| $40,000 to $44,999 | 304 (1.9%) | 424 (2.5%) |
| $45,000 to $49,999 | 303 (1.9%) | 250 (1.4%) |
| $50,000 to $54,999 | 94 (0.6%) | 307 (1.8%) |
| $55,000 to $64,999 | 543 (3.5%) | 375 (2.2%) |
| $65,000 to $74,999 | 315 (2.0%) | 225 (1.3%) |
| $75,000 to $99,999 | 903 (5.8%) | 535 (3.1%) |
| $100,000+ | 1,410 (9.0%) | 760 (4.4%) |
| Total | 15,685 (100.0%) | 17,331 (100.0%) |
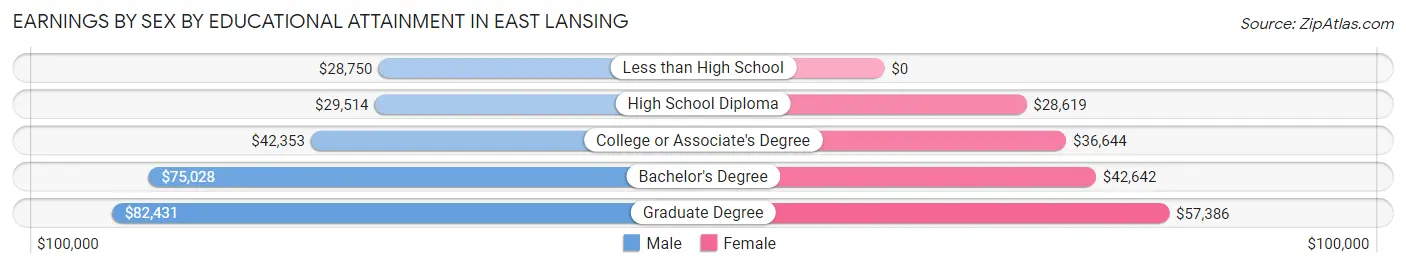
Earnings by Sex by Educational Attainment in East Lansing
Average earnings in East Lansing are $62,723 for men and $44,895 for women, a difference of 28.4%. Men with an educational attainment of graduate degree enjoy the highest average annual earnings of $82,431, while those with less than high school education earn the least with $28,750. Women with an educational attainment of graduate degree earn the most with the average annual earnings of $57,386, while those with high school diploma education have the smallest earnings of $28,619.
| Educational Attainment | Male Income | Female Income |
| Less than High School | $28,750 | $0 |
| High School Diploma | $29,514 | $28,619 |
| College or Associate's Degree | $42,353 | $36,644 |
| Bachelor's Degree | $75,028 | $42,642 |
| Graduate Degree | $82,431 | $57,386 |
| Total | $62,723 | $44,895 |
Family Income in East Lansing
Family Income Brackets in East Lansing
According to the East Lansing family income data, there are 1,159 families falling into the $100,000 to $149,999 income range, which is the most common income bracket and makes up 24.4% of all families. Conversely, the $10,000 to $14,999 income bracket is the least frequent group with only 76 families (1.6%) belonging to this category.
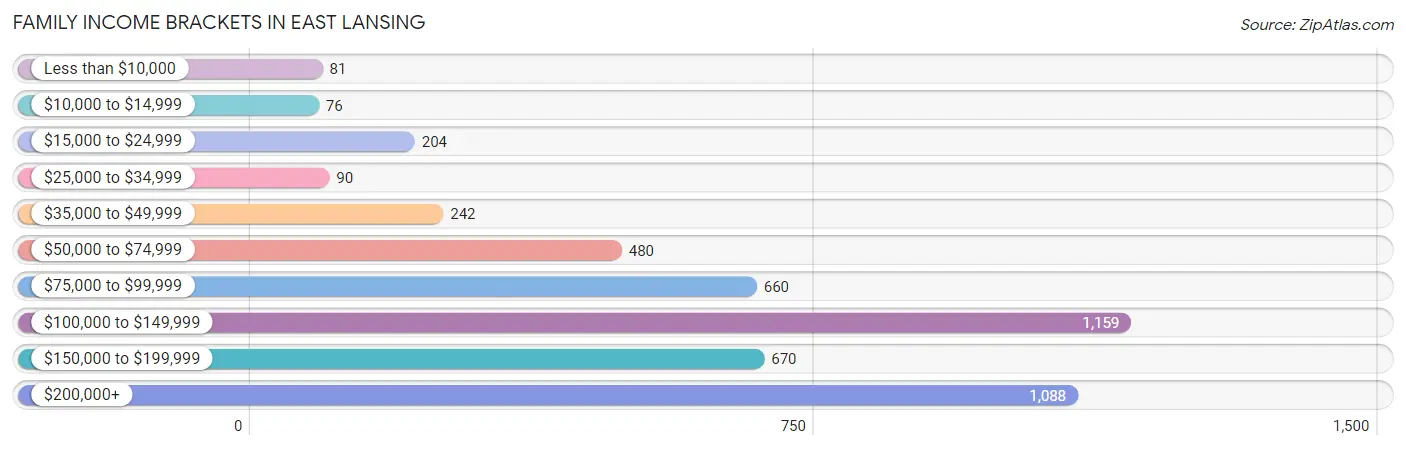
| Income Bracket | # Families | % Families |
| Less than $10,000 | 81 | 1.7% |
| $10,000 to $14,999 | 76 | 1.6% |
| $15,000 to $24,999 | 204 | 4.3% |
| $25,000 to $34,999 | 90 | 1.9% |
| $35,000 to $49,999 | 242 | 5.1% |
| $50,000 to $74,999 | 480 | 10.1% |
| $75,000 to $99,999 | 660 | 13.9% |
| $100,000 to $149,999 | 1,159 | 24.4% |
| $150,000 to $199,999 | 670 | 14.1% |
| $200,000+ | 1,088 | 22.9% |
Family Income by Famaliy Size in East Lansing
6-person families (121 | 2.5%) account for the highest median family income in East Lansing with $186,417 per family, while 2-person families (2,513 | 52.9%) have the highest median income of $56,090 per family member.
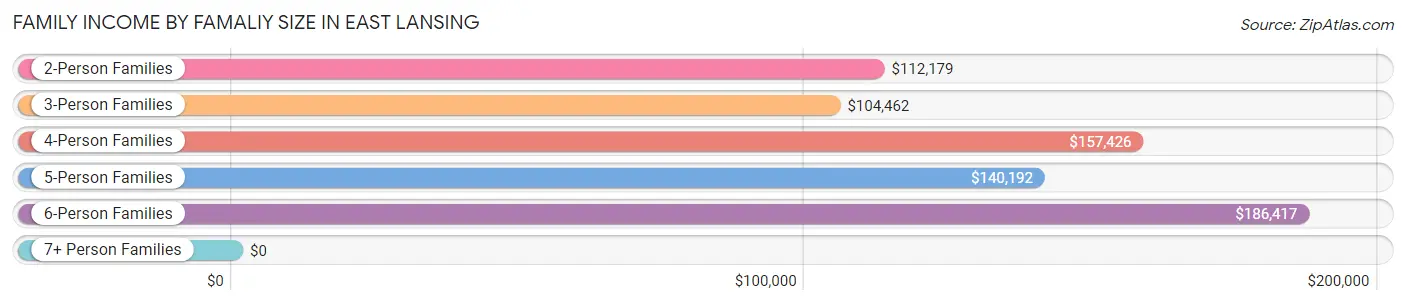
| Income Bracket | # Families | Median Income |
| 2-Person Families | 2,513 (52.9%) | $112,179 |
| 3-Person Families | 1,076 (22.7%) | $104,462 |
| 4-Person Families | 792 (16.7%) | $157,426 |
| 5-Person Families | 220 (4.6%) | $140,192 |
| 6-Person Families | 121 (2.5%) | $186,417 |
| 7+ Person Families | 27 (0.6%) | $0 |
| Total | 4,749 (100.0%) | $121,250 |
Family Income by Number of Earners in East Lansing
The median family income in East Lansing is $121,250, with families comprising 3+ earners (298) having the highest median family income of $157,037, while families with 1 earner (1,307) have the lowest median family income of $81,607, accounting for 6.3% and 27.5% of families, respectively.
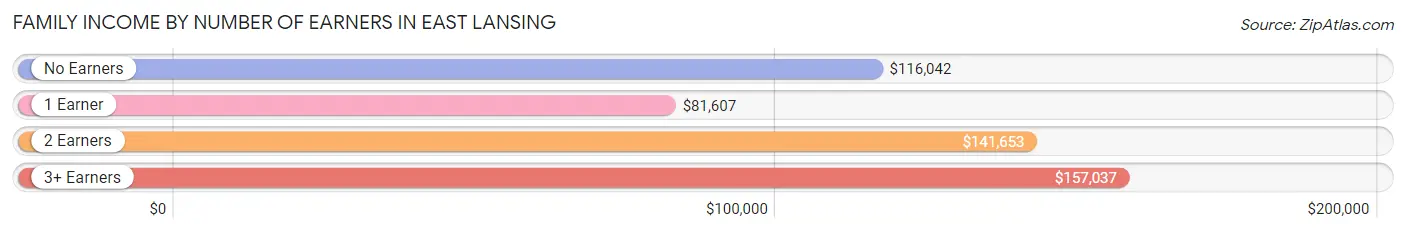
| Number of Earners | # Families | Median Income |
| No Earners | 693 (14.6%) | $116,042 |
| 1 Earner | 1,307 (27.5%) | $81,607 |
| 2 Earners | 2,451 (51.6%) | $141,653 |
| 3+ Earners | 298 (6.3%) | $157,037 |
| Total | 4,749 (100.0%) | $121,250 |
Household Income in East Lansing
Household Income Brackets in East Lansing
With 2,066 households falling in the category, the less than $10,000 income range is the most frequent in East Lansing, accounting for 14.9% of all households. In contrast, only 887 households (6.4%) fall into the $150,000 to $199,999 income bracket, making it the least populous group.
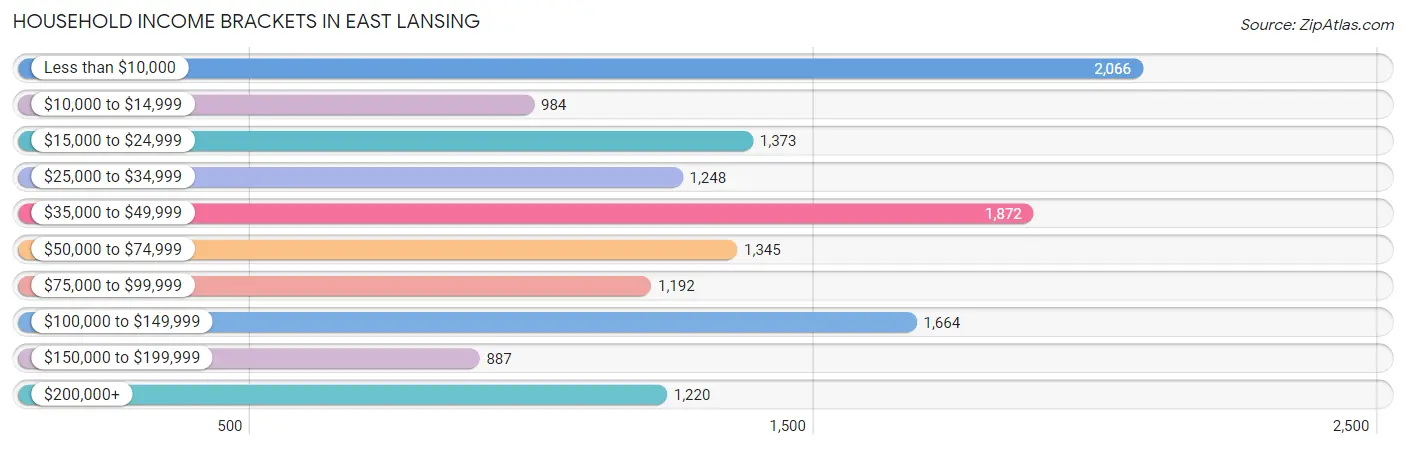
| Income Bracket | # Households | % Households |
| Less than $10,000 | 2,066 | 14.9% |
| $10,000 to $14,999 | 984 | 7.1% |
| $15,000 to $24,999 | 1,373 | 9.9% |
| $25,000 to $34,999 | 1,248 | 9.0% |
| $35,000 to $49,999 | 1,872 | 13.5% |
| $50,000 to $74,999 | 1,345 | 9.7% |
| $75,000 to $99,999 | 1,192 | 8.6% |
| $100,000 to $149,999 | 1,664 | 12.0% |
| $150,000 to $199,999 | 887 | 6.4% |
| $200,000+ | 1,220 | 8.8% |
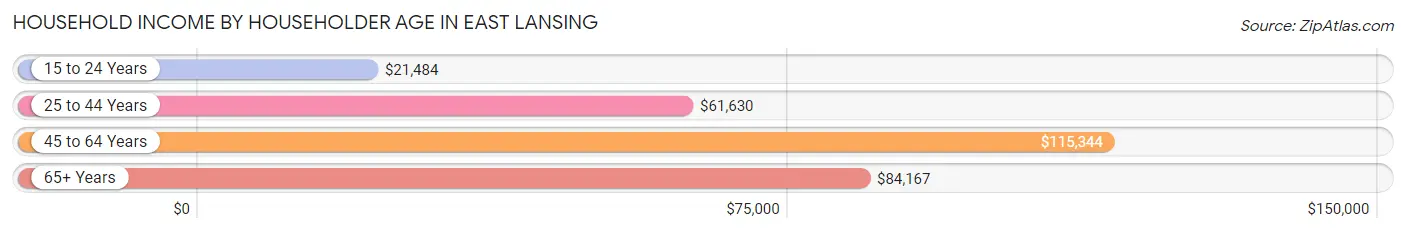
Household Income by Householder Age in East Lansing
The median household income in East Lansing is $44,094, with the highest median household income of $115,344 found in the 45 to 64 years age bracket for the primary householder. A total of 2,321 households (16.7%) fall into this category. Meanwhile, the 15 to 24 years age bracket for the primary householder has the lowest median household income of $21,484, with 5,382 households (38.8%) in this group.
| Income Bracket | # Households | Median Income |
| 15 to 24 Years | 5,382 (38.8%) | $21,484 |
| 25 to 44 Years | 3,630 (26.2%) | $61,630 |
| 45 to 64 Years | 2,321 (16.7%) | $115,344 |
| 65+ Years | 2,532 (18.3%) | $84,167 |
| Total | 13,865 (100.0%) | $44,094 |
Poverty in East Lansing
Income Below Poverty by Sex and Age in East Lansing
With 36.7% poverty level for males and 31.8% for females among the residents of East Lansing, 18 to 24 year old males and 18 to 24 year old females are the most vulnerable to poverty, with 4,547 males (73.6%) and 4,106 females (64.0%) in their respective age groups living below the poverty level.
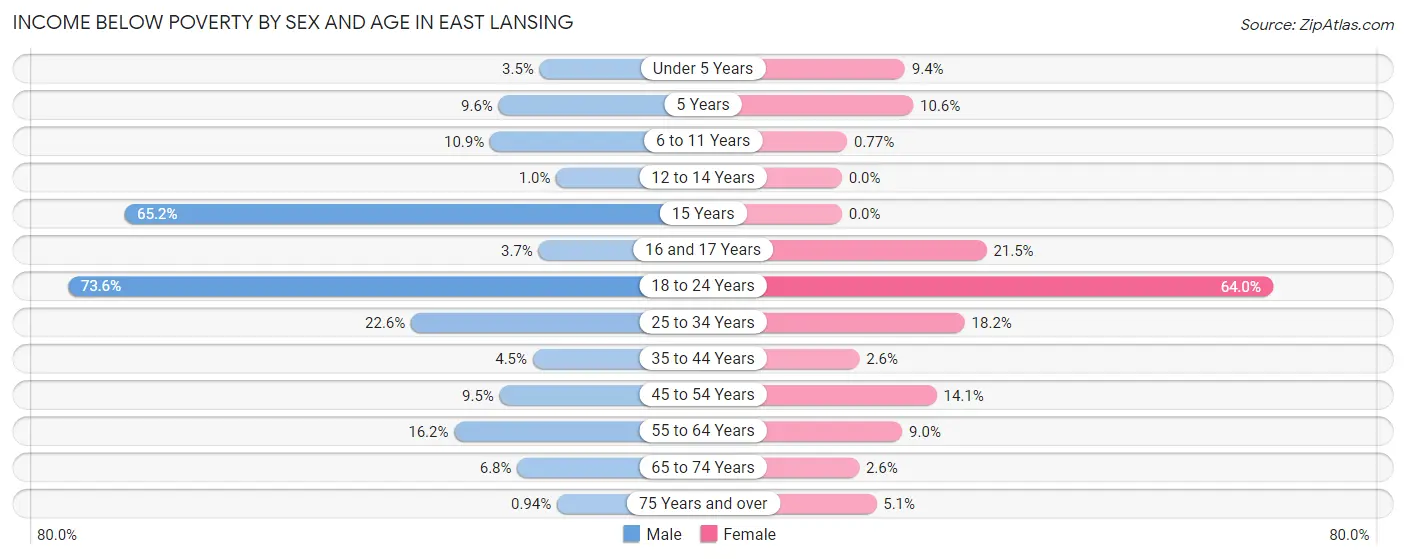
| Age Bracket | Male | Female |
| Under 5 Years | 20 (3.5%) | 35 (9.4%) |
| 5 Years | 17 (9.6%) | 9 (10.6%) |
| 6 to 11 Years | 83 (10.9%) | 6 (0.8%) |
| 12 to 14 Years | 2 (1.0%) | 0 (0.0%) |
| 15 Years | 75 (65.2%) | 0 (0.0%) |
| 16 and 17 Years | 7 (3.7%) | 55 (21.5%) |
| 18 to 24 Years | 4,547 (73.6%) | 4,106 (64.0%) |
| 25 to 34 Years | 520 (22.6%) | 316 (18.2%) |
| 35 to 44 Years | 55 (4.5%) | 31 (2.6%) |
| 45 to 54 Years | 108 (9.5%) | 170 (14.1%) |
| 55 to 64 Years | 124 (16.2%) | 84 (9.0%) |
| 65 to 74 Years | 66 (6.8%) | 29 (2.5%) |
| 75 Years and over | 7 (0.9%) | 48 (5.1%) |
| Total | 5,631 (36.7%) | 4,889 (31.8%) |
Income Above Poverty by Sex and Age in East Lansing
According to the poverty statistics in East Lansing, males aged 75 years and over and females aged 12 to 14 years are the age groups that are most secure financially, with 99.1% of males and 100.0% of females in these age groups living above the poverty line.
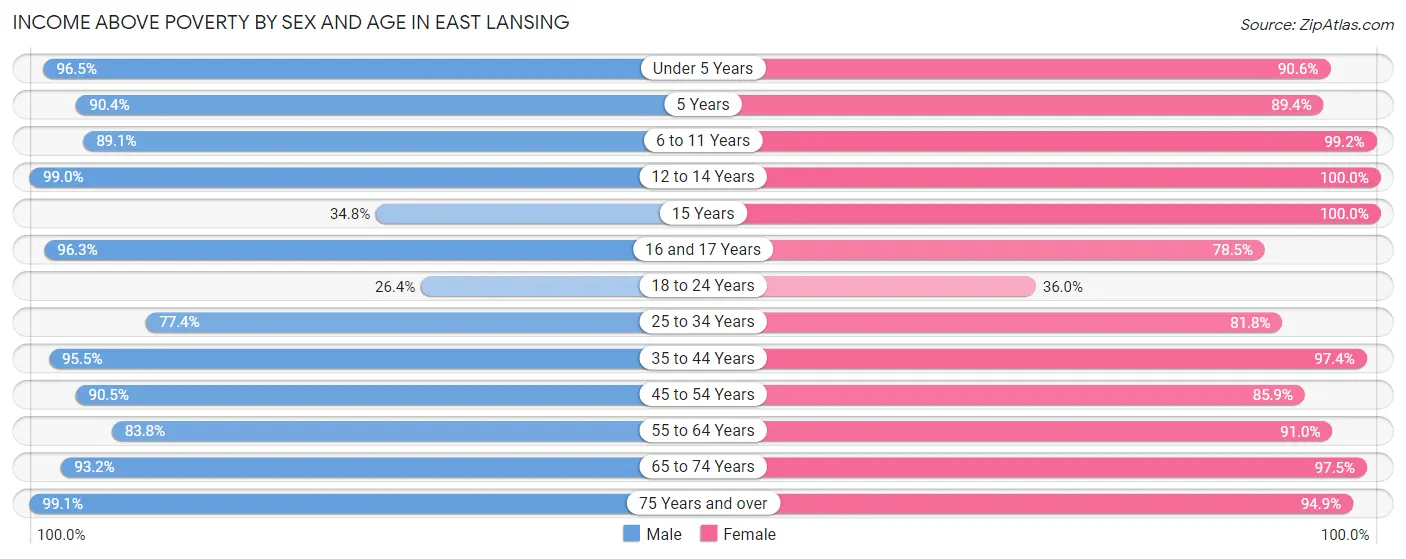
| Age Bracket | Male | Female |
| Under 5 Years | 549 (96.5%) | 339 (90.6%) |
| 5 Years | 160 (90.4%) | 76 (89.4%) |
| 6 to 11 Years | 680 (89.1%) | 770 (99.2%) |
| 12 to 14 Years | 191 (99.0%) | 270 (100.0%) |
| 15 Years | 40 (34.8%) | 44 (100.0%) |
| 16 and 17 Years | 184 (96.3%) | 201 (78.5%) |
| 18 to 24 Years | 1,633 (26.4%) | 2,311 (36.0%) |
| 25 to 34 Years | 1,780 (77.4%) | 1,416 (81.8%) |
| 35 to 44 Years | 1,160 (95.5%) | 1,162 (97.4%) |
| 45 to 54 Years | 1,034 (90.5%) | 1,038 (85.9%) |
| 55 to 64 Years | 642 (83.8%) | 854 (91.0%) |
| 65 to 74 Years | 900 (93.2%) | 1,110 (97.5%) |
| 75 Years and over | 737 (99.1%) | 890 (94.9%) |
| Total | 9,690 (63.2%) | 10,481 (68.2%) |
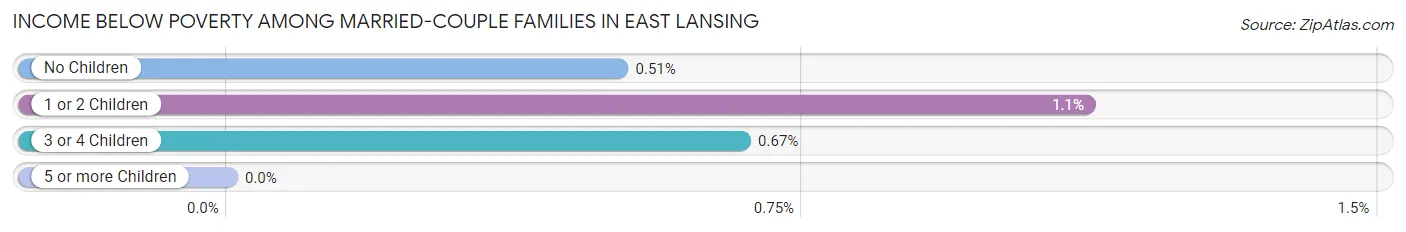
Income Below Poverty Among Married-Couple Families in East Lansing
The poverty statistics for married-couple families in East Lansing show that 0.7% or 27 of the total 3,699 families live below the poverty line. Families with 1 or 2 children have the highest poverty rate of 1.1%, comprising of 14 families. On the other hand, families with 5 or more children have the lowest poverty rate of 0.0%, which includes 0 families.
| Children | Above Poverty | Below Poverty |
| No Children | 2,126 (99.5%) | 11 (0.5%) |
| 1 or 2 Children | 1,239 (98.9%) | 14 (1.1%) |
| 3 or 4 Children | 296 (99.3%) | 2 (0.7%) |
| 5 or more Children | 11 (100.0%) | 0 (0.0%) |
| Total | 3,672 (99.3%) | 27 (0.7%) |
Income Below Poverty Among Single-Parent Households in East Lansing
According to the poverty data in East Lansing, 18.9% or 86 single-father households and 37.4% or 223 single-mother households are living below the poverty line. Among single-father households, those with no children have the highest poverty rate, with 54 households (21.7%) experiencing poverty. Likewise, among single-mother households, those with 1 or 2 children have the highest poverty rate, with 150 households (51.5%) falling below the poverty line.
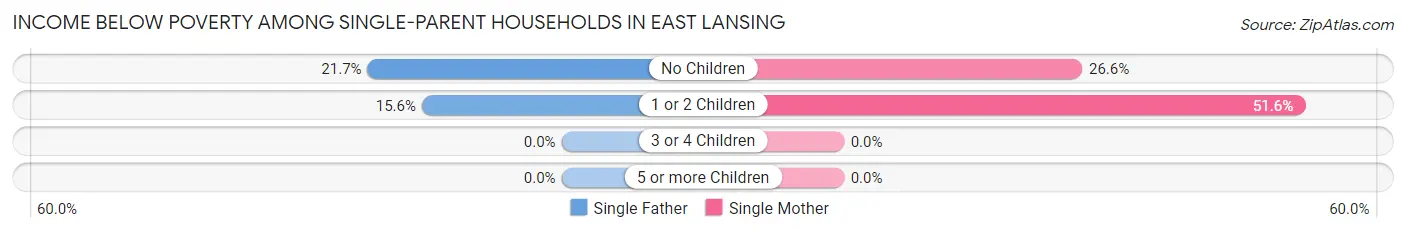
| Children | Single Father | Single Mother |
| No Children | 54 (21.7%) | 73 (26.6%) |
| 1 or 2 Children | 32 (15.6%) | 150 (51.5%) |
| 3 or 4 Children | 0 (0.0%) | 0 (0.0%) |
| 5 or more Children | 0 (0.0%) | 0 (0.0%) |
| Total | 86 (18.9%) | 223 (37.4%) |
Income Below Poverty Among Married-Couple vs Single-Parent Households in East Lansing
The poverty data for East Lansing shows that 27 of the married-couple family households (0.7%) and 309 of the single-parent households (29.4%) are living below the poverty level. Within the married-couple family households, those with 1 or 2 children have the highest poverty rate, with 14 households (1.1%) falling below the poverty line. Among the single-parent households, those with 1 or 2 children have the highest poverty rate, with 182 household (36.7%) living below poverty.
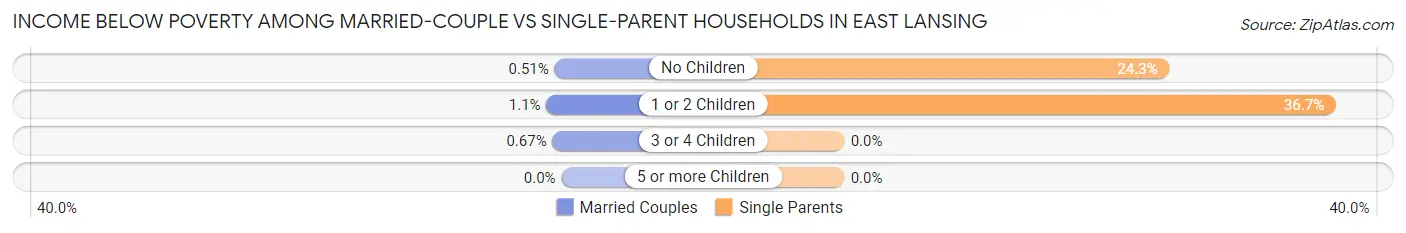
| Children | Married-Couple Families | Single-Parent Households |
| No Children | 11 (0.5%) | 127 (24.3%) |
| 1 or 2 Children | 14 (1.1%) | 182 (36.7%) |
| 3 or 4 Children | 2 (0.7%) | 0 (0.0%) |
| 5 or more Children | 0 (0.0%) | 0 (0.0%) |
| Total | 27 (0.7%) | 309 (29.4%) |
Race in East Lansing
The most populous races in East Lansing are White / Caucasian (34,455 | 75.9%), Asian (4,196 | 9.2%), and Black / African American (3,383 | 7.4%).
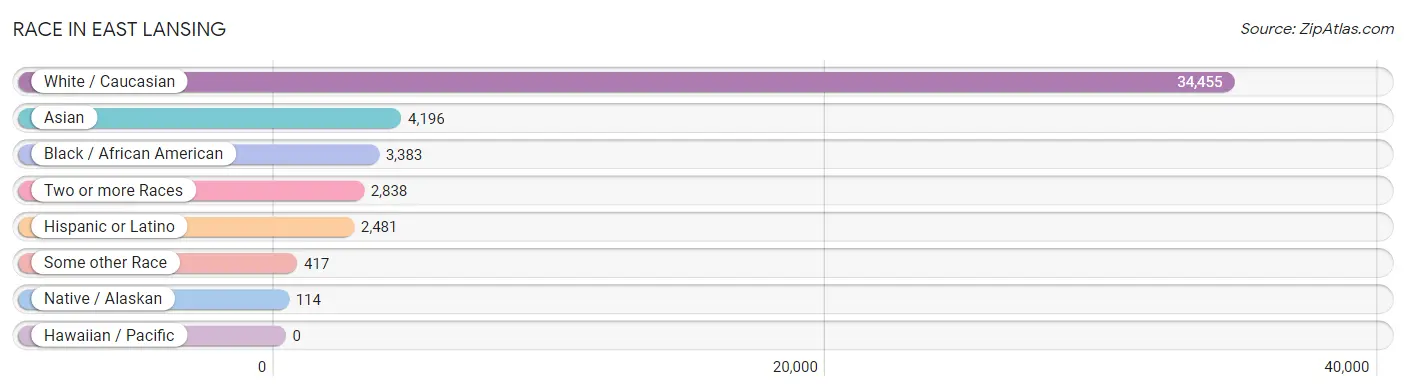
| Race | # Population | % Population |
| Asian | 4,196 | 9.2% |
| Black / African American | 3,383 | 7.4% |
| Hawaiian / Pacific | 0 | 0.0% |
| Hispanic or Latino | 2,481 | 5.5% |
| Native / Alaskan | 114 | 0.3% |
| White / Caucasian | 34,455 | 75.9% |
| Two or more Races | 2,838 | 6.2% |
| Some other Race | 417 | 0.9% |
| Total | 45,403 | 100.0% |
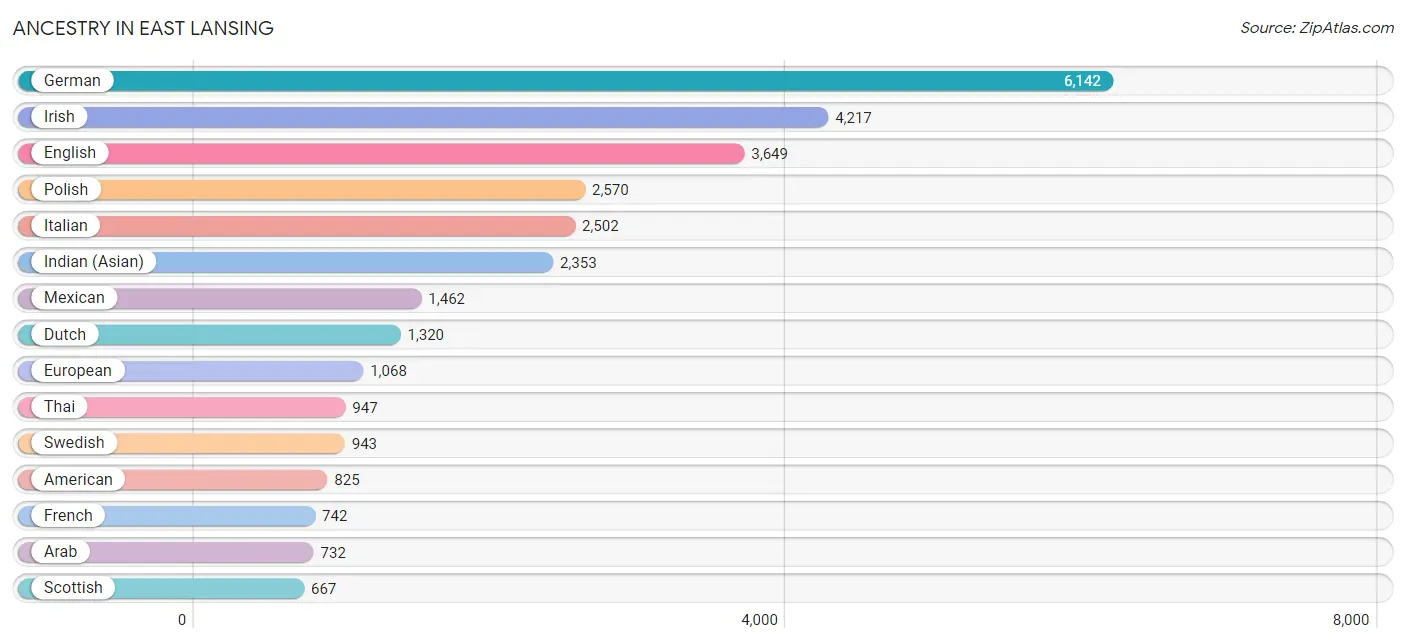
Ancestry in East Lansing
The most populous ancestries reported in East Lansing are German (6,142 | 13.5%), Irish (4,217 | 9.3%), English (3,649 | 8.0%), Polish (2,570 | 5.7%), and Italian (2,502 | 5.5%), together accounting for 42.0% of all East Lansing residents.
| Ancestry | # Population | % Population |
| Afghan | 7 | 0.0% |
| African | 168 | 0.4% |
| Alaska Native | 11 | 0.0% |
| Albanian | 10 | 0.0% |
| American | 825 | 1.8% |
| Apache | 19 | 0.0% |
| Arab | 732 | 1.6% |
| Argentinean | 110 | 0.2% |
| Armenian | 157 | 0.4% |
| Assyrian / Chaldean / Syriac | 77 | 0.2% |
| Australian | 41 | 0.1% |
| Austrian | 165 | 0.4% |
| Bangladeshi | 16 | 0.0% |
| Belgian | 89 | 0.2% |
| Bhutanese | 287 | 0.6% |
| Blackfeet | 3 | 0.0% |
| Brazilian | 29 | 0.1% |
| British | 489 | 1.1% |
| Bulgarian | 71 | 0.2% |
| Burmese | 525 | 1.2% |
| Cambodian | 5 | 0.0% |
| Canadian | 125 | 0.3% |
| Central American | 109 | 0.2% |
| Cherokee | 90 | 0.2% |
| Chilean | 25 | 0.1% |
| Chippewa | 77 | 0.2% |
| Colombian | 29 | 0.1% |
| Costa Rican | 35 | 0.1% |
| Croatian | 93 | 0.2% |
| Cuban | 120 | 0.3% |
| Cypriot | 9 | 0.0% |
| Czech | 225 | 0.5% |
| Czechoslovakian | 23 | 0.1% |
| Danish | 214 | 0.5% |
| Dominican | 25 | 0.1% |
| Dutch | 1,320 | 2.9% |
| Eastern European | 118 | 0.3% |
| Ecuadorian | 38 | 0.1% |
| Egyptian | 229 | 0.5% |
| English | 3,649 | 8.0% |
| Ethiopian | 79 | 0.2% |
| European | 1,068 | 2.4% |
| Filipino | 57 | 0.1% |
| Finnish | 175 | 0.4% |
| French | 742 | 1.6% |
| French American Indian | 5 | 0.0% |
| French Canadian | 301 | 0.7% |
| German | 6,142 | 13.5% |
| Ghanaian | 36 | 0.1% |
| Greek | 418 | 0.9% |
| Guamanian / Chamorro | 17 | 0.0% |
| Guatemalan | 47 | 0.1% |
| Honduran | 8 | 0.0% |
| Hungarian | 311 | 0.7% |
| Indian (Asian) | 2,353 | 5.2% |
| Iranian | 81 | 0.2% |
| Iraqi | 123 | 0.3% |
| Irish | 4,217 | 9.3% |
| Italian | 2,502 | 5.5% |
| Jamaican | 16 | 0.0% |
| Japanese | 12 | 0.0% |
| Jordanian | 42 | 0.1% |
| Korean | 224 | 0.5% |
| Laotian | 42 | 0.1% |
| Latvian | 15 | 0.0% |
| Lebanese | 133 | 0.3% |
| Liberian | 12 | 0.0% |
| Lithuanian | 144 | 0.3% |
| Macedonian | 7 | 0.0% |
| Malaysian | 8 | 0.0% |
| Mexican | 1,462 | 3.2% |
| Mexican American Indian | 14 | 0.0% |
| Mongolian | 7 | 0.0% |
| Native Hawaiian | 5 | 0.0% |
| Navajo | 30 | 0.1% |
| Nicaraguan | 4 | 0.0% |
| Nigerian | 141 | 0.3% |
| Northern European | 6 | 0.0% |
| Norwegian | 298 | 0.7% |
| Ottawa | 111 | 0.2% |
| Pakistani | 18 | 0.0% |
| Palestinian | 21 | 0.1% |
| Paraguayan | 1 | 0.0% |
| Peruvian | 77 | 0.2% |
| Polish | 2,570 | 5.7% |
| Portuguese | 24 | 0.1% |
| Puerto Rican | 277 | 0.6% |
| Romanian | 94 | 0.2% |
| Russian | 298 | 0.7% |
| Salvadoran | 15 | 0.0% |
| Scandinavian | 73 | 0.2% |
| Scotch-Irish | 144 | 0.3% |
| Scottish | 667 | 1.5% |
| Serbian | 87 | 0.2% |
| Sioux | 5 | 0.0% |
| Slavic | 46 | 0.1% |
| Slovak | 117 | 0.3% |
| Slovene | 6 | 0.0% |
| Somali | 58 | 0.1% |
| South American | 324 | 0.7% |
| Soviet Union | 16 | 0.0% |
| Spaniard | 64 | 0.1% |
| Sri Lankan | 163 | 0.4% |
| Subsaharan African | 556 | 1.2% |
| Swedish | 943 | 2.1% |
| Swiss | 163 | 0.4% |
| Syrian | 6 | 0.0% |
| Thai | 947 | 2.1% |
| Turkish | 133 | 0.3% |
| Ukrainian | 229 | 0.5% |
| Venezuelan | 44 | 0.1% |
| Vietnamese | 10 | 0.0% |
| Welsh | 307 | 0.7% |
| West Indian | 20 | 0.0% |
| Yugoslavian | 45 | 0.1% | View All 115 Rows |
Immigrants in East Lansing
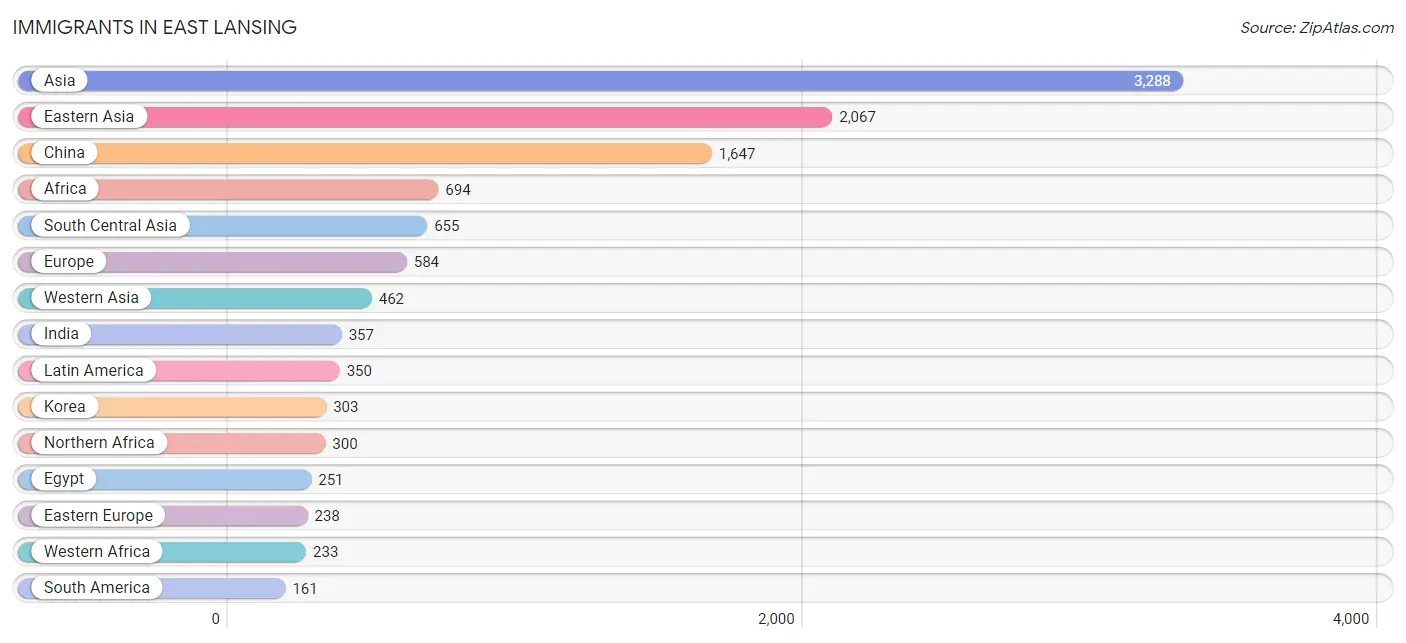
The most numerous immigrant groups reported in East Lansing came from Asia (3,288 | 7.2%), Eastern Asia (2,067 | 4.5%), China (1,647 | 3.6%), Africa (694 | 1.5%), and South Central Asia (655 | 1.4%), together accounting for 18.4% of all East Lansing residents.
| Immigration Origin | # Population | % Population |
| Africa | 694 | 1.5% |
| Argentina | 62 | 0.1% |
| Asia | 3,288 | 7.2% |
| Australia | 8 | 0.0% |
| Bangladesh | 41 | 0.1% |
| Bosnia and Herzegovina | 15 | 0.0% |
| Brazil | 75 | 0.2% |
| Bulgaria | 71 | 0.2% |
| Canada | 141 | 0.3% |
| Caribbean | 60 | 0.1% |
| Central America | 129 | 0.3% |
| China | 1,647 | 3.6% |
| Colombia | 6 | 0.0% |
| Cuba | 20 | 0.0% |
| Denmark | 32 | 0.1% |
| Dominican Republic | 17 | 0.0% |
| Eastern Africa | 116 | 0.3% |
| Eastern Asia | 2,067 | 4.5% |
| Eastern Europe | 238 | 0.5% |
| Egypt | 251 | 0.5% |
| England | 22 | 0.1% |
| Ethiopia | 61 | 0.1% |
| Europe | 584 | 1.3% |
| France | 11 | 0.0% |
| Germany | 111 | 0.2% |
| Ghana | 101 | 0.2% |
| Greece | 44 | 0.1% |
| Honduras | 8 | 0.0% |
| Hong Kong | 47 | 0.1% |
| India | 357 | 0.8% |
| Indonesia | 34 | 0.1% |
| Iran | 64 | 0.1% |
| Iraq | 47 | 0.1% |
| Ireland | 15 | 0.0% |
| Israel | 5 | 0.0% |
| Italy | 32 | 0.1% |
| Jamaica | 23 | 0.1% |
| Japan | 112 | 0.3% |
| Jordan | 19 | 0.0% |
| Kazakhstan | 30 | 0.1% |
| Korea | 303 | 0.7% |
| Latin America | 350 | 0.8% |
| Lebanon | 14 | 0.0% |
| Liberia | 17 | 0.0% |
| Mexico | 117 | 0.3% |
| Middle Africa | 30 | 0.1% |
| Nepal | 81 | 0.2% |
| Netherlands | 17 | 0.0% |
| Nicaragua | 4 | 0.0% |
| Nigeria | 54 | 0.1% |
| Northern Africa | 300 | 0.7% |
| Northern Europe | 131 | 0.3% |
| Norway | 18 | 0.0% |
| Oceania | 8 | 0.0% |
| Pakistan | 66 | 0.2% |
| Philippines | 7 | 0.0% |
| Poland | 28 | 0.1% |
| Romania | 42 | 0.1% |
| Russia | 57 | 0.1% |
| Saudi Arabia | 89 | 0.2% |
| Singapore | 9 | 0.0% |
| Somalia | 52 | 0.1% |
| South Africa | 15 | 0.0% |
| South America | 161 | 0.4% |
| South Central Asia | 655 | 1.4% |
| South Eastern Asia | 104 | 0.2% |
| Southern Europe | 76 | 0.2% |
| Sudan | 49 | 0.1% |
| Sweden | 8 | 0.0% |
| Taiwan | 61 | 0.1% |
| Thailand | 24 | 0.1% |
| Turkey | 89 | 0.2% |
| Ukraine | 23 | 0.1% |
| Uzbekistan | 16 | 0.0% |
| Venezuela | 17 | 0.0% |
| Vietnam | 20 | 0.0% |
| Western Africa | 233 | 0.5% |
| Western Asia | 462 | 1.0% |
| Western Europe | 139 | 0.3% | View All 79 Rows |
Sex and Age in East Lansing
Sex and Age in East Lansing
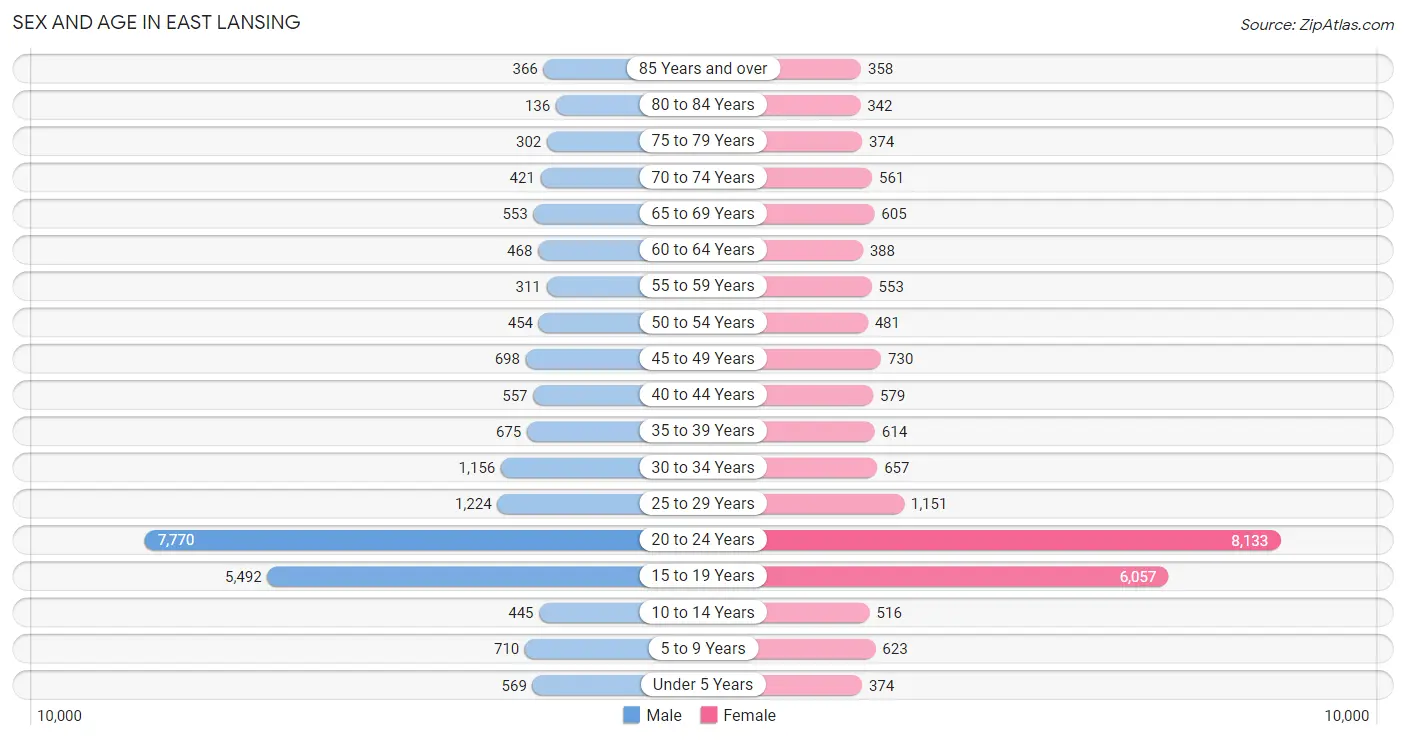
The most populous age groups in East Lansing are 20 to 24 Years (7,770 | 34.8%) for men and 20 to 24 Years (8,133 | 35.2%) for women.
| Age Bracket | Male | Female |
| Under 5 Years | 569 (2.5%) | 374 (1.6%) |
| 5 to 9 Years | 710 (3.2%) | 623 (2.7%) |
| 10 to 14 Years | 445 (2.0%) | 516 (2.2%) |
| 15 to 19 Years | 5,492 (24.6%) | 6,057 (26.2%) |
| 20 to 24 Years | 7,770 (34.8%) | 8,133 (35.2%) |
| 25 to 29 Years | 1,224 (5.5%) | 1,151 (5.0%) |
| 30 to 34 Years | 1,156 (5.2%) | 657 (2.8%) |
| 35 to 39 Years | 675 (3.0%) | 614 (2.7%) |
| 40 to 44 Years | 557 (2.5%) | 579 (2.5%) |
| 45 to 49 Years | 698 (3.1%) | 730 (3.2%) |
| 50 to 54 Years | 454 (2.0%) | 481 (2.1%) |
| 55 to 59 Years | 311 (1.4%) | 553 (2.4%) |
| 60 to 64 Years | 468 (2.1%) | 388 (1.7%) |
| 65 to 69 Years | 553 (2.5%) | 605 (2.6%) |
| 70 to 74 Years | 421 (1.9%) | 561 (2.4%) |
| 75 to 79 Years | 302 (1.3%) | 374 (1.6%) |
| 80 to 84 Years | 136 (0.6%) | 342 (1.5%) |
| 85 Years and over | 366 (1.6%) | 358 (1.5%) |
| Total | 22,307 (100.0%) | 23,096 (100.0%) |
Families and Households in East Lansing
Median Family Size in East Lansing
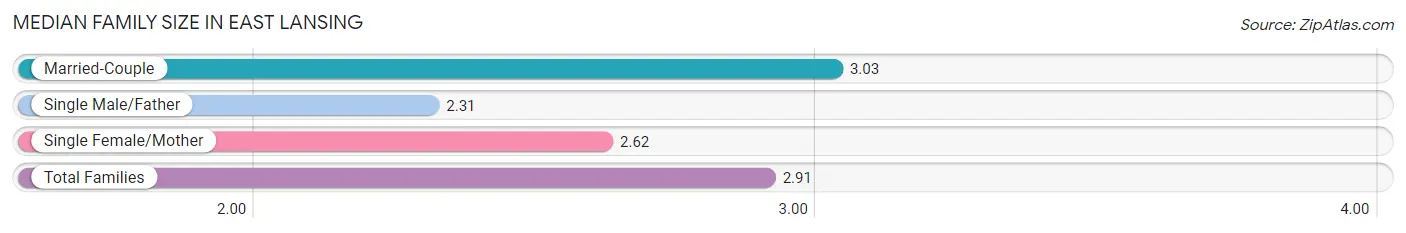
The median family size in East Lansing is 2.91 persons per family, with married-couple families (3,699 | 77.9%) accounting for the largest median family size of 3.03 persons per family. On the other hand, single male/father families (454 | 9.6%) represent the smallest median family size with 2.31 persons per family.
| Family Type | # Families | Family Size |
| Married-Couple | 3,699 (77.9%) | 3.03 |
| Single Male/Father | 454 (9.6%) | 2.31 |
| Single Female/Mother | 596 (12.6%) | 2.62 |
| Total Families | 4,749 (100.0%) | 2.91 |
Median Household Size in East Lansing
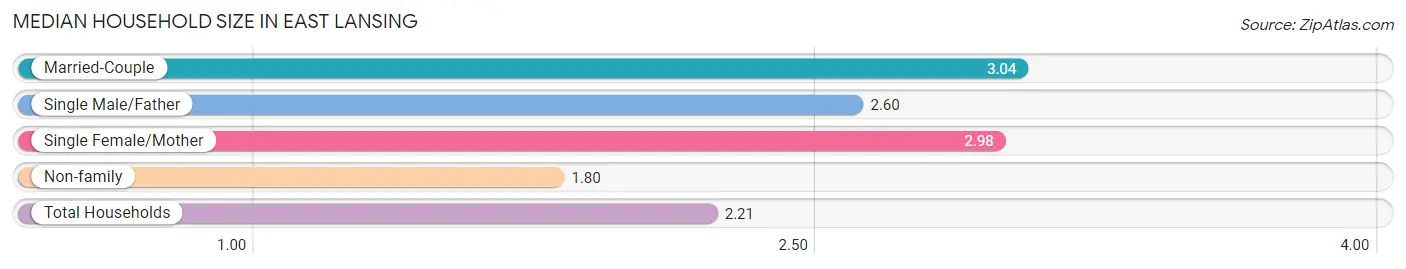
The median household size in East Lansing is 2.21 persons per household, with married-couple households (3,699 | 26.7%) accounting for the largest median household size of 3.04 persons per household. non-family households (9,116 | 65.7%) represent the smallest median household size with 1.80 persons per household.
| Household Type | # Households | Household Size |
| Married-Couple | 3,699 (26.7%) | 3.04 |
| Single Male/Father | 454 (3.3%) | 2.60 |
| Single Female/Mother | 596 (4.3%) | 2.98 |
| Non-family | 9,116 (65.7%) | 1.80 |
| Total Households | 13,865 (100.0%) | 2.21 |
Household Size by Marriage Status in East Lansing
Out of a total of 13,865 households in East Lansing, 4,749 (34.3%) are family households, while 9,116 (65.7%) are nonfamily households. The most numerous type of family households are 2-person households, comprising 2,284, and the most common type of nonfamily households are 1-person households, comprising 5,032.
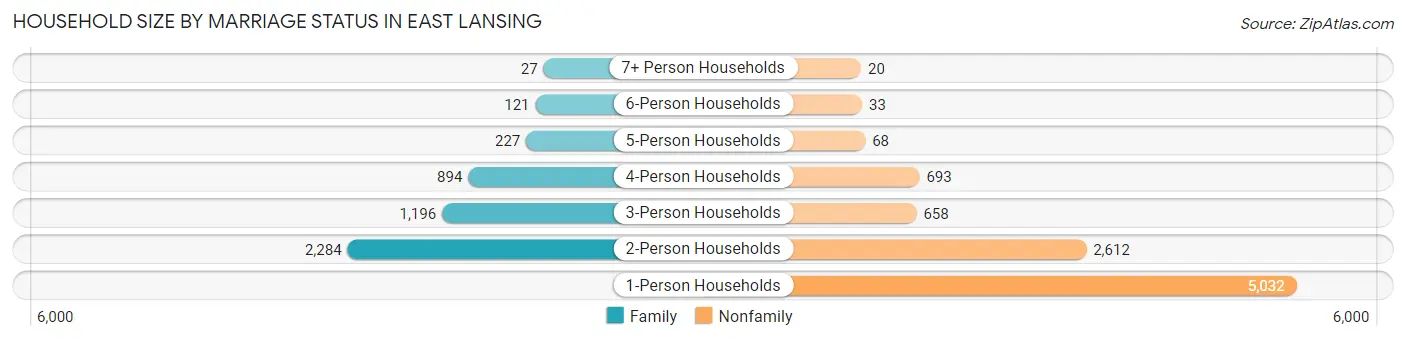
| Household Size | Family Households | Nonfamily Households |
| 1-Person Households | - | 5,032 (36.3%) |
| 2-Person Households | 2,284 (16.5%) | 2,612 (18.8%) |
| 3-Person Households | 1,196 (8.6%) | 658 (4.8%) |
| 4-Person Households | 894 (6.5%) | 693 (5.0%) |
| 5-Person Households | 227 (1.6%) | 68 (0.5%) |
| 6-Person Households | 121 (0.9%) | 33 (0.2%) |
| 7+ Person Households | 27 (0.2%) | 20 (0.1%) |
| Total | 4,749 (34.3%) | 9,116 (65.7%) |
Female Fertility in East Lansing
Fertility by Age in East Lansing
Average fertility rate in East Lansing is 8.0 births per 1,000 women. Women in the age bracket of 35 to 50 years have the highest fertility rate with 34.0 births per 1,000 women. Women in the age bracket of 20 to 34 years acount for 54.3% of all women with births.
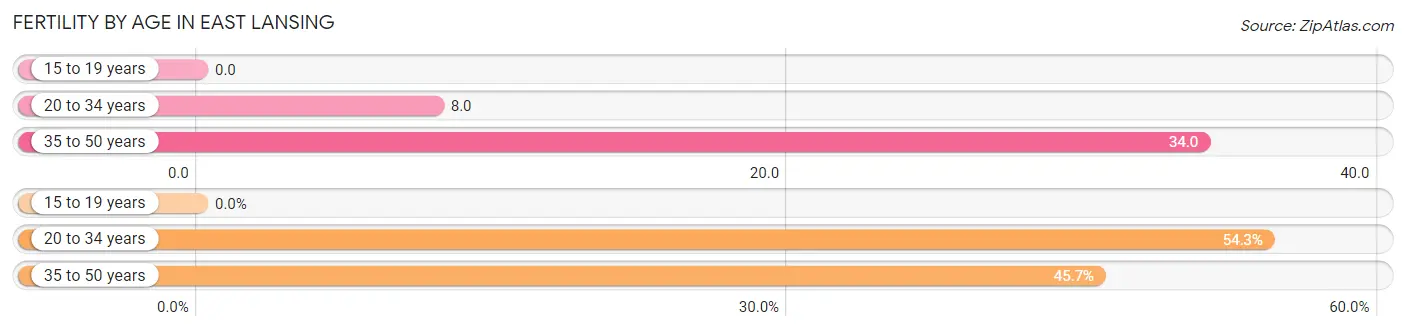
| Age Bracket | Women with Births | Births / 1,000 Women |
| 15 to 19 years | 0 (0.0%) | 0.0 |
| 20 to 34 years | 82 (54.3%) | 8.0 |
| 35 to 50 years | 69 (45.7%) | 34.0 |
| Total | 151 (100.0%) | 8.0 |
Fertility by Age by Marriage Status in East Lansing
91.4% of women with births (151) in East Lansing are married. The highest percentage of unmarried women with births falls into 20 to 34 years age bracket with 15.9% of them unmarried at the time of birth, while the lowest percentage of unmarried women with births belong to 35 to 50 years age bracket with 0.0% of them unmarried.
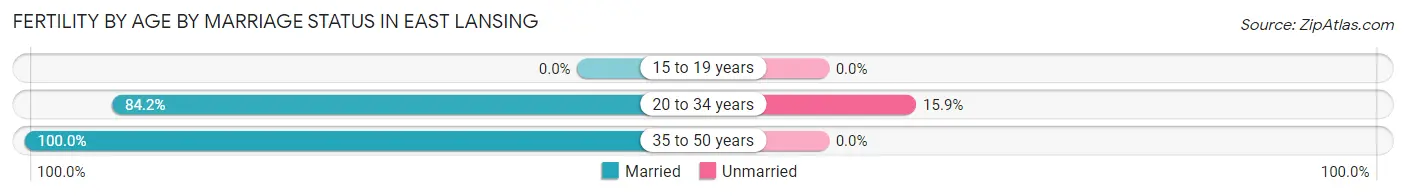
| Age Bracket | Married | Unmarried |
| 15 to 19 years | 0 (0.0%) | 0 (0.0%) |
| 20 to 34 years | 69 (84.2%) | 13 (15.9%) |
| 35 to 50 years | 69 (100.0%) | 0 (0.0%) |
| Total | 138 (91.4%) | 13 (8.6%) |
Fertility by Education in East Lansing
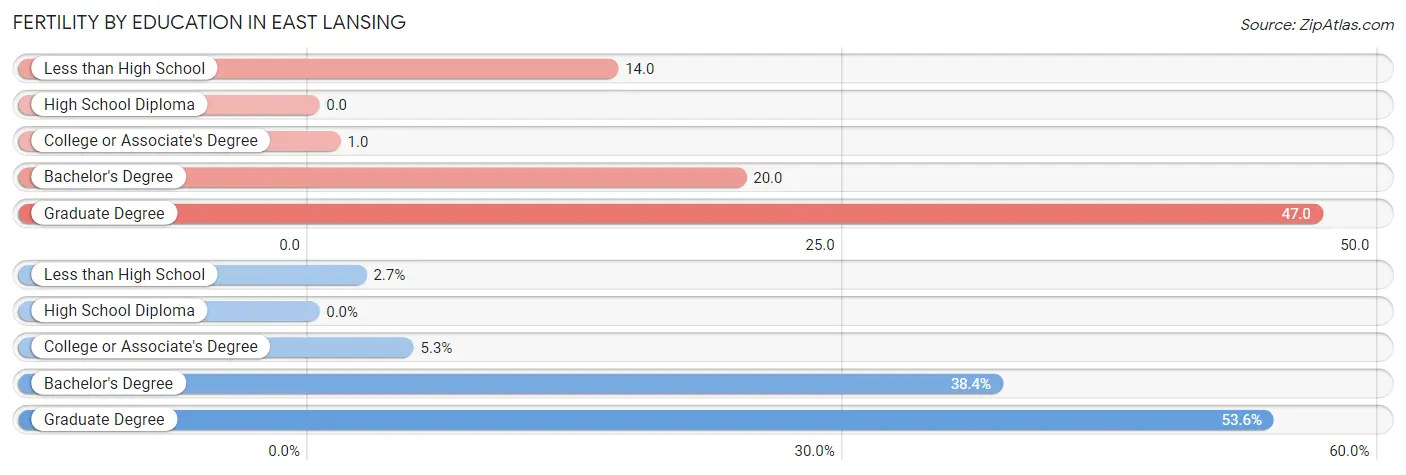
| Educational Attainment | Women with Births | Births / 1,000 Women |
| Less than High School | 4 (2.6%) | 14.0 |
| High School Diploma | 0 (0.0%) | 0.0 |
| College or Associate's Degree | 8 (5.3%) | 1.0 |
| Bachelor's Degree | 58 (38.4%) | 20.0 |
| Graduate Degree | 81 (53.6%) | 47.0 |
| Total | 151 (100.0%) | 8.0 |
Fertility by Education by Marriage Status in East Lansing
8.6% of women with births in East Lansing are unmarried. Women with the educational attainment of less than high school are most likely to be married with 100.0% of them married at childbirth, while women with the educational attainment of college or associate's degree are least likely to be married with 100.0% of them unmarried at childbirth.
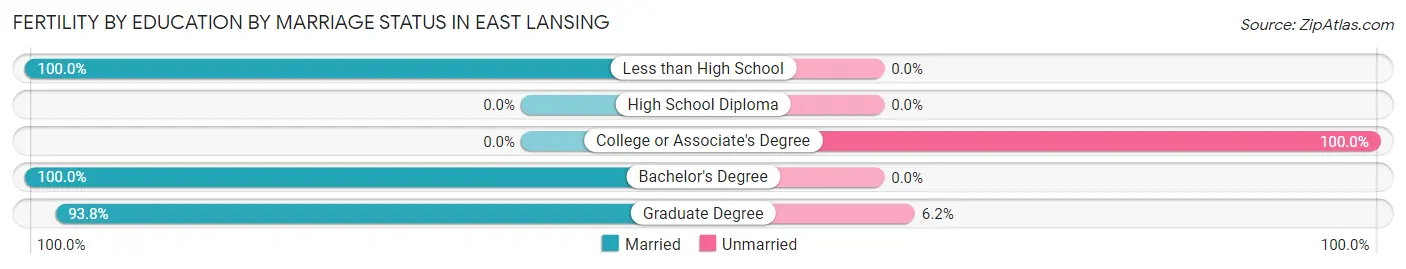
| Educational Attainment | Married | Unmarried |
| Less than High School | 4 (100.0%) | 0 (0.0%) |
| High School Diploma | 0 (0.0%) | 0 (0.0%) |
| College or Associate's Degree | 0 (0.0%) | 8 (100.0%) |
| Bachelor's Degree | 58 (100.0%) | 0 (0.0%) |
| Graduate Degree | 76 (93.8%) | 5 (6.2%) |
| Total | 138 (91.4%) | 13 (8.6%) |
Employment Characteristics in East Lansing
Employment by Class of Employer in East Lansing
Among the 21,377 employed individuals in East Lansing, private company employees (11,744 | 54.9%), state government employees (4,751 | 22.2%), and not-for-profit organizations (3,137 | 14.7%) make up the most common classes of employment.
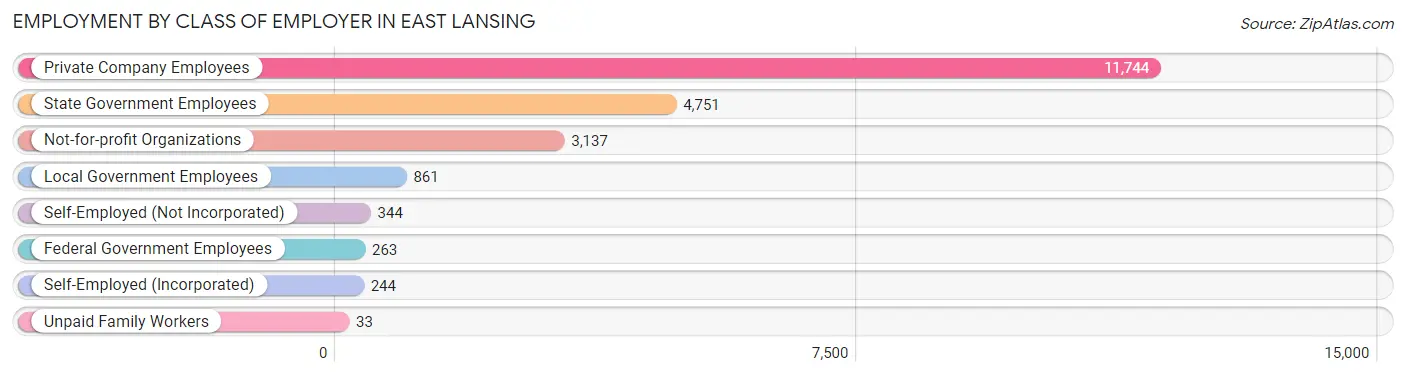
| Employer Class | # Employees | % Employees |
| Private Company Employees | 11,744 | 54.9% |
| Self-Employed (Incorporated) | 244 | 1.1% |
| Self-Employed (Not Incorporated) | 344 | 1.6% |
| Not-for-profit Organizations | 3,137 | 14.7% |
| Local Government Employees | 861 | 4.0% |
| State Government Employees | 4,751 | 22.2% |
| Federal Government Employees | 263 | 1.2% |
| Unpaid Family Workers | 33 | 0.2% |
| Total | 21,377 | 100.0% |
Employment Status by Age in East Lansing
According to the labor force statistics for East Lansing, out of the total population over 16 years of age (42,007), 56.3% or 23,650 individuals are in the labor force, with 6.7% or 1,585 of them unemployed. The age group with the highest labor force participation rate is 35 to 44 years, with 89.5% or 2,170 individuals in the labor force. Within the labor force, the 65 to 74 years age range has the highest percentage of unemployed individuals, with 13.9% or 84 of them being unemployed.
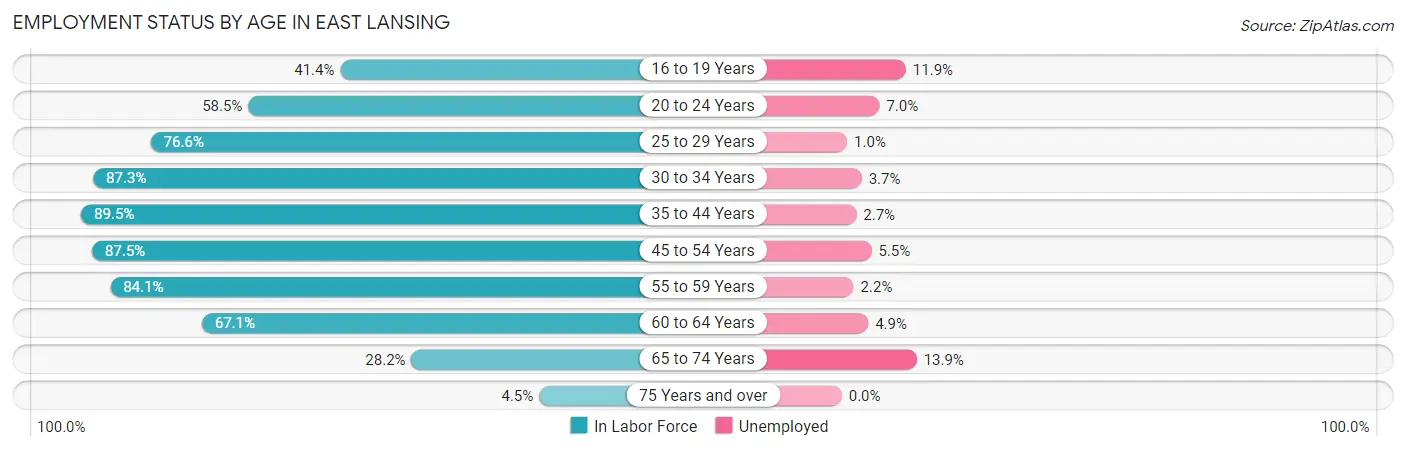
| Age Bracket | In Labor Force | Unemployed |
| 16 to 19 Years | 4,715 (41.4%) | 561 (11.9%) |
| 20 to 24 Years | 9,303 (58.5%) | 651 (7.0%) |
| 25 to 29 Years | 1,819 (76.6%) | 18 (1.0%) |
| 30 to 34 Years | 1,583 (87.3%) | 59 (3.7%) |
| 35 to 44 Years | 2,170 (89.5%) | 59 (2.7%) |
| 45 to 54 Years | 2,068 (87.5%) | 114 (5.5%) |
| 55 to 59 Years | 727 (84.1%) | 16 (2.2%) |
| 60 to 64 Years | 574 (67.1%) | 28 (4.9%) |
| 65 to 74 Years | 603 (28.2%) | 84 (13.9%) |
| 75 Years and over | 85 (4.5%) | 0 (0.0%) |
| Total | 23,650 (56.3%) | 1,585 (6.7%) |
Employment Status by Educational Attainment in East Lansing
According to labor force statistics for East Lansing, 83.6% of individuals (8,942) out of the total population between 25 and 64 years of age (10,696) are in the labor force, with 3.3% or 295 of them being unemployed. The group with the highest labor force participation rate are those with the educational attainment of bachelor's degree or higher, with 87.5% or 6,623 individuals in the labor force. Within the labor force, individuals with less than high school education have the highest percentage of unemployment, with 28.4% or 25 of them being unemployed.
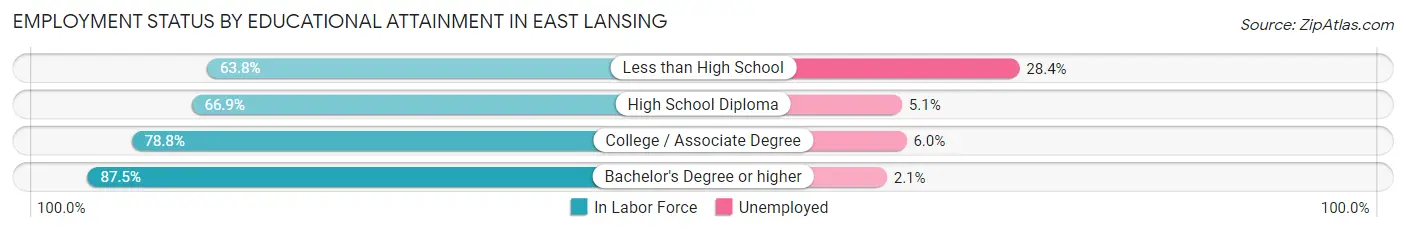
| Educational Attainment | In Labor Force | Unemployed |
| Less than High School | 88 (63.8%) | 39 (28.4%) |
| High School Diploma | 688 (66.9%) | 52 (5.1%) |
| College / Associate Degree | 1,544 (78.8%) | 118 (6.0%) |
| Bachelor's Degree or higher | 6,623 (87.5%) | 159 (2.1%) |
| Total | 8,942 (83.6%) | 353 (3.3%) |
Employment Occupations by Sex in East Lansing
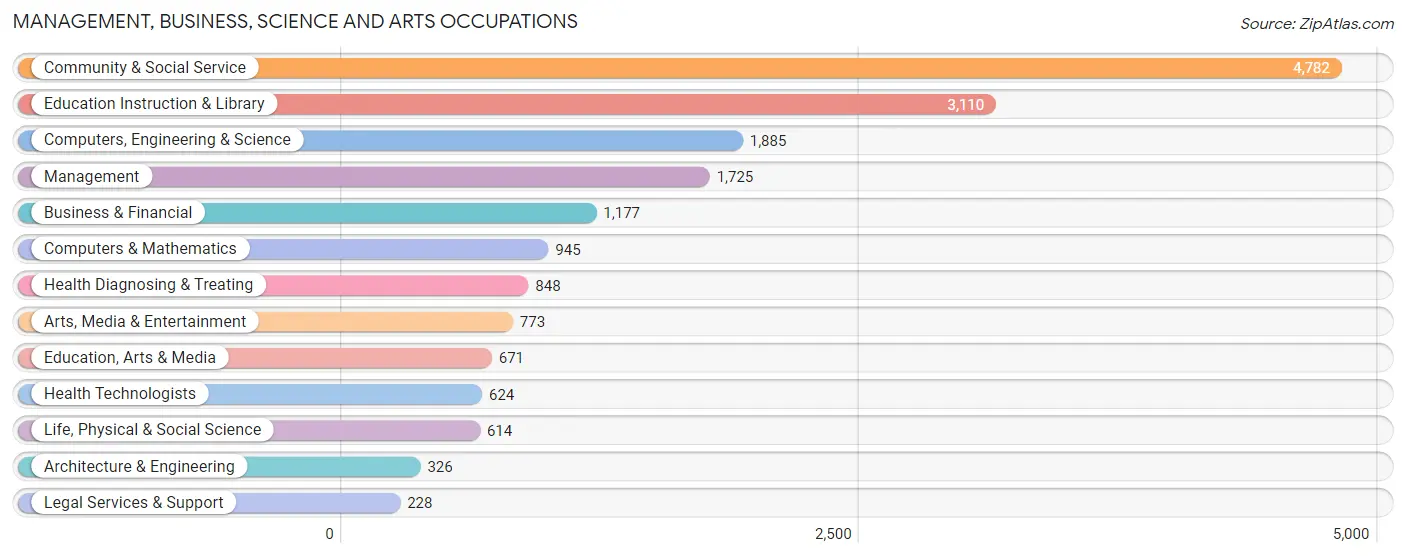
Management, Business, Science and Arts Occupations
The most common Management, Business, Science and Arts occupations in East Lansing are Community & Social Service (4,782 | 21.7%), Education Instruction & Library (3,110 | 14.1%), Computers, Engineering & Science (1,885 | 8.6%), Management (1,725 | 7.8%), and Business & Financial (1,177 | 5.3%).
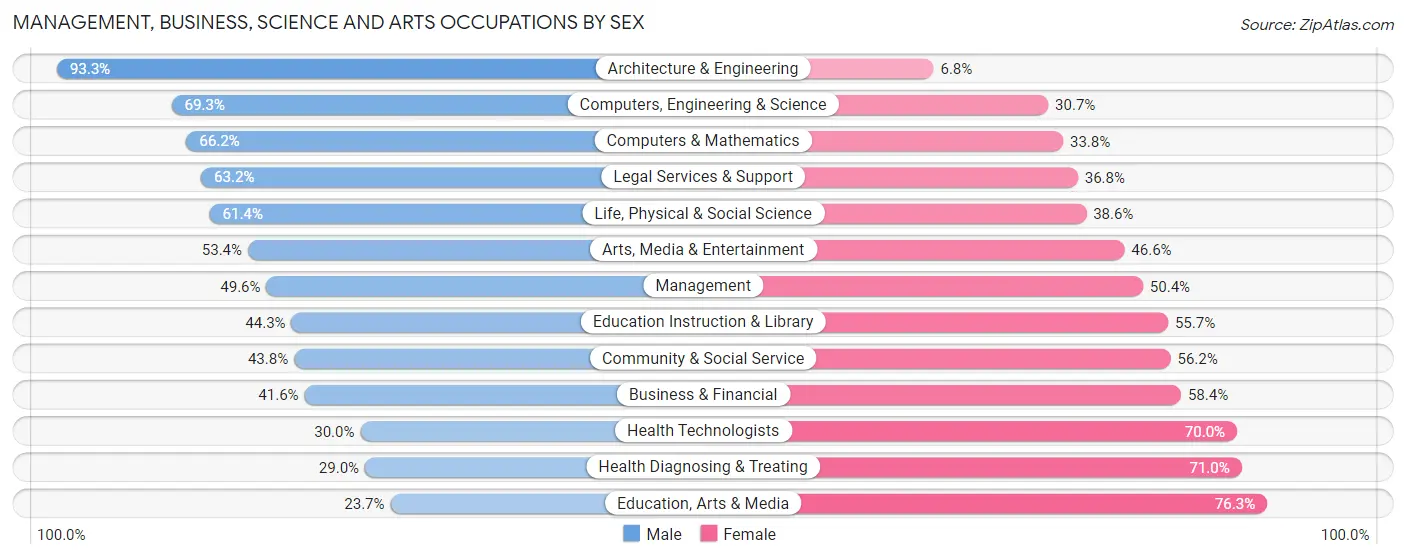
Management, Business, Science and Arts Occupations by Sex
Within the Management, Business, Science and Arts occupations in East Lansing, the most male-oriented occupations are Architecture & Engineering (93.2%), Computers, Engineering & Science (69.3%), and Computers & Mathematics (66.2%), while the most female-oriented occupations are Education, Arts & Media (76.3%), Health Diagnosing & Treating (71.0%), and Health Technologists (70.0%).
| Occupation | Male | Female |
| Management | 855 (49.6%) | 870 (50.4%) |
| Business & Financial | 490 (41.6%) | 687 (58.4%) |
| Computers, Engineering & Science | 1,307 (69.3%) | 578 (30.7%) |
| Computers & Mathematics | 626 (66.2%) | 319 (33.8%) |
| Architecture & Engineering | 304 (93.2%) | 22 (6.8%) |
| Life, Physical & Social Science | 377 (61.4%) | 237 (38.6%) |
| Community & Social Service | 2,095 (43.8%) | 2,687 (56.2%) |
| Education, Arts & Media | 159 (23.7%) | 512 (76.3%) |
| Legal Services & Support | 144 (63.2%) | 84 (36.8%) |
| Education Instruction & Library | 1,379 (44.3%) | 1,731 (55.7%) |
| Arts, Media & Entertainment | 413 (53.4%) | 360 (46.6%) |
| Health Diagnosing & Treating | 246 (29.0%) | 602 (71.0%) |
| Health Technologists | 187 (30.0%) | 437 (70.0%) |
| Total (Category) | 4,993 (47.9%) | 5,424 (52.1%) |
| Total (Overall) | 10,109 (46.0%) | 11,889 (54.0%) |
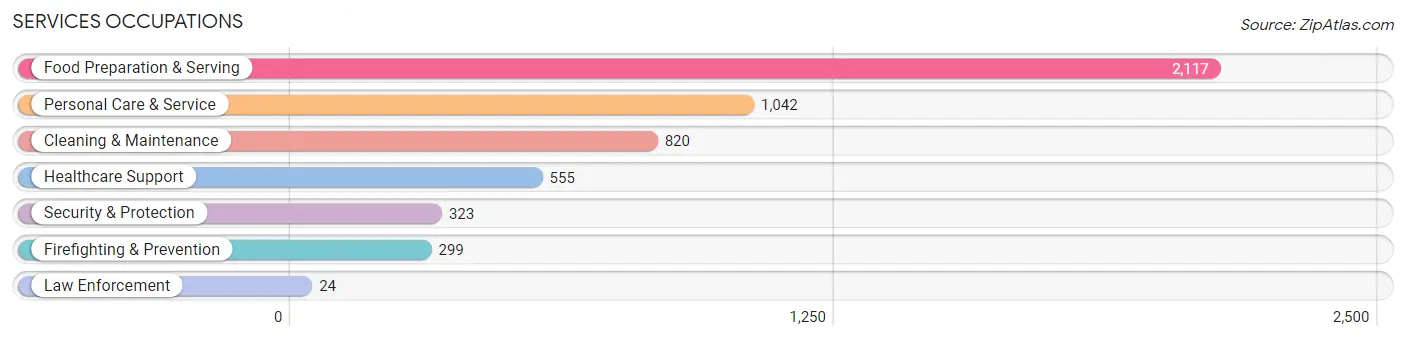
Services Occupations
The most common Services occupations in East Lansing are Food Preparation & Serving (2,117 | 9.6%), Personal Care & Service (1,042 | 4.7%), Cleaning & Maintenance (820 | 3.7%), Healthcare Support (555 | 2.5%), and Security & Protection (323 | 1.5%).
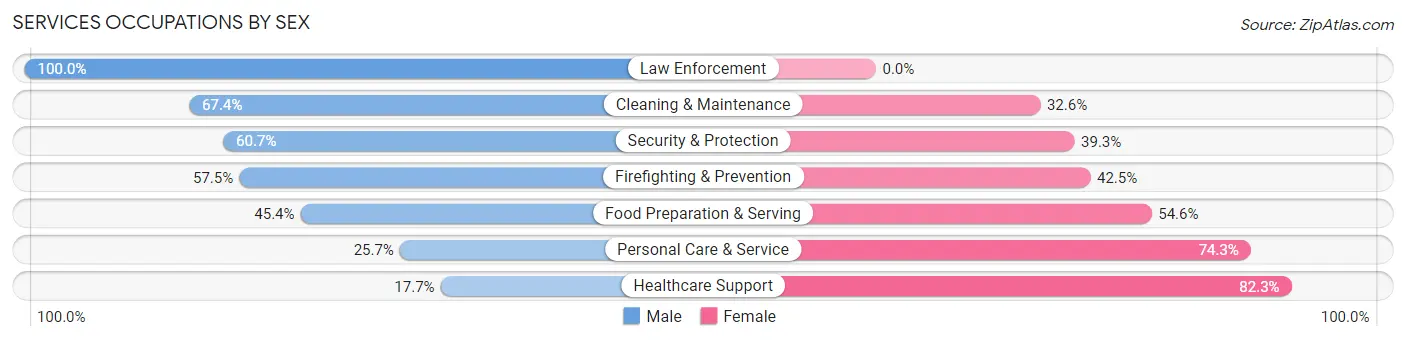
Services Occupations by Sex
Within the Services occupations in East Lansing, the most male-oriented occupations are Law Enforcement (100.0%), Cleaning & Maintenance (67.4%), and Security & Protection (60.7%), while the most female-oriented occupations are Healthcare Support (82.3%), Personal Care & Service (74.3%), and Food Preparation & Serving (54.6%).
| Occupation | Male | Female |
| Healthcare Support | 98 (17.7%) | 457 (82.3%) |
| Security & Protection | 196 (60.7%) | 127 (39.3%) |
| Firefighting & Prevention | 172 (57.5%) | 127 (42.5%) |
| Law Enforcement | 24 (100.0%) | 0 (0.0%) |
| Food Preparation & Serving | 961 (45.4%) | 1,156 (54.6%) |
| Cleaning & Maintenance | 553 (67.4%) | 267 (32.6%) |
| Personal Care & Service | 268 (25.7%) | 774 (74.3%) |
| Total (Category) | 2,076 (42.7%) | 2,781 (57.3%) |
| Total (Overall) | 10,109 (46.0%) | 11,889 (54.0%) |
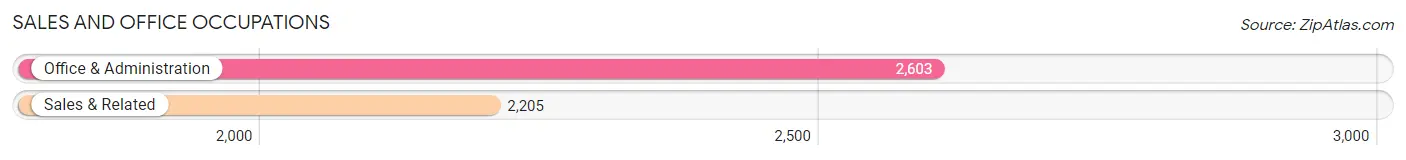
Sales and Office Occupations
The most common Sales and Office occupations in East Lansing are Office & Administration (2,603 | 11.8%), and Sales & Related (2,205 | 10.0%).
Sales and Office Occupations by Sex
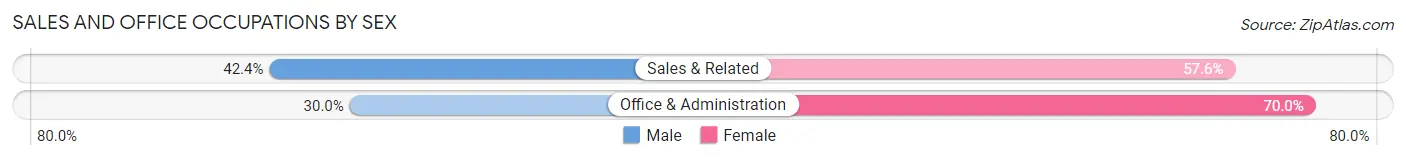
| Occupation | Male | Female |
| Sales & Related | 934 (42.4%) | 1,271 (57.6%) |
| Office & Administration | 781 (30.0%) | 1,822 (70.0%) |
| Total (Category) | 1,715 (35.7%) | 3,093 (64.3%) |
| Total (Overall) | 10,109 (46.0%) | 11,889 (54.0%) |
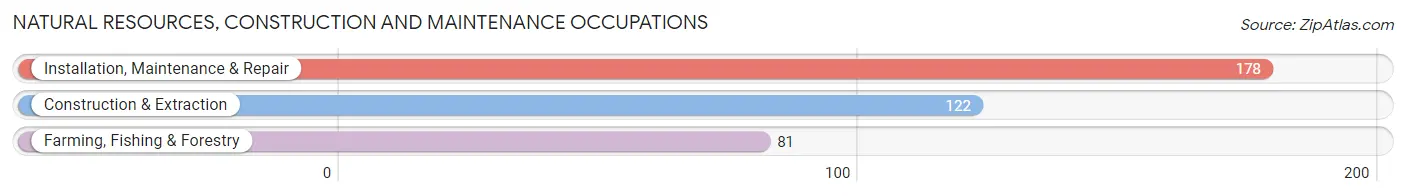
Natural Resources, Construction and Maintenance Occupations
The most common Natural Resources, Construction and Maintenance occupations in East Lansing are Installation, Maintenance & Repair (178 | 0.8%), Construction & Extraction (122 | 0.5%), and Farming, Fishing & Forestry (81 | 0.4%).
Natural Resources, Construction and Maintenance Occupations by Sex
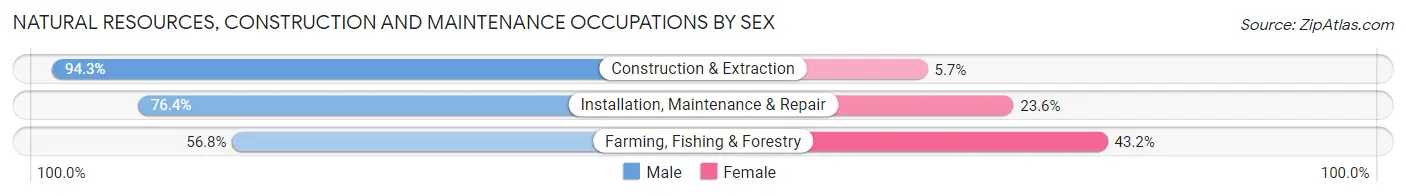
| Occupation | Male | Female |
| Farming, Fishing & Forestry | 46 (56.8%) | 35 (43.2%) |
| Construction & Extraction | 115 (94.3%) | 7 (5.7%) |
| Installation, Maintenance & Repair | 136 (76.4%) | 42 (23.6%) |
| Total (Category) | 297 (77.9%) | 84 (22.1%) |
| Total (Overall) | 10,109 (46.0%) | 11,889 (54.0%) |
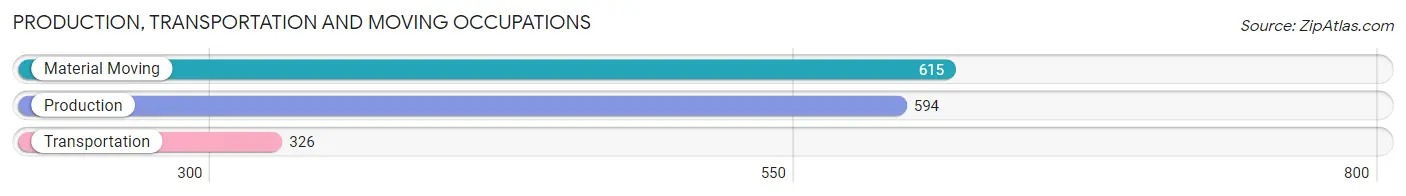
Production, Transportation and Moving Occupations
The most common Production, Transportation and Moving occupations in East Lansing are Material Moving (615 | 2.8%), Production (594 | 2.7%), and Transportation (326 | 1.5%).
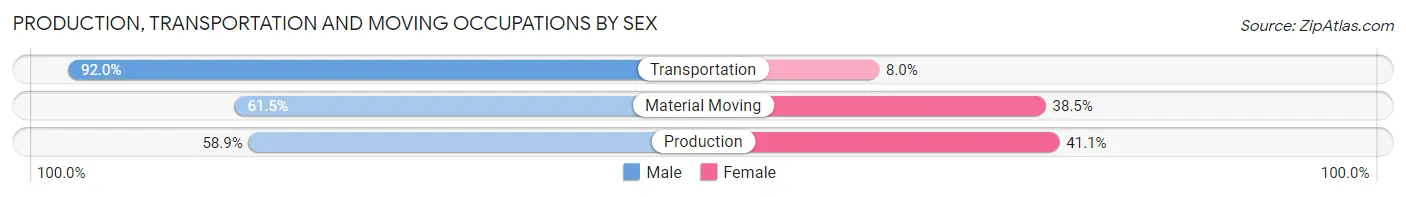
Production, Transportation and Moving Occupations by Sex
| Occupation | Male | Female |
| Production | 350 (58.9%) | 244 (41.1%) |
| Transportation | 300 (92.0%) | 26 (8.0%) |
| Material Moving | 378 (61.5%) | 237 (38.5%) |
| Total (Category) | 1,028 (67.0%) | 507 (33.0%) |
| Total (Overall) | 10,109 (46.0%) | 11,889 (54.0%) |
Employment Industries by Sex in East Lansing
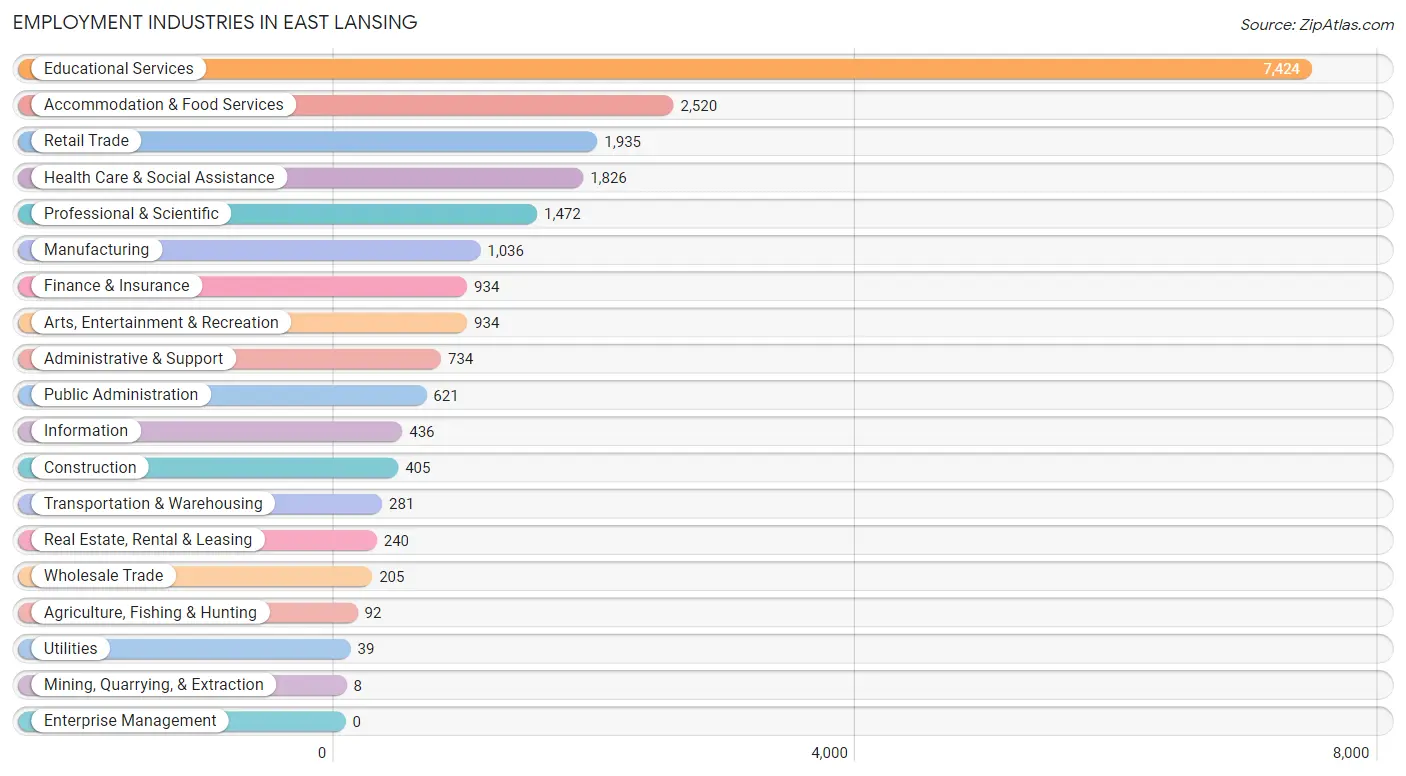
Employment Industries in East Lansing
The major employment industries in East Lansing include Educational Services (7,424 | 33.8%), Accommodation & Food Services (2,520 | 11.5%), Retail Trade (1,935 | 8.8%), Health Care & Social Assistance (1,826 | 8.3%), and Professional & Scientific (1,472 | 6.7%).
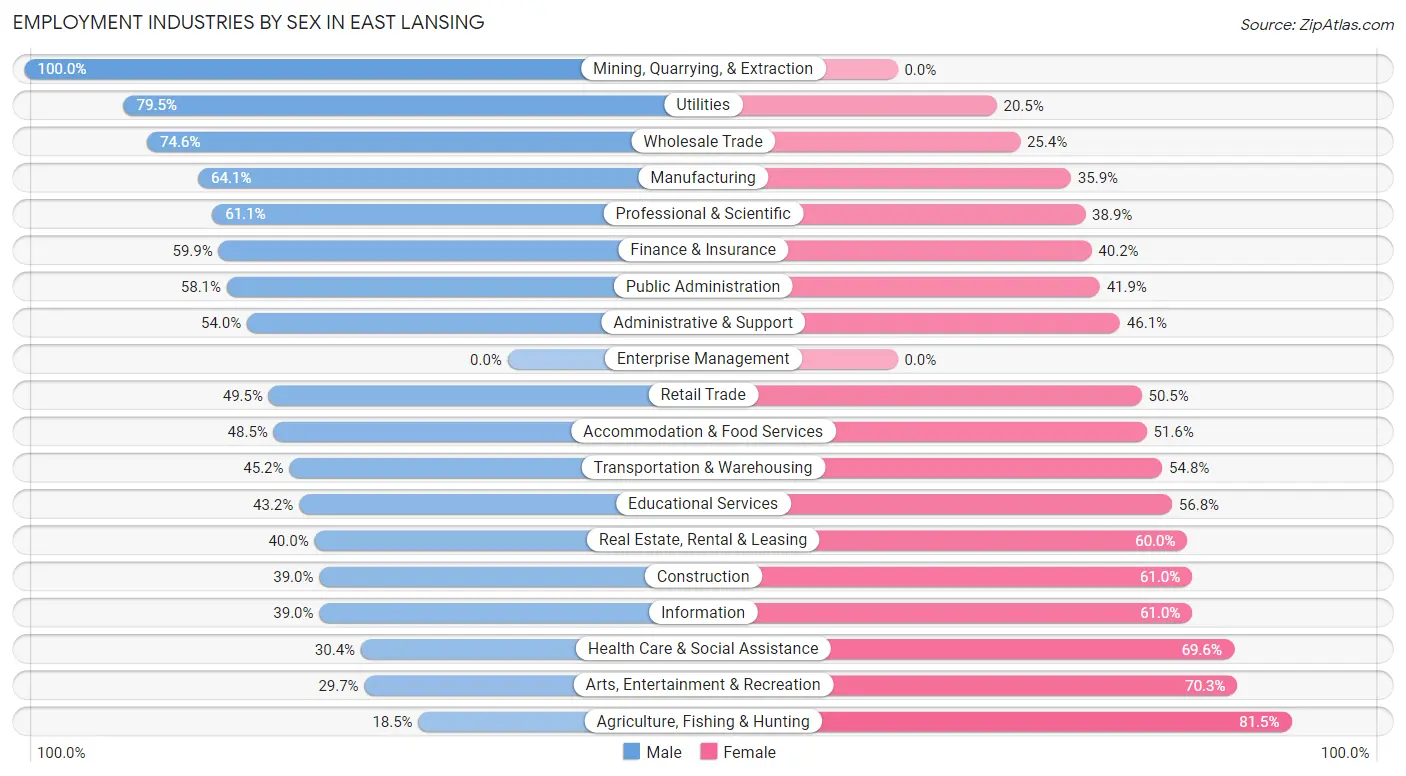
Employment Industries by Sex in East Lansing
The East Lansing industries that see more men than women are Mining, Quarrying, & Extraction (100.0%), Utilities (79.5%), and Wholesale Trade (74.6%), whereas the industries that tend to have a higher number of women are Agriculture, Fishing & Hunting (81.5%), Arts, Entertainment & Recreation (70.3%), and Health Care & Social Assistance (69.6%).
| Industry | Male | Female |
| Agriculture, Fishing & Hunting | 17 (18.5%) | 75 (81.5%) |
| Mining, Quarrying, & Extraction | 8 (100.0%) | 0 (0.0%) |
| Construction | 158 (39.0%) | 247 (61.0%) |
| Manufacturing | 664 (64.1%) | 372 (35.9%) |
| Wholesale Trade | 153 (74.6%) | 52 (25.4%) |
| Retail Trade | 957 (49.5%) | 978 (50.5%) |
| Transportation & Warehousing | 127 (45.2%) | 154 (54.8%) |
| Utilities | 31 (79.5%) | 8 (20.5%) |
| Information | 170 (39.0%) | 266 (61.0%) |
| Finance & Insurance | 559 (59.9%) | 375 (40.2%) |
| Real Estate, Rental & Leasing | 96 (40.0%) | 144 (60.0%) |
| Professional & Scientific | 900 (61.1%) | 572 (38.9%) |
| Enterprise Management | 0 (0.0%) | 0 (0.0%) |
| Administrative & Support | 396 (53.9%) | 338 (46.1%) |
| Educational Services | 3,206 (43.2%) | 4,218 (56.8%) |
| Health Care & Social Assistance | 555 (30.4%) | 1,271 (69.6%) |
| Arts, Entertainment & Recreation | 277 (29.7%) | 657 (70.3%) |
| Accommodation & Food Services | 1,221 (48.4%) | 1,299 (51.5%) |
| Public Administration | 361 (58.1%) | 260 (41.9%) |
| Total | 10,109 (46.0%) | 11,889 (54.0%) |
Education in East Lansing
School Enrollment in East Lansing
The most common levels of schooling among the 30,383 students in East Lansing are college / undergraduate (25,013 | 82.3%), graduate / professional (2,283 | 7.5%), and elementary school (1,166 | 3.8%).
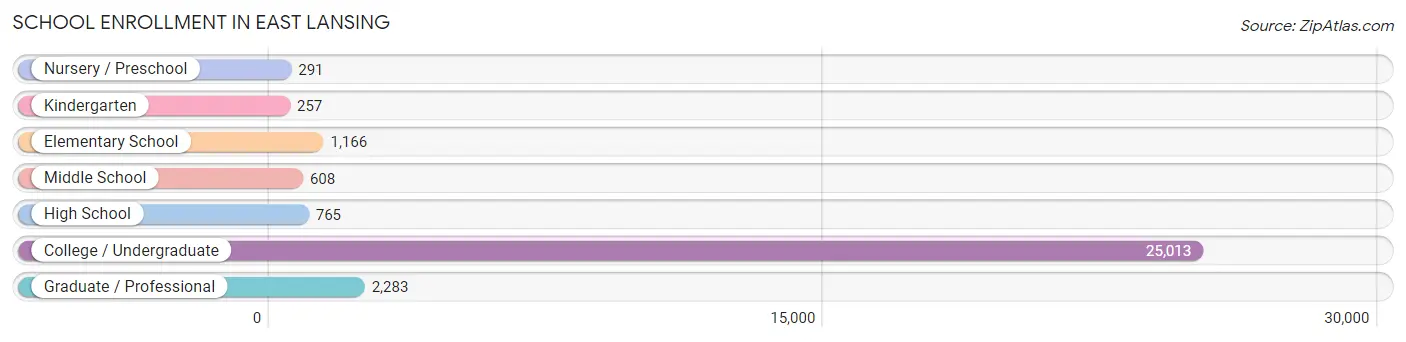
| School Level | # Students | % Students |
| Nursery / Preschool | 291 | 1.0% |
| Kindergarten | 257 | 0.9% |
| Elementary School | 1,166 | 3.8% |
| Middle School | 608 | 2.0% |
| High School | 765 | 2.5% |
| College / Undergraduate | 25,013 | 82.3% |
| Graduate / Professional | 2,283 | 7.5% |
| Total | 30,383 | 100.0% |
School Enrollment by Age by Funding Source in East Lansing
Out of a total of 30,383 students who are enrolled in schools in East Lansing, 1,732 (5.7%) attend a private institution, while the remaining 28,651 (94.3%) are enrolled in public schools. The age group of 3 to 4 year olds has the highest likelihood of being enrolled in private schools, with 160 (59.9% in the age bracket) enrolled. Conversely, the age group of 18 to 19 year olds has the lowest likelihood of being enrolled in a private school, with 10,217 (96.1% in the age bracket) attending a public institution.
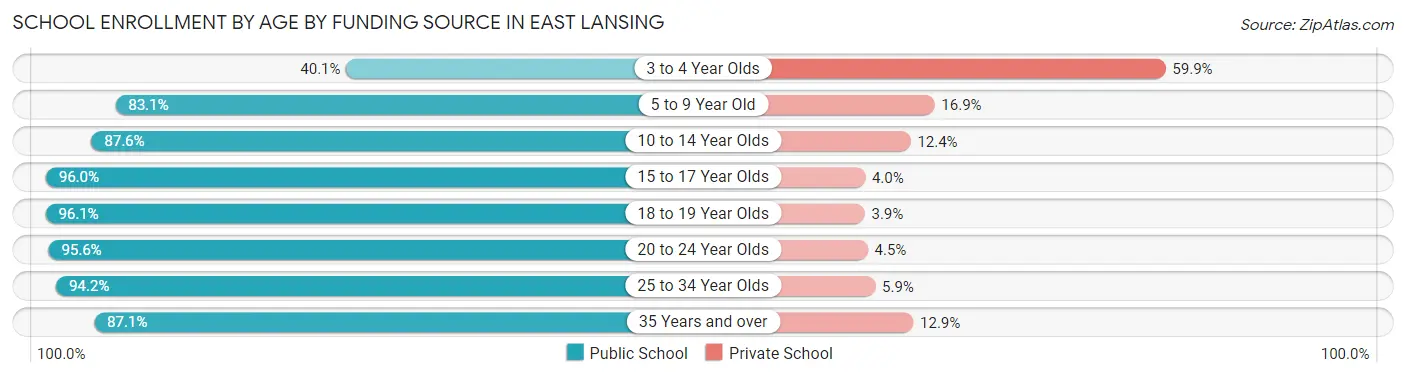
| Age Bracket | Public School | Private School |
| 3 to 4 Year Olds | 107 (40.1%) | 160 (59.9%) |
| 5 to 9 Year Old | 1,062 (83.1%) | 216 (16.9%) |
| 10 to 14 Year Olds | 788 (87.6%) | 112 (12.4%) |
| 15 to 17 Year Olds | 777 (96.0%) | 32 (4.0%) |
| 18 to 19 Year Olds | 10,217 (96.1%) | 414 (3.9%) |
| 20 to 24 Year Olds | 13,866 (95.6%) | 646 (4.4%) |
| 25 to 34 Year Olds | 1,513 (94.2%) | 94 (5.9%) |
| 35 Years and over | 330 (87.1%) | 49 (12.9%) |
| Total | 28,651 (94.3%) | 1,732 (5.7%) |
Educational Attainment by Field of Study in East Lansing
Social sciences (1,606 | 14.3%), business (1,428 | 12.7%), bio, nature & agricultural (876 | 7.8%), arts & humanities (816 | 7.3%), and education (803 | 7.1%) are the most common fields of study among 11,228 individuals in East Lansing who have obtained a bachelor's degree or higher.
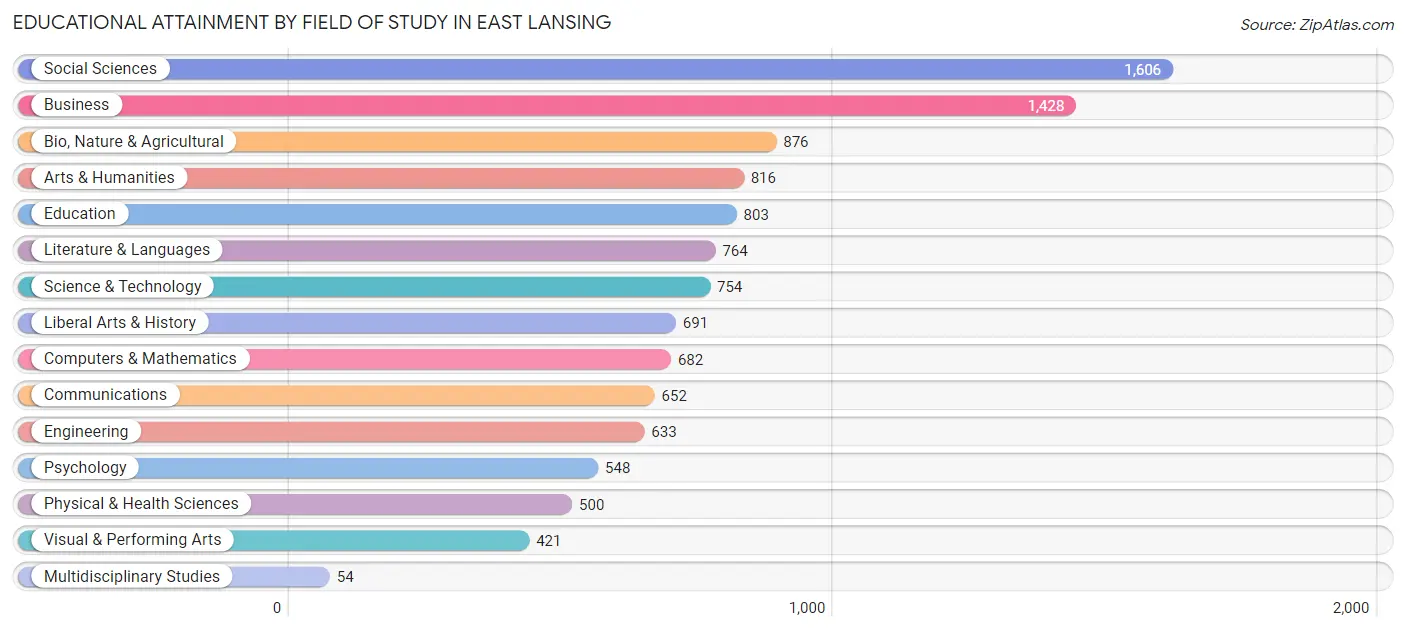
| Field of Study | # Graduates | % Graduates |
| Computers & Mathematics | 682 | 6.1% |
| Bio, Nature & Agricultural | 876 | 7.8% |
| Physical & Health Sciences | 500 | 4.4% |
| Psychology | 548 | 4.9% |
| Social Sciences | 1,606 | 14.3% |
| Engineering | 633 | 5.6% |
| Multidisciplinary Studies | 54 | 0.5% |
| Science & Technology | 754 | 6.7% |
| Business | 1,428 | 12.7% |
| Education | 803 | 7.1% |
| Literature & Languages | 764 | 6.8% |
| Liberal Arts & History | 691 | 6.1% |
| Visual & Performing Arts | 421 | 3.7% |
| Communications | 652 | 5.8% |
| Arts & Humanities | 816 | 7.3% |
| Total | 11,228 | 100.0% |
Transportation & Commute in East Lansing
Vehicle Availability by Sex in East Lansing
The most prevalent vehicle ownership categories in East Lansing are males with 2 vehicles (3,462, accounting for 43.8%) and females with 2 vehicles (3,651, making up 42.0%).
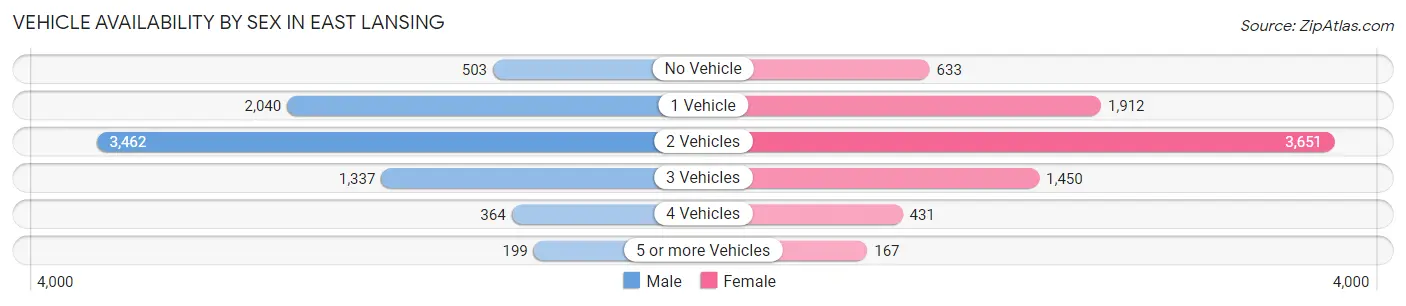
| Vehicles Available | Male | Female |
| No Vehicle | 503 (6.4%) | 633 (7.7%) |
| 1 Vehicle | 2,040 (25.8%) | 1,912 (23.2%) |
| 2 Vehicles | 3,462 (43.8%) | 3,651 (44.3%) |
| 3 Vehicles | 1,337 (16.9%) | 1,450 (17.6%) |
| 4 Vehicles | 364 (4.6%) | 431 (5.2%) |
| 5 or more Vehicles | 199 (2.5%) | 167 (2.0%) |
| Total | 7,905 (100.0%) | 8,244 (100.0%) |
Commute Time in East Lansing
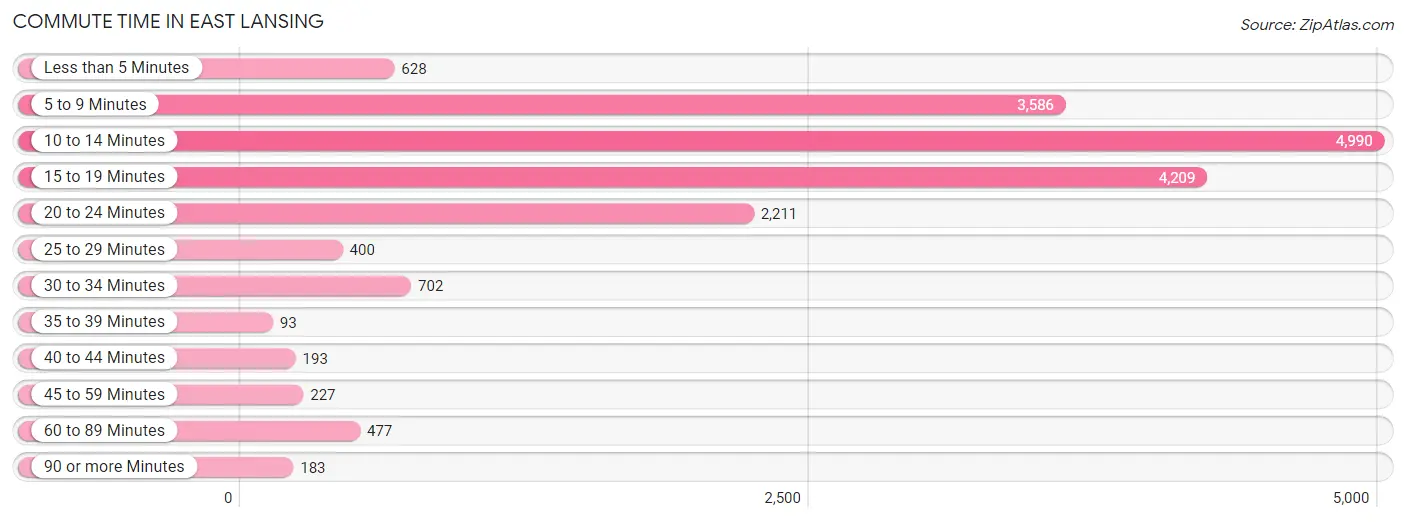
The most frequently occuring commute durations in East Lansing are 10 to 14 minutes (4,990 commuters, 27.9%), 15 to 19 minutes (4,209 commuters, 23.5%), and 5 to 9 minutes (3,586 commuters, 20.0%).
| Commute Time | # Commuters | % Commuters |
| Less than 5 Minutes | 628 | 3.5% |
| 5 to 9 Minutes | 3,586 | 20.0% |
| 10 to 14 Minutes | 4,990 | 27.9% |
| 15 to 19 Minutes | 4,209 | 23.5% |
| 20 to 24 Minutes | 2,211 | 12.3% |
| 25 to 29 Minutes | 400 | 2.2% |
| 30 to 34 Minutes | 702 | 3.9% |
| 35 to 39 Minutes | 93 | 0.5% |
| 40 to 44 Minutes | 193 | 1.1% |
| 45 to 59 Minutes | 227 | 1.3% |
| 60 to 89 Minutes | 477 | 2.7% |
| 90 or more Minutes | 183 | 1.0% |
Commute Time by Sex in East Lansing
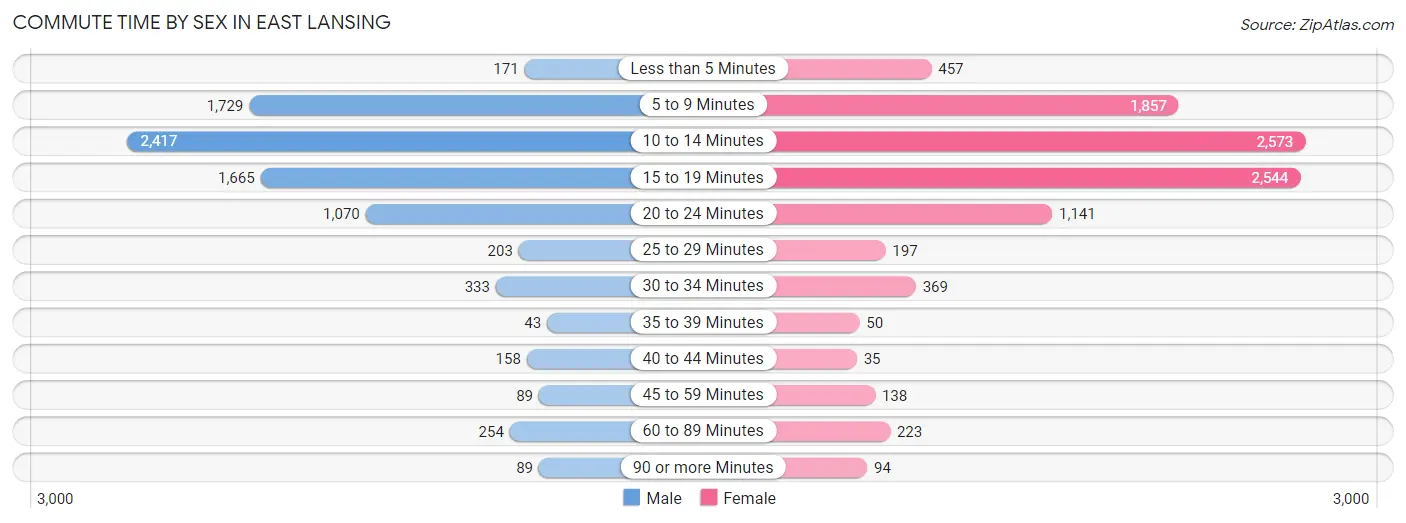
The most common commute times in East Lansing are 10 to 14 minutes (2,417 commuters, 29.4%) for males and 10 to 14 minutes (2,573 commuters, 26.6%) for females.
| Commute Time | Male | Female |
| Less than 5 Minutes | 171 (2.1%) | 457 (4.7%) |
| 5 to 9 Minutes | 1,729 (21.0%) | 1,857 (19.2%) |
| 10 to 14 Minutes | 2,417 (29.4%) | 2,573 (26.6%) |
| 15 to 19 Minutes | 1,665 (20.3%) | 2,544 (26.3%) |
| 20 to 24 Minutes | 1,070 (13.0%) | 1,141 (11.8%) |
| 25 to 29 Minutes | 203 (2.5%) | 197 (2.0%) |
| 30 to 34 Minutes | 333 (4.1%) | 369 (3.8%) |
| 35 to 39 Minutes | 43 (0.5%) | 50 (0.5%) |
| 40 to 44 Minutes | 158 (1.9%) | 35 (0.4%) |
| 45 to 59 Minutes | 89 (1.1%) | 138 (1.4%) |
| 60 to 89 Minutes | 254 (3.1%) | 223 (2.3%) |
| 90 or more Minutes | 89 (1.1%) | 94 (1.0%) |
Time of Departure to Work by Sex in East Lansing
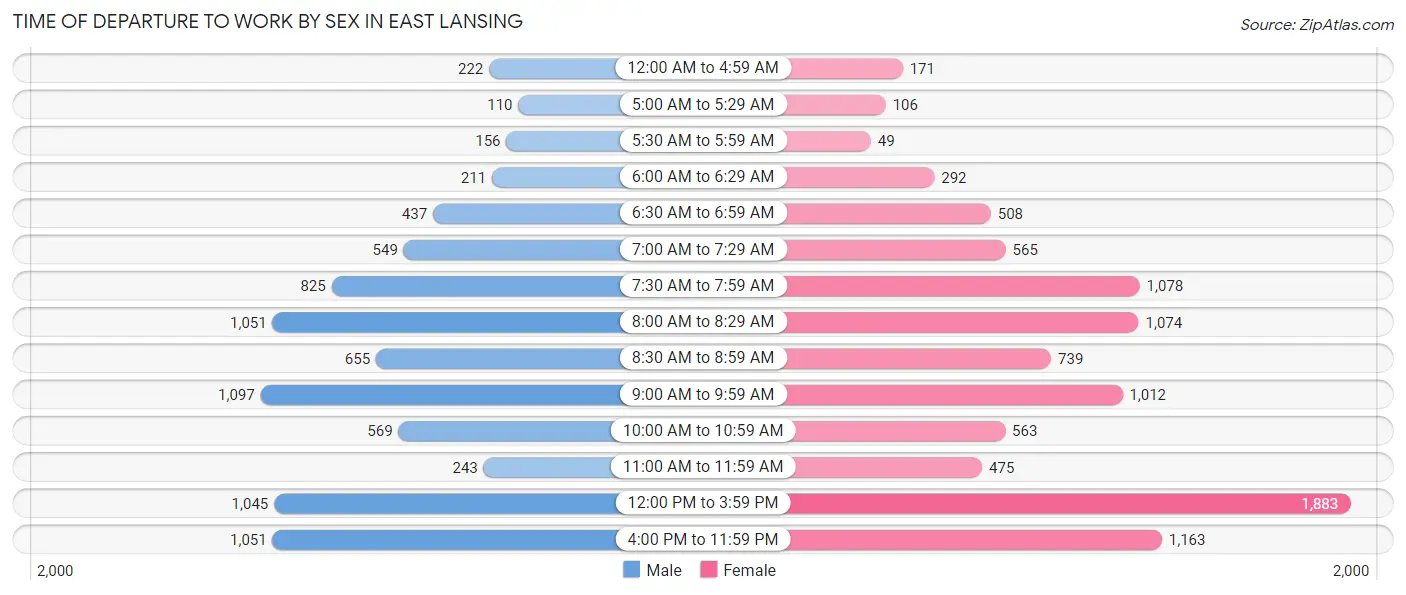
The most frequent times of departure to work in East Lansing are 9:00 AM to 9:59 AM (1,097, 13.3%) for males and 12:00 PM to 3:59 PM (1,883, 19.5%) for females.
| Time of Departure | Male | Female |
| 12:00 AM to 4:59 AM | 222 (2.7%) | 171 (1.8%) |
| 5:00 AM to 5:29 AM | 110 (1.3%) | 106 (1.1%) |
| 5:30 AM to 5:59 AM | 156 (1.9%) | 49 (0.5%) |
| 6:00 AM to 6:29 AM | 211 (2.6%) | 292 (3.0%) |
| 6:30 AM to 6:59 AM | 437 (5.3%) | 508 (5.2%) |
| 7:00 AM to 7:29 AM | 549 (6.7%) | 565 (5.8%) |
| 7:30 AM to 7:59 AM | 825 (10.0%) | 1,078 (11.1%) |
| 8:00 AM to 8:29 AM | 1,051 (12.8%) | 1,074 (11.1%) |
| 8:30 AM to 8:59 AM | 655 (8.0%) | 739 (7.6%) |
| 9:00 AM to 9:59 AM | 1,097 (13.3%) | 1,012 (10.5%) |
| 10:00 AM to 10:59 AM | 569 (6.9%) | 563 (5.8%) |
| 11:00 AM to 11:59 AM | 243 (3.0%) | 475 (4.9%) |
| 12:00 PM to 3:59 PM | 1,045 (12.7%) | 1,883 (19.5%) |
| 4:00 PM to 11:59 PM | 1,051 (12.8%) | 1,163 (12.0%) |
| Total | 8,221 (100.0%) | 9,678 (100.0%) |
Housing Occupancy in East Lansing
Occupancy by Ownership in East Lansing
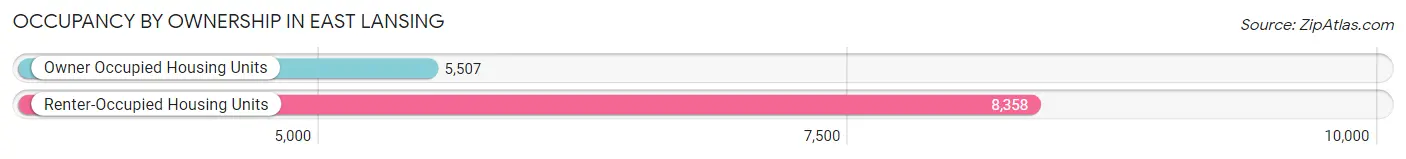
Of the total 13,865 dwellings in East Lansing, owner-occupied units account for 5,507 (39.7%), while renter-occupied units make up 8,358 (60.3%).
| Occupancy | # Housing Units | % Housing Units |
| Owner Occupied Housing Units | 5,507 | 39.7% |
| Renter-Occupied Housing Units | 8,358 | 60.3% |
| Total Occupied Housing Units | 13,865 | 100.0% |
Occupancy by Household Size in East Lansing
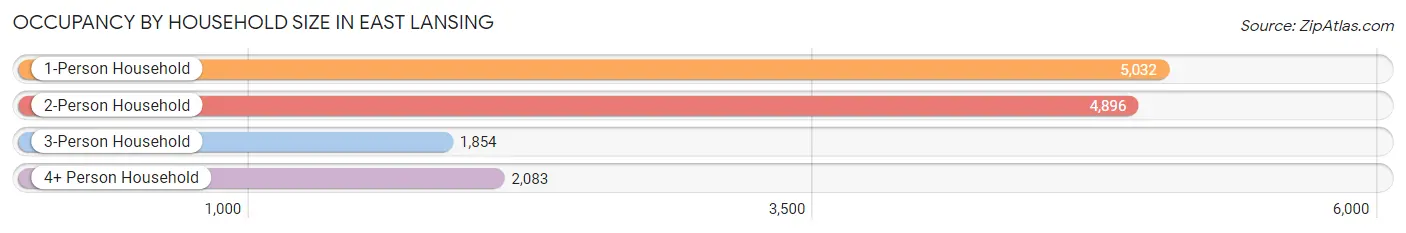
| Household Size | # Housing Units | % Housing Units |
| 1-Person Household | 5,032 | 36.3% |
| 2-Person Household | 4,896 | 35.3% |
| 3-Person Household | 1,854 | 13.4% |
| 4+ Person Household | 2,083 | 15.0% |
| Total Housing Units | 13,865 | 100.0% |
Occupancy by Ownership by Household Size in East Lansing
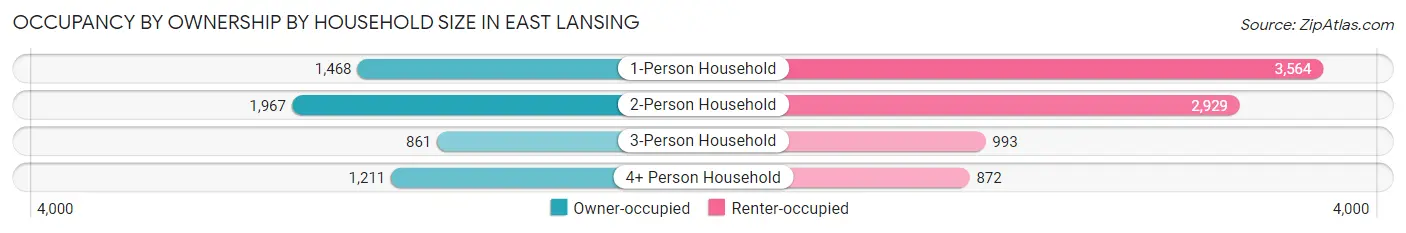
| Household Size | Owner-occupied | Renter-occupied |
| 1-Person Household | 1,468 (29.2%) | 3,564 (70.8%) |
| 2-Person Household | 1,967 (40.2%) | 2,929 (59.8%) |
| 3-Person Household | 861 (46.4%) | 993 (53.6%) |
| 4+ Person Household | 1,211 (58.1%) | 872 (41.9%) |
| Total Housing Units | 5,507 (39.7%) | 8,358 (60.3%) |
Occupancy by Educational Attainment in East Lansing
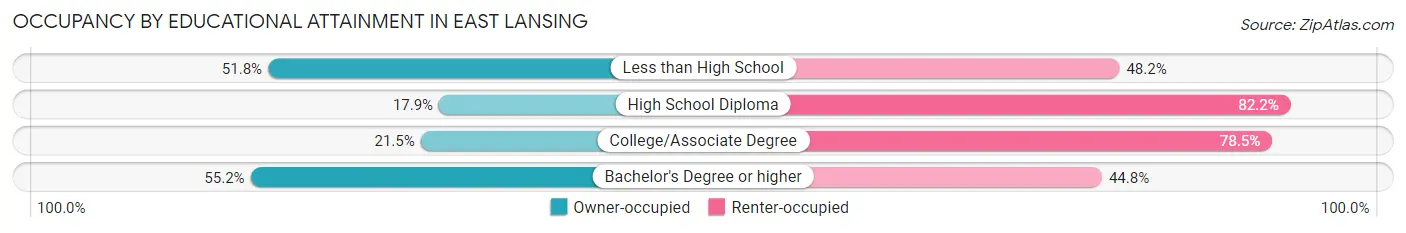
| Household Size | Owner-occupied | Renter-occupied |
| Less than High School | 88 (51.8%) | 82 (48.2%) |
| High School Diploma | 236 (17.8%) | 1,086 (82.2%) |
| College/Associate Degree | 1,052 (21.5%) | 3,841 (78.5%) |
| Bachelor's Degree or higher | 4,131 (55.2%) | 3,349 (44.8%) |
Occupancy by Age of Householder in East Lansing
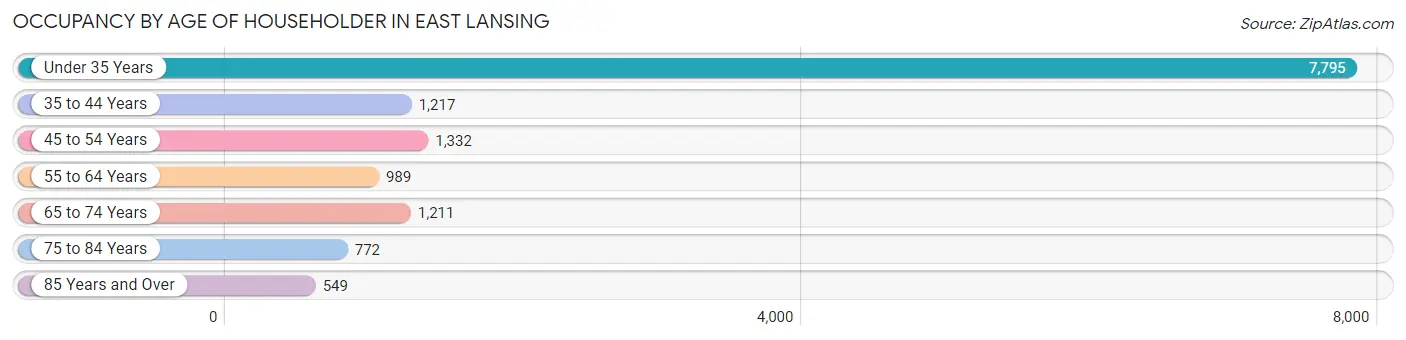
| Age Bracket | # Households | % Households |
| Under 35 Years | 7,795 | 56.2% |
| 35 to 44 Years | 1,217 | 8.8% |
| 45 to 54 Years | 1,332 | 9.6% |
| 55 to 64 Years | 989 | 7.1% |
| 65 to 74 Years | 1,211 | 8.7% |
| 75 to 84 Years | 772 | 5.6% |
| 85 Years and Over | 549 | 4.0% |
| Total | 13,865 | 100.0% |
Housing Finances in East Lansing
Median Income by Occupancy in East Lansing
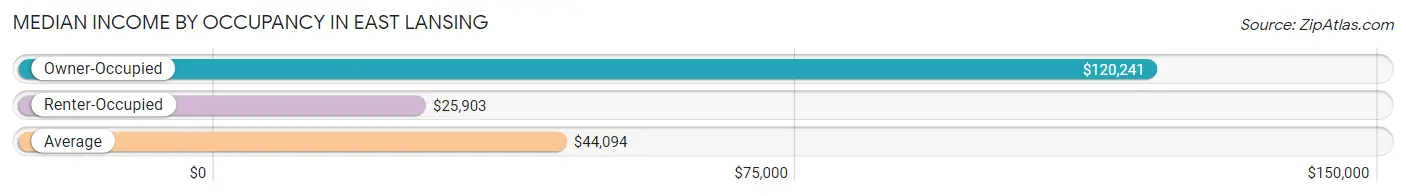
| Occupancy Type | # Households | Median Income |
| Owner-Occupied | 5,507 (39.7%) | $120,241 |
| Renter-Occupied | 8,358 (60.3%) | $25,903 |
| Average | 13,865 (100.0%) | $44,094 |
Occupancy by Householder Income Bracket in East Lansing
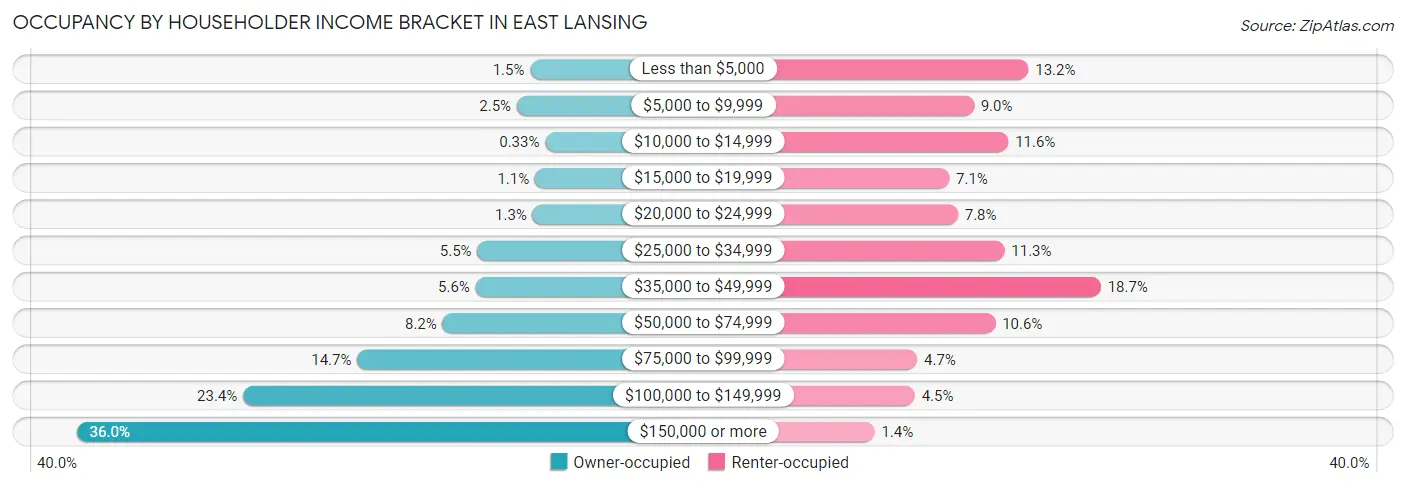
| Income Bracket | Owner-occupied | Renter-occupied |
| Less than $5,000 | 81 (1.5%) | 1,100 (13.2%) |
| $5,000 to $9,999 | 137 (2.5%) | 752 (9.0%) |
| $10,000 to $14,999 | 18 (0.3%) | 972 (11.6%) |
| $15,000 to $19,999 | 61 (1.1%) | 596 (7.1%) |
| $20,000 to $24,999 | 71 (1.3%) | 651 (7.8%) |
| $25,000 to $34,999 | 303 (5.5%) | 948 (11.3%) |
| $35,000 to $49,999 | 310 (5.6%) | 1,561 (18.7%) |
| $50,000 to $74,999 | 449 (8.2%) | 889 (10.6%) |
| $75,000 to $99,999 | 807 (14.6%) | 392 (4.7%) |
| $100,000 to $149,999 | 1,286 (23.4%) | 377 (4.5%) |
| $150,000 or more | 1,984 (36.0%) | 120 (1.4%) |
| Total | 5,507 (100.0%) | 8,358 (100.0%) |
Monthly Housing Cost Tiers in East Lansing
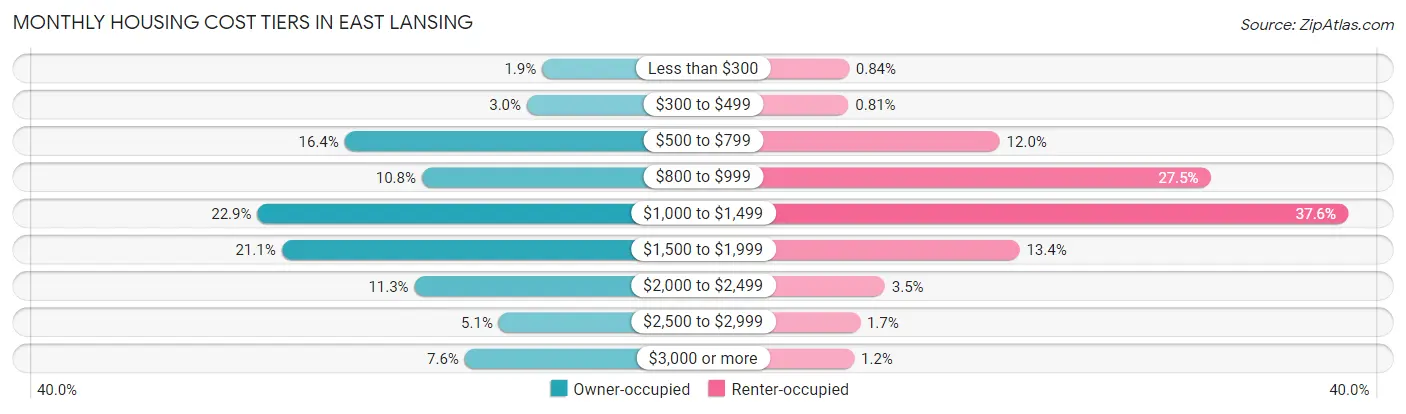
| Monthly Cost | Owner-occupied | Renter-occupied |
| Less than $300 | 104 (1.9%) | 70 (0.8%) |
| $300 to $499 | 166 (3.0%) | 68 (0.8%) |
| $500 to $799 | 905 (16.4%) | 999 (11.9%) |
| $800 to $999 | 592 (10.7%) | 2,296 (27.5%) |
| $1,000 to $1,499 | 1,259 (22.9%) | 3,142 (37.6%) |
| $1,500 to $1,999 | 1,161 (21.1%) | 1,121 (13.4%) |
| $2,000 to $2,499 | 622 (11.3%) | 292 (3.5%) |
| $2,500 to $2,999 | 280 (5.1%) | 139 (1.7%) |
| $3,000 or more | 418 (7.6%) | 103 (1.2%) |
| Total | 5,507 (100.0%) | 8,358 (100.0%) |
Physical Housing Characteristics in East Lansing
Housing Structures in East Lansing
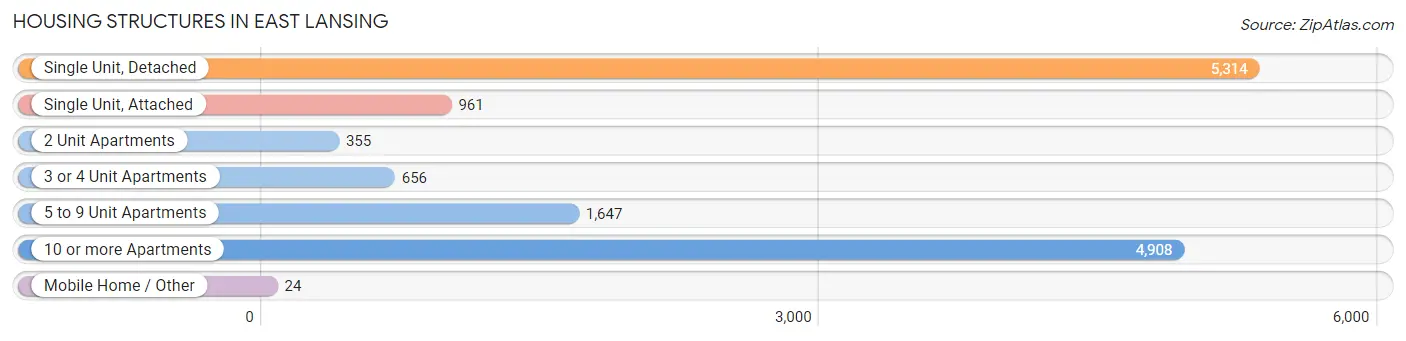
| Structure Type | # Housing Units | % Housing Units |
| Single Unit, Detached | 5,314 | 38.3% |
| Single Unit, Attached | 961 | 6.9% |
| 2 Unit Apartments | 355 | 2.6% |
| 3 or 4 Unit Apartments | 656 | 4.7% |
| 5 to 9 Unit Apartments | 1,647 | 11.9% |
| 10 or more Apartments | 4,908 | 35.4% |
| Mobile Home / Other | 24 | 0.2% |
| Total | 13,865 | 100.0% |
Housing Structures by Occupancy in East Lansing
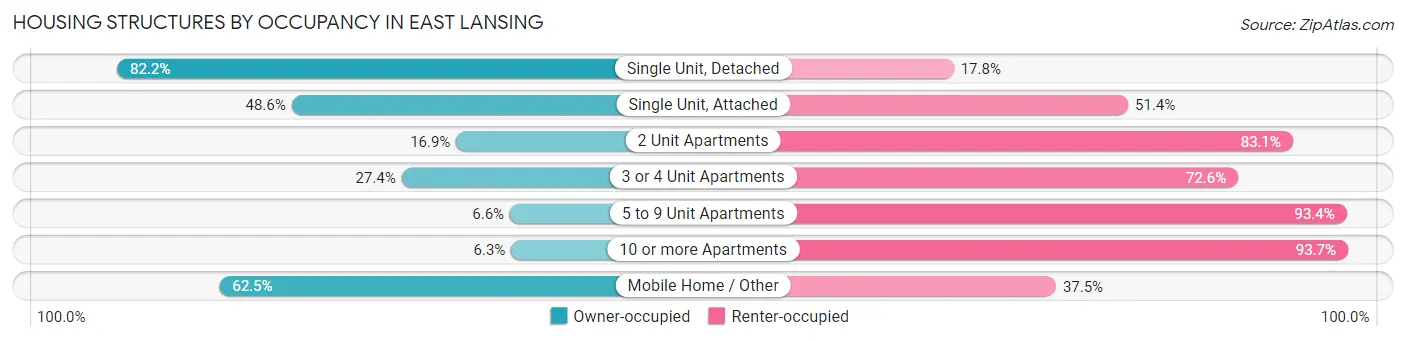
| Structure Type | Owner-occupied | Renter-occupied |
| Single Unit, Detached | 4,367 (82.2%) | 947 (17.8%) |
| Single Unit, Attached | 467 (48.6%) | 494 (51.4%) |
| 2 Unit Apartments | 60 (16.9%) | 295 (83.1%) |
| 3 or 4 Unit Apartments | 180 (27.4%) | 476 (72.6%) |
| 5 to 9 Unit Apartments | 108 (6.6%) | 1,539 (93.4%) |
| 10 or more Apartments | 310 (6.3%) | 4,598 (93.7%) |
| Mobile Home / Other | 15 (62.5%) | 9 (37.5%) |
| Total | 5,507 (39.7%) | 8,358 (60.3%) |
Housing Structures by Number of Rooms in East Lansing
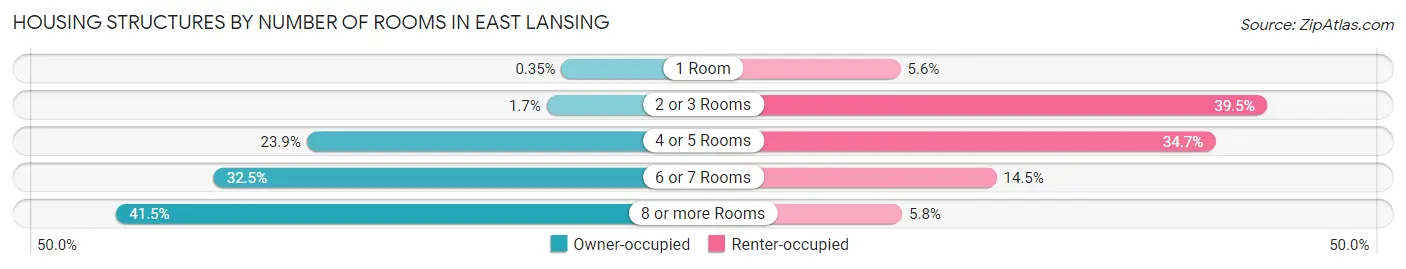
| Number of Rooms | Owner-occupied | Renter-occupied |
| 1 Room | 19 (0.4%) | 469 (5.6%) |
| 2 or 3 Rooms | 95 (1.7%) | 3,297 (39.5%) |
| 4 or 5 Rooms | 1,317 (23.9%) | 2,900 (34.7%) |
| 6 or 7 Rooms | 1,790 (32.5%) | 1,211 (14.5%) |
| 8 or more Rooms | 2,286 (41.5%) | 481 (5.8%) |
| Total | 5,507 (100.0%) | 8,358 (100.0%) |
Housing Structure by Heating Type in East Lansing
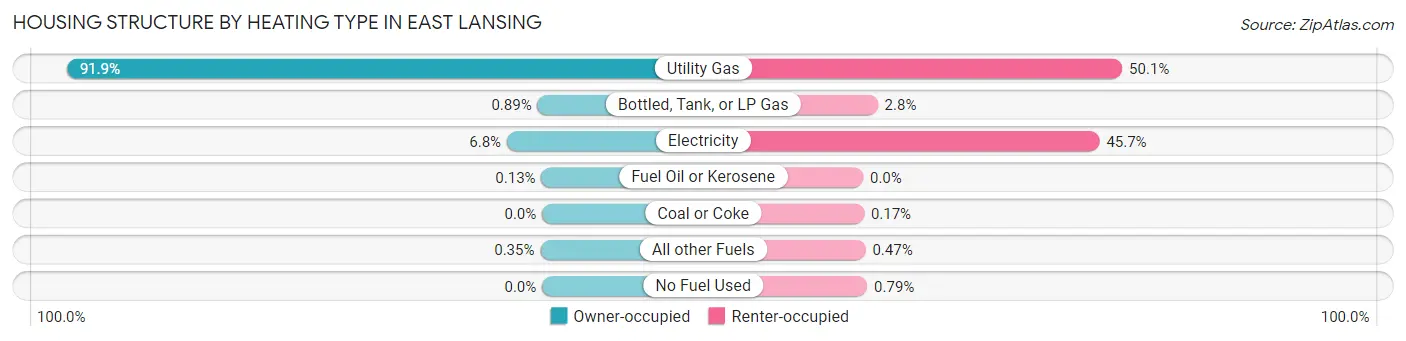
| Heating Type | Owner-occupied | Renter-occupied |
| Utility Gas | 5,058 (91.8%) | 4,185 (50.1%) |
| Bottled, Tank, or LP Gas | 49 (0.9%) | 236 (2.8%) |
| Electricity | 374 (6.8%) | 3,818 (45.7%) |
| Fuel Oil or Kerosene | 7 (0.1%) | 0 (0.0%) |
| Coal or Coke | 0 (0.0%) | 14 (0.2%) |
| All other Fuels | 19 (0.4%) | 39 (0.5%) |
| No Fuel Used | 0 (0.0%) | 66 (0.8%) |
| Total | 5,507 (100.0%) | 8,358 (100.0%) |
Household Vehicle Usage in East Lansing
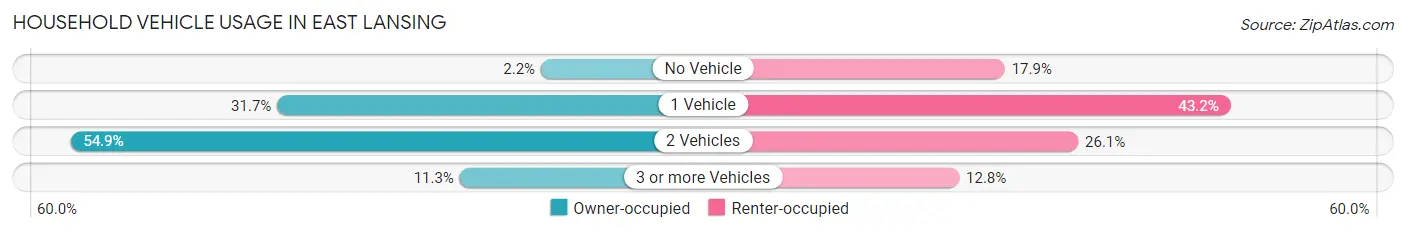
| Vehicles per Household | Owner-occupied | Renter-occupied |
| No Vehicle | 119 (2.2%) | 1,496 (17.9%) |
| 1 Vehicle | 1,746 (31.7%) | 3,610 (43.2%) |
| 2 Vehicles | 3,022 (54.9%) | 2,183 (26.1%) |
| 3 or more Vehicles | 620 (11.3%) | 1,069 (12.8%) |
| Total | 5,507 (100.0%) | 8,358 (100.0%) |
Real Estate & Mortgages in East Lansing
Real Estate and Mortgage Overview in East Lansing
| Characteristic | Without Mortgage | With Mortgage |
| Housing Units | 1,949 | 3,558 |
| Median Property Value | $228,300 | $247,500 |
| Median Household Income | $100,739 | $1,399 |
| Monthly Housing Costs | $813 | $418 |
| Real Estate Taxes | $4,847 | $39 |
Property Value by Mortgage Status in East Lansing
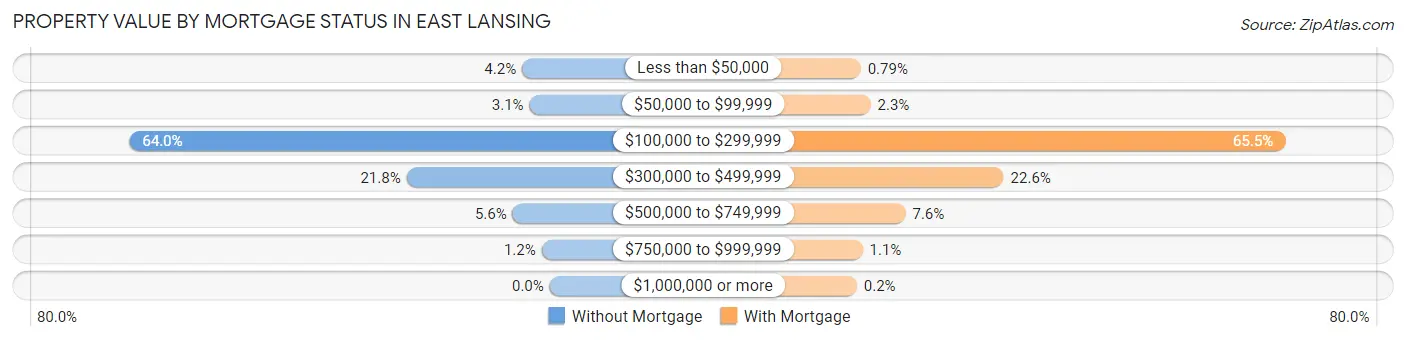
| Property Value | Without Mortgage | With Mortgage |
| Less than $50,000 | 82 (4.2%) | 28 (0.8%) |
| $50,000 to $99,999 | 60 (3.1%) | 82 (2.3%) |
| $100,000 to $299,999 | 1,248 (64.0%) | 2,329 (65.5%) |
| $300,000 to $499,999 | 425 (21.8%) | 803 (22.6%) |
| $500,000 to $749,999 | 110 (5.6%) | 271 (7.6%) |
| $750,000 to $999,999 | 24 (1.2%) | 38 (1.1%) |
| $1,000,000 or more | 0 (0.0%) | 7 (0.2%) |
| Total | 1,949 (100.0%) | 3,558 (100.0%) |
Household Income by Mortgage Status in East Lansing
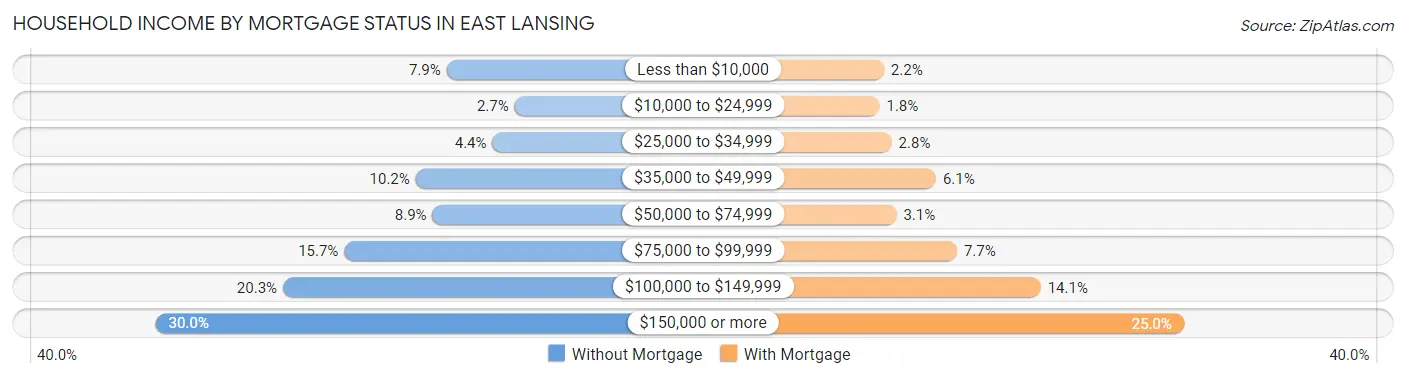
| Household Income | Without Mortgage | With Mortgage |
| Less than $10,000 | 153 (7.9%) | 77 (2.2%) |
| $10,000 to $24,999 | 52 (2.7%) | 65 (1.8%) |
| $25,000 to $34,999 | 85 (4.4%) | 98 (2.8%) |
| $35,000 to $49,999 | 199 (10.2%) | 218 (6.1%) |
| $50,000 to $74,999 | 174 (8.9%) | 111 (3.1%) |
| $75,000 to $99,999 | 305 (15.7%) | 275 (7.7%) |
| $100,000 to $149,999 | 396 (20.3%) | 502 (14.1%) |
| $150,000 or more | 585 (30.0%) | 890 (25.0%) |
| Total | 1,949 (100.0%) | 3,558 (100.0%) |
Property Value to Household Income Ratio in East Lansing
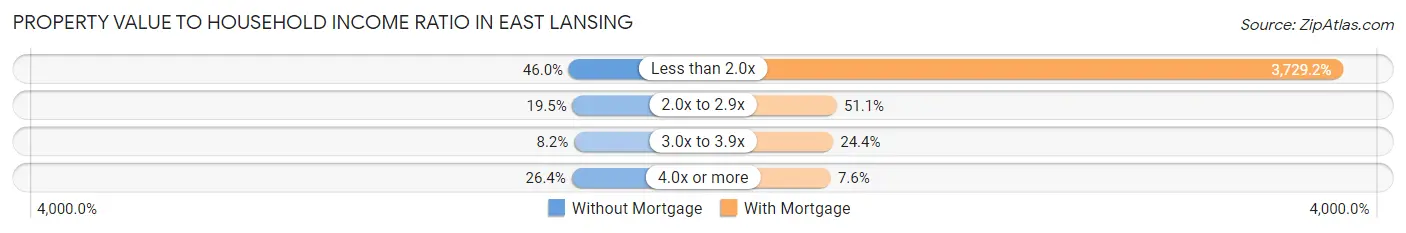
| Value-to-Income Ratio | Without Mortgage | With Mortgage |
| Less than 2.0x | 896 (46.0%) | 132,684 (3,729.2%) |
| 2.0x to 2.9x | 380 (19.5%) | 1,817 (51.1%) |
| 3.0x to 3.9x | 159 (8.2%) | 868 (24.4%) |
| 4.0x or more | 514 (26.4%) | 272 (7.6%) |
| Total | 1,949 (100.0%) | 3,558 (100.0%) |
Real Estate Taxes by Mortgage Status in East Lansing
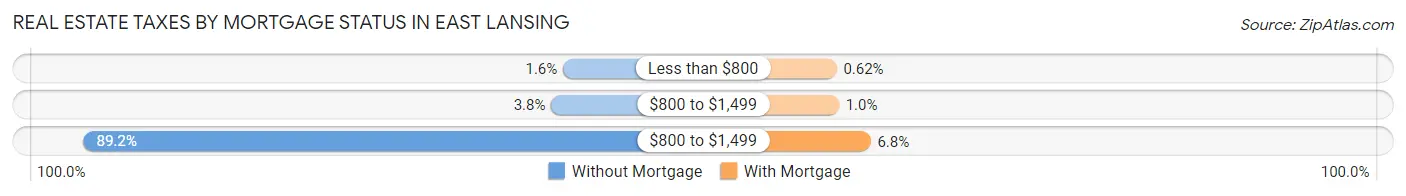
| Property Taxes | Without Mortgage | With Mortgage |
| Less than $800 | 32 (1.6%) | 22 (0.6%) |
| $800 to $1,499 | 74 (3.8%) | 37 (1.0%) |
| $800 to $1,499 | 1,739 (89.2%) | 243 (6.8%) |
| Total | 1,949 (100.0%) | 3,558 (100.0%) |
Health & Disability in East Lansing
Health Insurance Coverage by Age in East Lansing
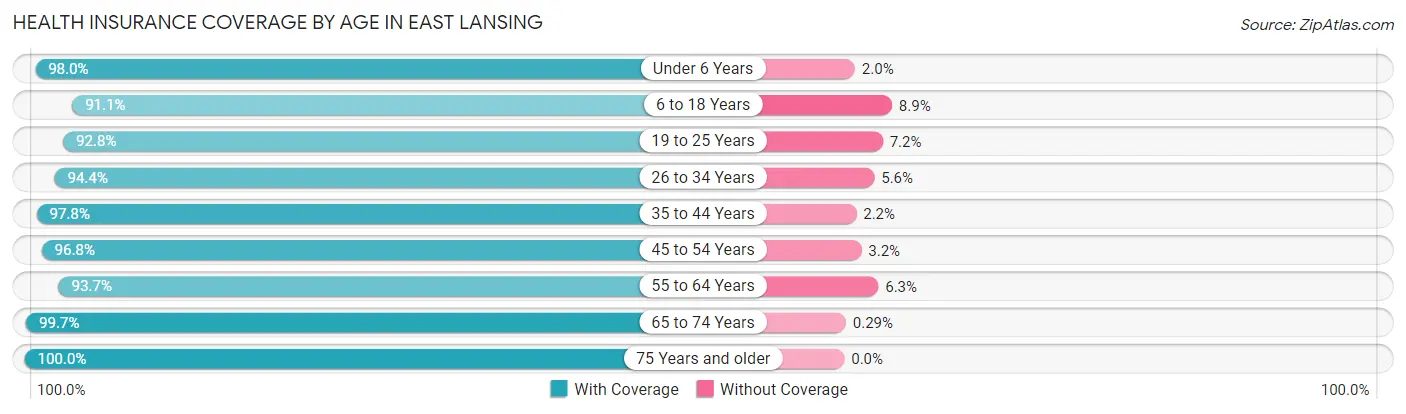
| Age Bracket | With Coverage | Without Coverage |
| Under 6 Years | 1,186 (98.0%) | 24 (2.0%) |
| 6 to 18 Years | 7,276 (91.1%) | 709 (8.9%) |
| 19 to 25 Years | 20,503 (92.8%) | 1,583 (7.2%) |
| 26 to 34 Years | 3,326 (94.4%) | 197 (5.6%) |
| 35 to 44 Years | 2,371 (97.8%) | 54 (2.2%) |
| 45 to 54 Years | 2,285 (96.8%) | 75 (3.2%) |
| 55 to 64 Years | 1,596 (93.7%) | 108 (6.3%) |
| 65 to 74 Years | 2,099 (99.7%) | 6 (0.3%) |
| 75 Years and older | 1,682 (100.0%) | 0 (0.0%) |
| Total | 42,324 (93.9%) | 2,756 (6.1%) |
Health Insurance Coverage by Citizenship Status in East Lansing
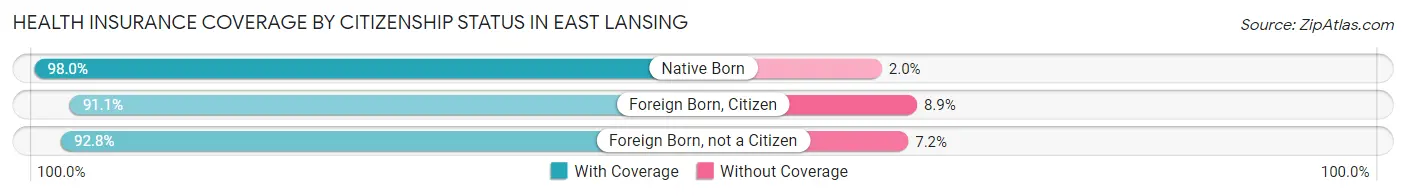
| Citizenship Status | With Coverage | Without Coverage |
| Native Born | 1,186 (98.0%) | 24 (2.0%) |
| Foreign Born, Citizen | 7,276 (91.1%) | 709 (8.9%) |
| Foreign Born, not a Citizen | 20,503 (92.8%) | 1,583 (7.2%) |
Health Insurance Coverage by Household Income in East Lansing
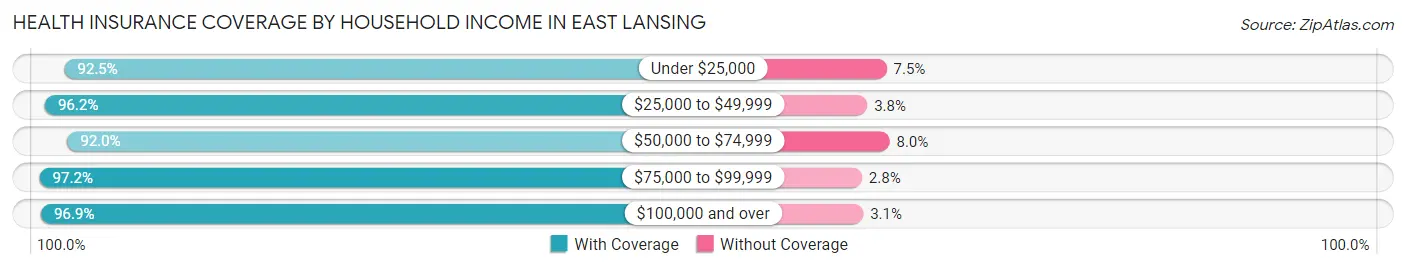
| Household Income | With Coverage | Without Coverage |
| Under $25,000 | 6,845 (92.5%) | 552 (7.5%) |
| $25,000 to $49,999 | 6,181 (96.2%) | 246 (3.8%) |
| $50,000 to $74,999 | 2,964 (92.0%) | 258 (8.0%) |
| $75,000 to $99,999 | 2,749 (97.2%) | 80 (2.8%) |
| $100,000 and over | 10,309 (96.9%) | 328 (3.1%) |
Public vs Private Health Insurance Coverage by Age in East Lansing
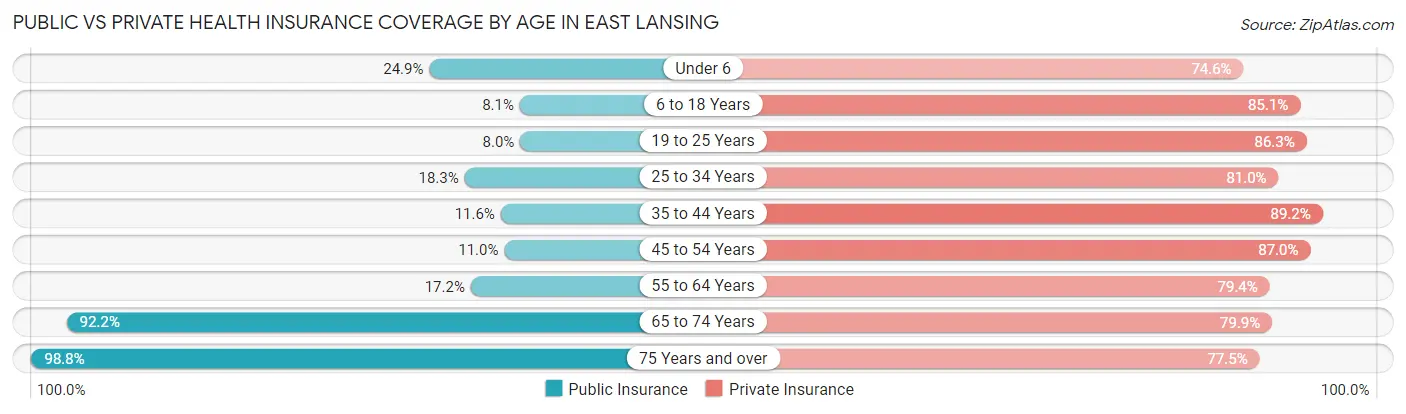
| Age Bracket | Public Insurance | Private Insurance |
| Under 6 | 301 (24.9%) | 902 (74.6%) |
| 6 to 18 Years | 645 (8.1%) | 6,793 (85.1%) |
| 19 to 25 Years | 1,768 (8.0%) | 19,050 (86.3%) |
| 25 to 34 Years | 646 (18.3%) | 2,855 (81.0%) |
| 35 to 44 Years | 282 (11.6%) | 2,164 (89.2%) |
| 45 to 54 Years | 259 (11.0%) | 2,052 (87.0%) |
| 55 to 64 Years | 293 (17.2%) | 1,353 (79.4%) |
| 65 to 74 Years | 1,941 (92.2%) | 1,681 (79.9%) |
| 75 Years and over | 1,661 (98.8%) | 1,304 (77.5%) |
| Total | 7,796 (17.3%) | 38,154 (84.6%) |
Disability Status by Sex by Age in East Lansing
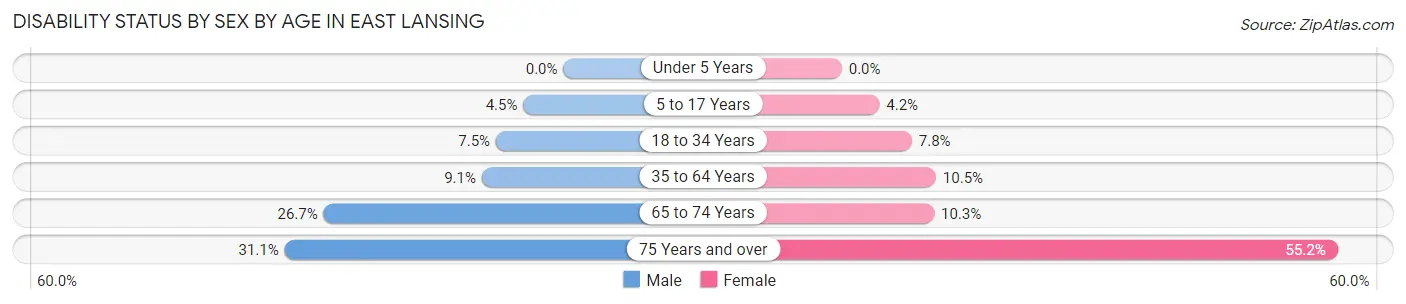
| Age Bracket | Male | Female |
| Under 5 Years | 0 (0.0%) | 0 (0.0%) |
| 5 to 17 Years | 69 (4.5%) | 65 (4.2%) |
| 18 to 34 Years | 1,141 (7.5%) | 1,214 (7.8%) |
| 35 to 64 Years | 286 (9.1%) | 350 (10.5%) |
| 65 to 74 Years | 258 (26.7%) | 117 (10.3%) |
| 75 Years and over | 231 (31.0%) | 518 (55.2%) |
Disability Class by Sex by Age in East Lansing
Disability Class: Hearing Difficulty
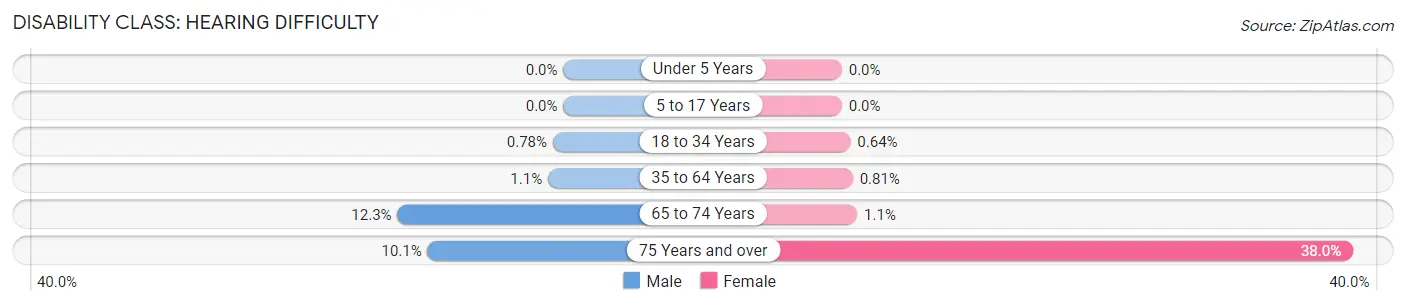
| Age Bracket | Male | Female |
| Under 5 Years | 0 (0.0%) | 0 (0.0%) |
| 5 to 17 Years | 0 (0.0%) | 0 (0.0%) |
| 18 to 34 Years | 119 (0.8%) | 99 (0.6%) |
| 35 to 64 Years | 36 (1.1%) | 27 (0.8%) |
| 65 to 74 Years | 119 (12.3%) | 13 (1.1%) |
| 75 Years and over | 75 (10.1%) | 356 (38.0%) |
Disability Class: Vision Difficulty
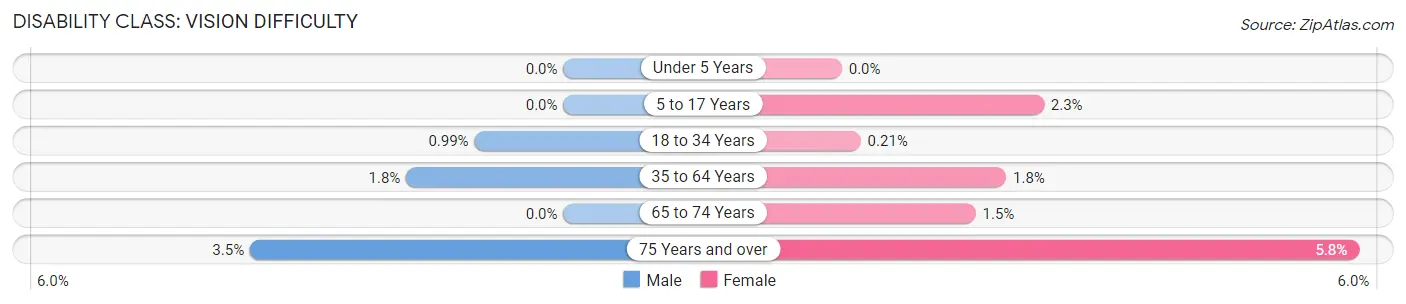
| Age Bracket | Male | Female |
| Under 5 Years | 0 (0.0%) | 0 (0.0%) |
| 5 to 17 Years | 0 (0.0%) | 35 (2.2%) |
| 18 to 34 Years | 151 (1.0%) | 32 (0.2%) |
| 35 to 64 Years | 55 (1.8%) | 61 (1.8%) |
| 65 to 74 Years | 0 (0.0%) | 17 (1.5%) |
| 75 Years and over | 26 (3.5%) | 54 (5.8%) |
Disability Class: Cognitive Difficulty
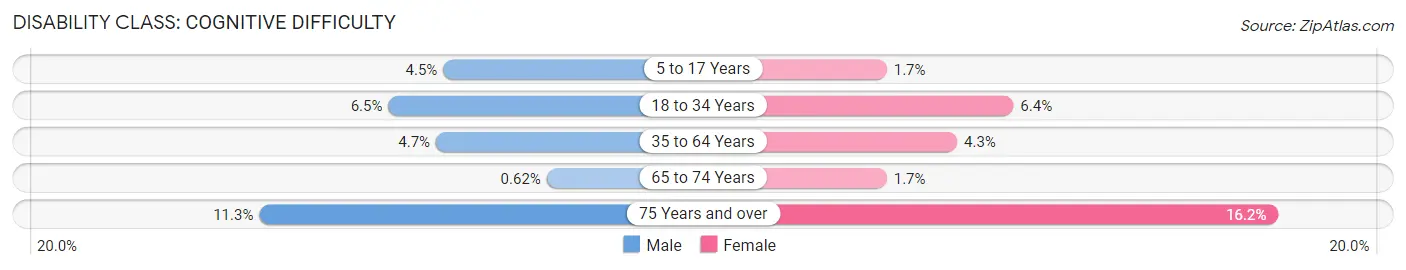
| Age Bracket | Male | Female |
| 5 to 17 Years | 69 (4.5%) | 26 (1.7%) |
| 18 to 34 Years | 987 (6.5%) | 992 (6.4%) |
| 35 to 64 Years | 149 (4.7%) | 143 (4.3%) |
| 65 to 74 Years | 6 (0.6%) | 19 (1.7%) |
| 75 Years and over | 84 (11.3%) | 152 (16.2%) |
Disability Class: Ambulatory Difficulty
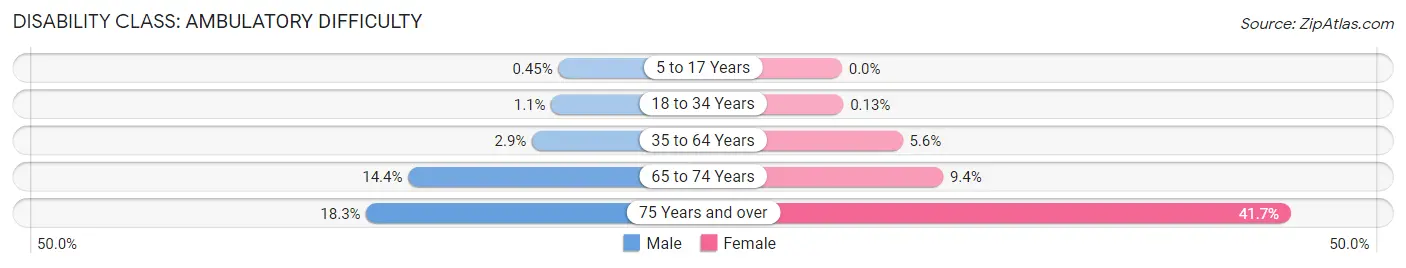
| Age Bracket | Male | Female |
| 5 to 17 Years | 7 (0.4%) | 0 (0.0%) |
| 18 to 34 Years | 169 (1.1%) | 21 (0.1%) |
| 35 to 64 Years | 91 (2.9%) | 188 (5.6%) |
| 65 to 74 Years | 139 (14.4%) | 107 (9.4%) |
| 75 Years and over | 136 (18.3%) | 391 (41.7%) |
Disability Class: Self-Care Difficulty
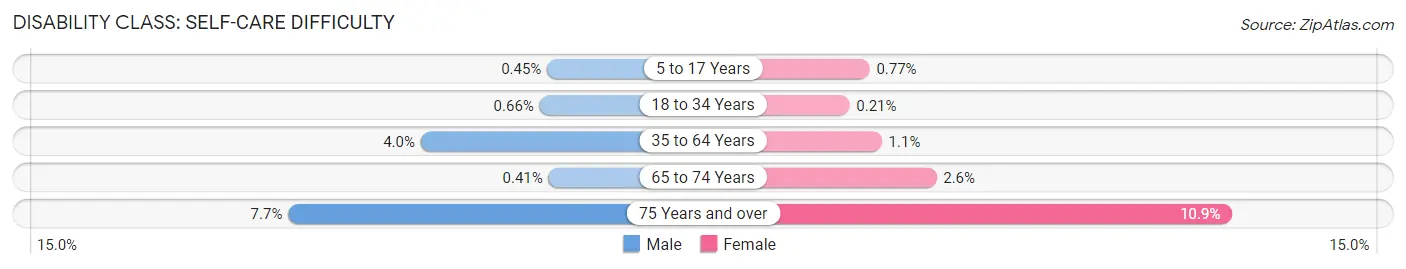
| Age Bracket | Male | Female |
| 5 to 17 Years | 7 (0.4%) | 12 (0.8%) |
| 18 to 34 Years | 101 (0.7%) | 33 (0.2%) |
| 35 to 64 Years | 125 (4.0%) | 37 (1.1%) |
| 65 to 74 Years | 4 (0.4%) | 30 (2.6%) |
| 75 Years and over | 57 (7.7%) | 102 (10.9%) |
Technology Access in East Lansing
Computing Device Access in East Lansing
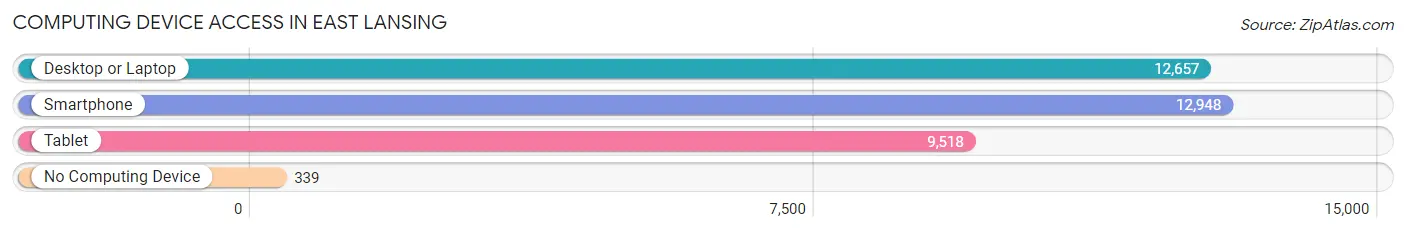
| Device Type | # Households | % Households |
| Desktop or Laptop | 12,657 | 91.3% |
| Smartphone | 12,948 | 93.4% |
| Tablet | 9,518 | 68.6% |
| No Computing Device | 339 | 2.5% |
| Total | 13,865 | 100.0% |
Internet Access in East Lansing
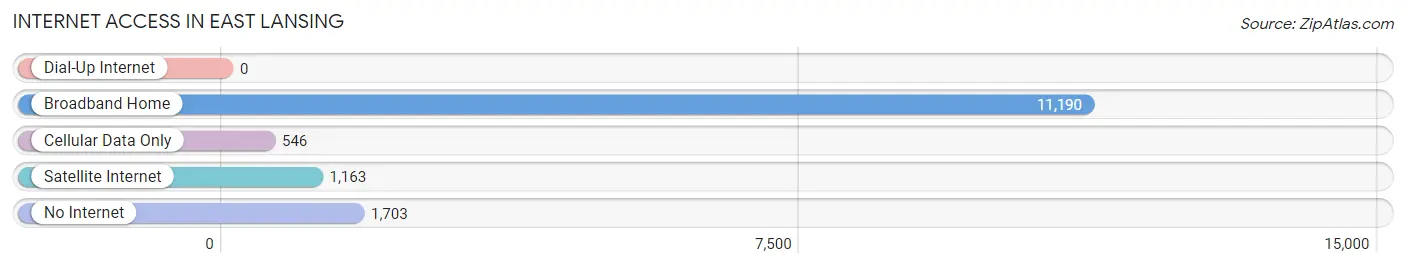
| Internet Type | # Households | % Households |
| Dial-Up Internet | 0 | 0.0% |
| Broadband Home | 11,190 | 80.7% |
| Cellular Data Only | 546 | 3.9% |
| Satellite Internet | 1,163 | 8.4% |
| No Internet | 1,703 | 12.3% |
| Total | 13,865 | 100.0% |
East Lansing Summary
History
East Lansing, Michigan is a city located in Ingham County, Michigan. It is part of the Lansing-East Lansing Metropolitan Statistical Area and is home to Michigan State University. The city was founded in 1847 by a group of settlers from New York who were looking for a place to settle and build a new community. The city was originally known as Collegeville, due to its proximity to the college that would eventually become Michigan State University. The city was officially incorporated in 1907 and changed its name to East Lansing in 1908.
East Lansing has a rich history of being a college town. The city was home to the first public university in the state of Michigan, the Agricultural College of the State of Michigan, which was founded in 1855. The college was later renamed Michigan State University in 1925. The university has grown to become one of the largest universities in the United States and is a major economic driver for the city.
East Lansing has also been home to a number of notable people, including former President Gerald Ford, who attended the university. The city has also been home to a number of prominent athletes, including Magic Johnson, who attended the university and played basketball for the Spartans.
Geography
East Lansing is located in the central part of Michigan, in Ingham County. The city is situated on the banks of the Red Cedar River, which flows through the city. The city is bordered by Lansing to the west, Haslett to the north, and Okemos to the east. The city covers an area of approximately 10.5 square miles and has a population of approximately 48,000 people.
The city is located in a temperate climate zone, with hot summers and cold winters. The average temperature in the summer is around 75 degrees Fahrenheit, while the average temperature in the winter is around 25 degrees Fahrenheit. The city receives an average of 36 inches of precipitation per year.
Economy
East Lansing is home to a diverse economy, with a number of industries contributing to the city’s economic growth. The city is home to a number of large employers, including Michigan State University, Sparrow Health System, and the State of Michigan. The city is also home to a number of small businesses, including restaurants, retail stores, and professional services.
The city’s economy is largely driven by the university, which is the largest employer in the city. The university employs over 20,000 people and has an annual economic impact of over $2 billion. The university also attracts a large number of students and visitors to the city, which helps to support the local economy.
Demographics
As of the 2010 census, the population of East Lansing was 48,579. The city has a population density of 4,541 people per square mile. The racial makeup of the city is 79.2% White, 8.3% African American, 5.2% Asian, and 4.3% Hispanic or Latino.
The median household income in East Lansing is $45,945, and the median family income is $62,917. The city has a poverty rate of 22.3%, which is higher than the national average. The city also has a high cost of living, with the median home value being $212,400.
East Lansing is a diverse city, with a variety of cultures and backgrounds represented. The city is home to a large student population, as well as a number of professionals and families. The city is also home to a number of cultural attractions, including the East Lansing Art Festival, the East Lansing Film Festival, and the East Lansing Jazz Festival.
Common Questions
What is Per Capita Income in East Lansing?
Per Capita income in East Lansing is $29,297.
What is the Median Family Income in East Lansing?
Median Family Income in East Lansing is $121,250.
What is the Median Household income in East Lansing?
Median Household Income in East Lansing is $44,094.
What is Income or Wage Gap in East Lansing?
Income or Wage Gap in East Lansing is 24.7%.
Women in East Lansing earn 75.3 cents for every dollar earned by a man.
What is Family Income Deficit in East Lansing?
Family Income Deficit in East Lansing is $7,025.
Families that are below poverty line in East Lansing earn $7,025 less on average than the poverty threshold level.
What is Inequality or Gini Index in East Lansing?
Inequality or Gini Index in East Lansing is 0.60.
What is the Total Population of East Lansing?
Total Population of East Lansing is 45,403.
What is the Total Male Population of East Lansing?
Total Male Population of East Lansing is 22,307.
What is the Total Female Population of East Lansing?
Total Female Population of East Lansing is 23,096.
What is the Ratio of Males per 100 Females in East Lansing?
There are 96.58 Males per 100 Females in East Lansing.
What is the Ratio of Females per 100 Males in East Lansing?
There are 103.54 Females per 100 Males in East Lansing.
What is the Median Population Age in East Lansing?
Median Population Age in East Lansing is 21.4 Years.
What is the Average Family Size in East Lansing
Average Family Size in East Lansing is 2.9 People.
What is the Average Household Size in East Lansing
Average Household Size in East Lansing is 2.2 People.
How Large is the Labor Force in East Lansing?
There are 23,650 People in the Labor Forcein in East Lansing.
What is the Percentage of People in the Labor Force in East Lansing?
56.3% of People are in the Labor Force in East Lansing.
What is the Unemployment Rate in East Lansing?
Unemployment Rate in East Lansing is 6.7%.