Allen Park, MI Map & Demographics
Allen Park Map
Allen Park Overview
$39,032
PER CAPITA INCOME
$97,118
AVG FAMILY INCOME
$73,792
AVG HOUSEHOLD INCOME
24.2%
WAGE / INCOME GAP [ % ]
75.8¢/ $1
WAGE / INCOME GAP [ $ ]
0.40
INEQUALITY / GINI INDEX
28,395
TOTAL POPULATION
13,427
MALE POPULATION
14,968
FEMALE POPULATION
89.70
MALES / 100 FEMALES
111.48
FEMALES / 100 MALES
43.5
MEDIAN AGE
3.0
AVG FAMILY SIZE
2.4
AVG HOUSEHOLD SIZE
14,858
LABOR FORCE [ PEOPLE ]
63.3%
PERCENT IN LABOR FORCE
6.0%
UNEMPLOYMENT RATE
Allen Park Zip Codes
Income in Allen Park
Income Overview in Allen Park
Per Capita Income in Allen Park is $39,032, while median incomes of families and households are $97,118 and $73,792 respectively.
| Characteristic | Number | Measure |
| Per Capita Income | 28,395 | $39,032 |
| Median Family Income | 7,556 | $97,118 |
| Mean Family Income | 7,556 | $109,332 |
| Median Household Income | 11,854 | $73,792 |
| Mean Household Income | 11,854 | $91,552 |
| Income Deficit | 7,556 | $0 |
| Wage / Income Gap (%) | 28,395 | 24.23% |
| Wage / Income Gap ($) | 28,395 | 75.77¢ per $1 |
| Gini / Inequality Index | 28,395 | 0.40 |
Earnings by Sex in Allen Park
Average Earnings in Allen Park are $48,915, $57,161 for men and $43,310 for women, a difference of 24.2%.
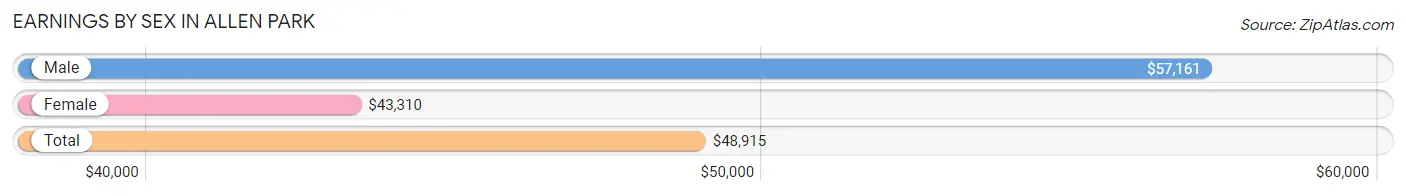
| Sex | Number | Average Earnings |
| Male | 7,862 (52.0%) | $57,161 |
| Female | 7,266 (48.0%) | $43,310 |
| Total | 15,128 (100.0%) | $48,915 |
Earnings by Sex by Income Bracket in Allen Park
The most common earnings brackets in Allen Park are $100,000+ for men (1,475 | 18.8%) and $55,000 to $64,999 for women (1,042 | 14.3%).
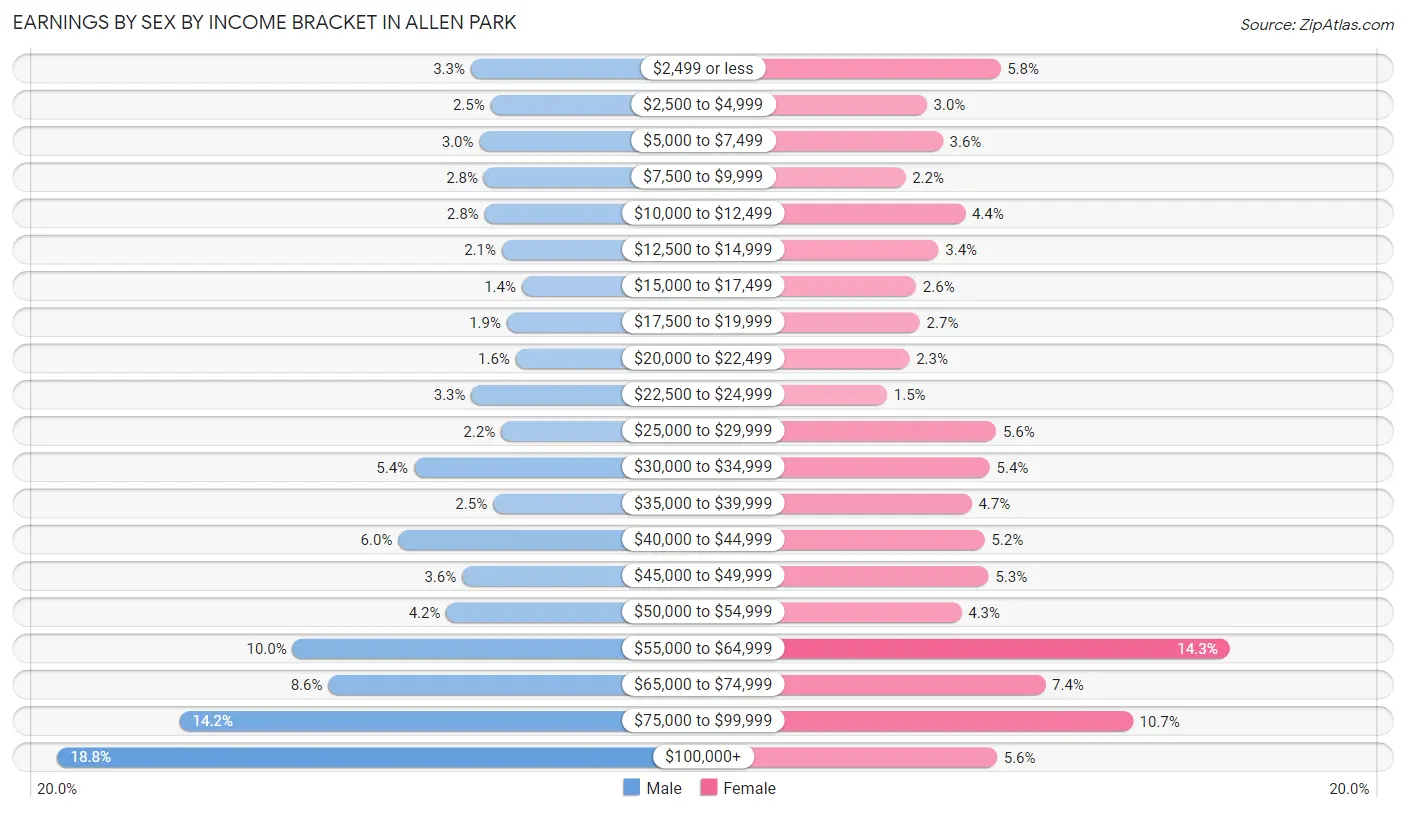
| Income | Male | Female |
| $2,499 or less | 258 (3.3%) | 418 (5.8%) |
| $2,500 to $4,999 | 200 (2.5%) | 217 (3.0%) |
| $5,000 to $7,499 | 233 (3.0%) | 261 (3.6%) |
| $7,500 to $9,999 | 219 (2.8%) | 159 (2.2%) |
| $10,000 to $12,499 | 218 (2.8%) | 322 (4.4%) |
| $12,500 to $14,999 | 167 (2.1%) | 249 (3.4%) |
| $15,000 to $17,499 | 108 (1.4%) | 188 (2.6%) |
| $17,500 to $19,999 | 152 (1.9%) | 198 (2.7%) |
| $20,000 to $22,499 | 126 (1.6%) | 170 (2.3%) |
| $22,500 to $24,999 | 256 (3.3%) | 109 (1.5%) |
| $25,000 to $29,999 | 169 (2.1%) | 406 (5.6%) |
| $30,000 to $34,999 | 425 (5.4%) | 389 (5.3%) |
| $35,000 to $39,999 | 193 (2.5%) | 339 (4.7%) |
| $40,000 to $44,999 | 472 (6.0%) | 375 (5.2%) |
| $45,000 to $49,999 | 284 (3.6%) | 386 (5.3%) |
| $50,000 to $54,999 | 330 (4.2%) | 312 (4.3%) |
| $55,000 to $64,999 | 783 (10.0%) | 1,042 (14.3%) |
| $65,000 to $74,999 | 678 (8.6%) | 540 (7.4%) |
| $75,000 to $99,999 | 1,116 (14.2%) | 778 (10.7%) |
| $100,000+ | 1,475 (18.8%) | 408 (5.6%) |
| Total | 7,862 (100.0%) | 7,266 (100.0%) |
Earnings by Sex by Educational Attainment in Allen Park
Average earnings in Allen Park are $62,188 for men and $47,646 for women, a difference of 23.4%. Men with an educational attainment of graduate degree enjoy the highest average annual earnings of $106,161, while those with less than high school education earn the least with $45,625. Women with an educational attainment of graduate degree earn the most with the average annual earnings of $66,103, while those with high school diploma education have the smallest earnings of $29,870.
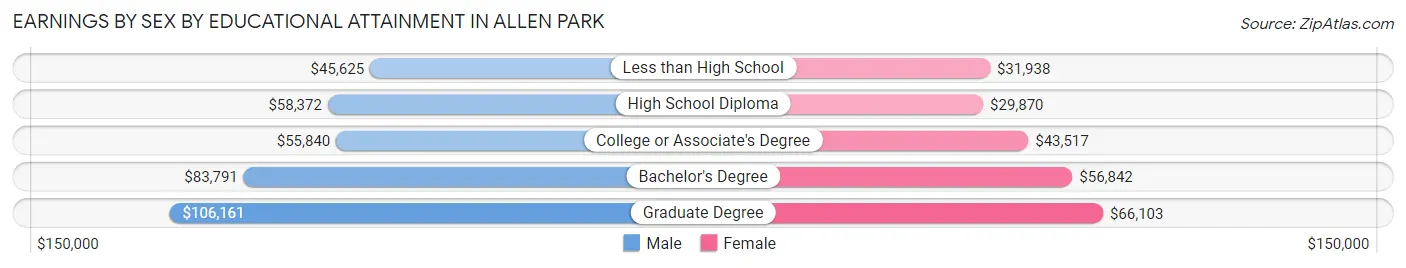
| Educational Attainment | Male Income | Female Income |
| Less than High School | $45,625 | $31,938 |
| High School Diploma | $58,372 | $29,870 |
| College or Associate's Degree | $55,840 | $43,517 |
| Bachelor's Degree | $83,791 | $56,842 |
| Graduate Degree | $106,161 | $66,103 |
| Total | $62,188 | $47,646 |
Family Income in Allen Park
Family Income Brackets in Allen Park
According to the Allen Park family income data, there are 2,055 families falling into the $100,000 to $149,999 income range, which is the most common income bracket and makes up 27.2% of all families. Conversely, the $10,000 to $14,999 income bracket is the least frequent group with only 159 families (2.1%) belonging to this category.
| Income Bracket | # Families | % Families |
| Less than $10,000 | 189 | 2.5% |
| $10,000 to $14,999 | 159 | 2.1% |
| $15,000 to $24,999 | 166 | 2.2% |
| $25,000 to $34,999 | 242 | 3.2% |
| $35,000 to $49,999 | 484 | 6.4% |
| $50,000 to $74,999 | 1,662 | 22.0% |
| $75,000 to $99,999 | 1,005 | 13.3% |
| $100,000 to $149,999 | 2,055 | 27.2% |
| $150,000 to $199,999 | 997 | 13.2% |
| $200,000+ | 597 | 7.9% |
Family Income by Famaliy Size in Allen Park
6-person families (100 | 1.3%) account for the highest median family income in Allen Park with $130,865 per family, while 2-person families (3,690 | 48.8%) have the highest median income of $40,040 per family member.
| Income Bracket | # Families | Median Income |
| 2-Person Families | 3,690 (48.8%) | $80,081 |
| 3-Person Families | 1,945 (25.7%) | $106,063 |
| 4-Person Families | 1,466 (19.4%) | $114,567 |
| 5-Person Families | 313 (4.1%) | $116,563 |
| 6-Person Families | 100 (1.3%) | $130,865 |
| 7+ Person Families | 42 (0.6%) | $0 |
| Total | 7,556 (100.0%) | $97,118 |
Family Income by Number of Earners in Allen Park
The median family income in Allen Park is $97,118, with families comprising 3+ earners (1,033) having the highest median family income of $160,917, while families with no earners (1,194) have the lowest median family income of $56,591, accounting for 13.7% and 15.8% of families, respectively.
| Number of Earners | # Families | Median Income |
| No Earners | 1,194 (15.8%) | $56,591 |
| 1 Earner | 2,464 (32.6%) | $70,908 |
| 2 Earners | 2,865 (37.9%) | $112,559 |
| 3+ Earners | 1,033 (13.7%) | $160,917 |
| Total | 7,556 (100.0%) | $97,118 |
Household Income in Allen Park
Household Income Brackets in Allen Park
With 2,560 households falling in the category, the $50,000 to $74,999 income range is the most frequent in Allen Park, accounting for 21.6% of all households. In contrast, only 284 households (2.4%) fall into the $10,000 to $14,999 income bracket, making it the least populous group.
| Income Bracket | # Households | % Households |
| Less than $10,000 | 486 | 4.1% |
| $10,000 to $14,999 | 284 | 2.4% |
| $15,000 to $24,999 | 688 | 5.8% |
| $25,000 to $34,999 | 889 | 7.5% |
| $35,000 to $49,999 | 1,138 | 9.6% |
| $50,000 to $74,999 | 2,560 | 21.6% |
| $75,000 to $99,999 | 1,660 | 14.0% |
| $100,000 to $149,999 | 2,395 | 20.2% |
| $150,000 to $199,999 | 984 | 8.3% |
| $200,000+ | 771 | 6.5% |
Household Income by Householder Age in Allen Park
The median household income in Allen Park is $73,792, with the highest median household income of $91,946 found in the 45 to 64 years age bracket for the primary householder. A total of 4,718 households (39.8%) fall into this category. Meanwhile, the 15 to 24 years age bracket for the primary householder has the lowest median household income of $33,728, with 144 households (1.2%) in this group.
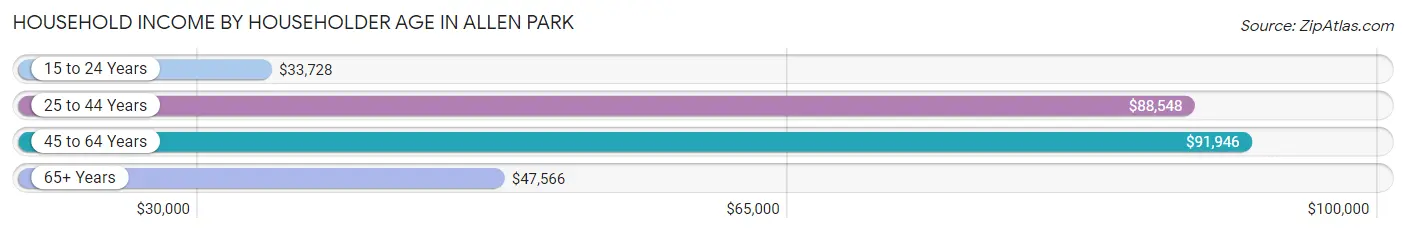
| Income Bracket | # Households | Median Income |
| 15 to 24 Years | 144 (1.2%) | $33,728 |
| 25 to 44 Years | 3,526 (29.7%) | $88,548 |
| 45 to 64 Years | 4,718 (39.8%) | $91,946 |
| 65+ Years | 3,466 (29.2%) | $47,566 |
| Total | 11,854 (100.0%) | $73,792 |
Poverty in Allen Park
Income Below Poverty by Sex and Age in Allen Park
With 5.8% poverty level for males and 9.2% for females among the residents of Allen Park, 5 year old males and 15 year old females are the most vulnerable to poverty, with 60 males (29.6%) and 103 females (39.6%) in their respective age groups living below the poverty level.
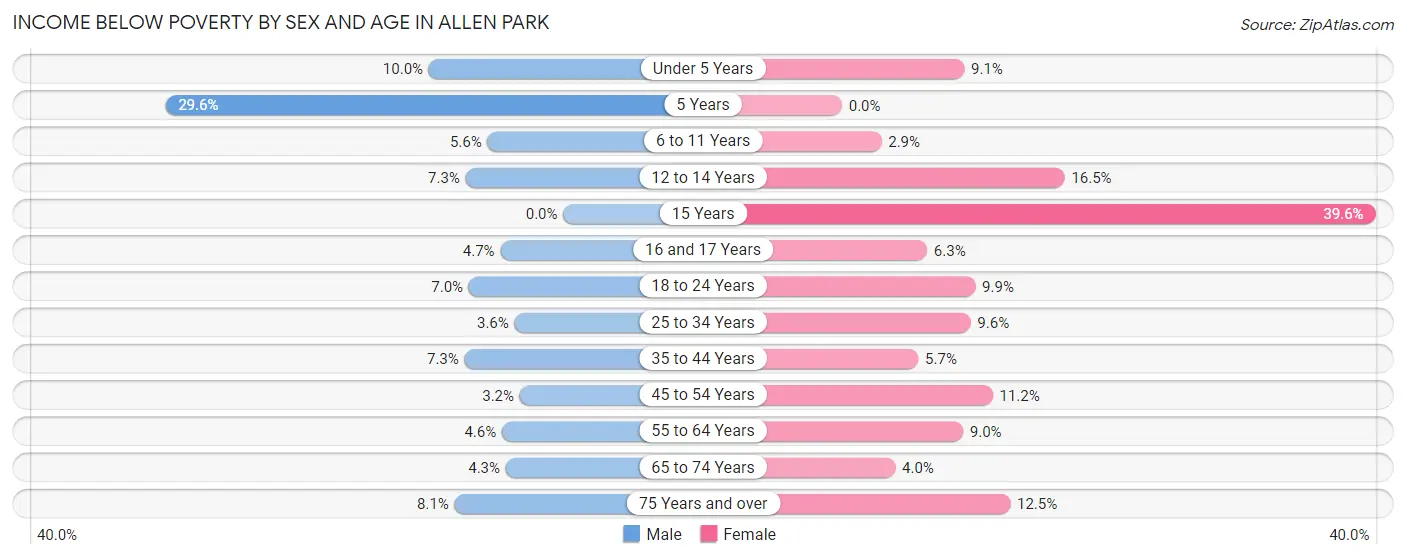
| Age Bracket | Male | Female |
| Under 5 Years | 64 (10.0%) | 63 (9.1%) |
| 5 Years | 60 (29.6%) | 0 (0.0%) |
| 6 to 11 Years | 37 (5.6%) | 25 (2.9%) |
| 12 to 14 Years | 44 (7.2%) | 103 (16.5%) |
| 15 Years | 0 (0.0%) | 103 (39.6%) |
| 16 and 17 Years | 15 (4.7%) | 24 (6.3%) |
| 18 to 24 Years | 74 (7.0%) | 98 (9.9%) |
| 25 to 34 Years | 62 (3.6%) | 198 (9.6%) |
| 35 to 44 Years | 133 (7.3%) | 93 (5.7%) |
| 45 to 54 Years | 64 (3.2%) | 241 (11.2%) |
| 55 to 64 Years | 99 (4.5%) | 194 (9.0%) |
| 65 to 74 Years | 52 (4.3%) | 61 (4.0%) |
| 75 Years and over | 64 (8.1%) | 168 (12.5%) |
| Total | 768 (5.8%) | 1,371 (9.2%) |
Income Above Poverty by Sex and Age in Allen Park
According to the poverty statistics in Allen Park, males aged 15 years and females aged 5 years are the age groups that are most secure financially, with 100.0% of males and 100.0% of females in these age groups living above the poverty line.
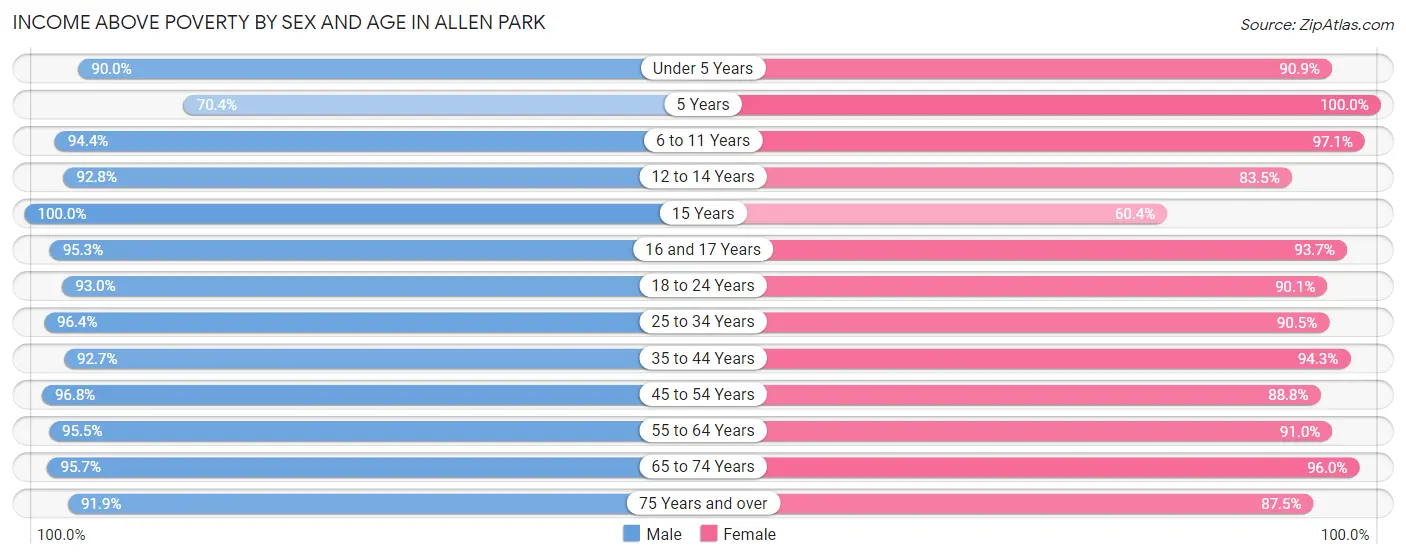
| Age Bracket | Male | Female |
| Under 5 Years | 577 (90.0%) | 631 (90.9%) |
| 5 Years | 143 (70.4%) | 184 (100.0%) |
| 6 to 11 Years | 620 (94.4%) | 829 (97.1%) |
| 12 to 14 Years | 563 (92.7%) | 520 (83.5%) |
| 15 Years | 175 (100.0%) | 157 (60.4%) |
| 16 and 17 Years | 306 (95.3%) | 356 (93.7%) |
| 18 to 24 Years | 981 (93.0%) | 892 (90.1%) |
| 25 to 34 Years | 1,649 (96.4%) | 1,876 (90.4%) |
| 35 to 44 Years | 1,681 (92.7%) | 1,546 (94.3%) |
| 45 to 54 Years | 1,919 (96.8%) | 1,912 (88.8%) |
| 55 to 64 Years | 2,075 (95.5%) | 1,964 (91.0%) |
| 65 to 74 Years | 1,165 (95.7%) | 1,479 (96.0%) |
| 75 Years and over | 729 (91.9%) | 1,177 (87.5%) |
| Total | 12,583 (94.3%) | 13,523 (90.8%) |
Income Below Poverty Among Married-Couple Families in Allen Park
The poverty statistics for married-couple families in Allen Park show that 2.5% or 140 of the total 5,544 families live below the poverty line. Families with 1 or 2 children have the highest poverty rate of 3.3%, comprising of 60 families. On the other hand, families with 3 or 4 children have the lowest poverty rate of 0.0%, which includes 0 families.
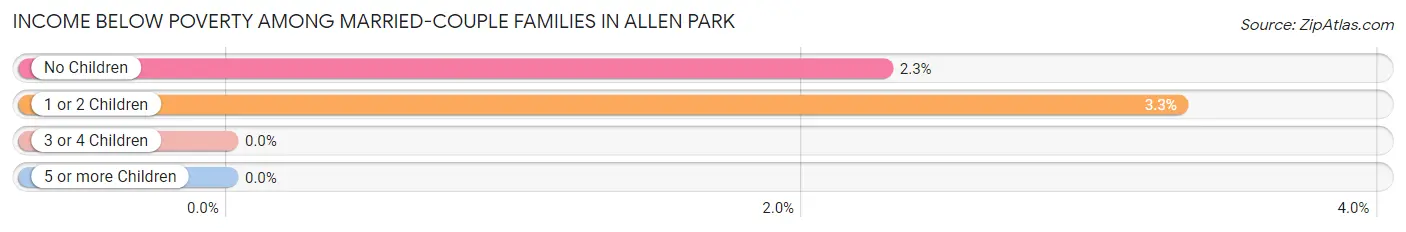
| Children | Above Poverty | Below Poverty |
| No Children | 3,424 (97.7%) | 80 (2.3%) |
| 1 or 2 Children | 1,755 (96.7%) | 60 (3.3%) |
| 3 or 4 Children | 198 (100.0%) | 0 (0.0%) |
| 5 or more Children | 27 (100.0%) | 0 (0.0%) |
| Total | 5,404 (97.5%) | 140 (2.5%) |
Income Below Poverty Among Single-Parent Households in Allen Park
According to the poverty data in Allen Park, 3.0% or 16 single-father households and 17.5% or 260 single-mother households are living below the poverty line. Among single-father households, those with 1 or 2 children have the highest poverty rate, with 16 households (4.9%) experiencing poverty. Likewise, among single-mother households, those with 1 or 2 children have the highest poverty rate, with 184 households (25.0%) falling below the poverty line.
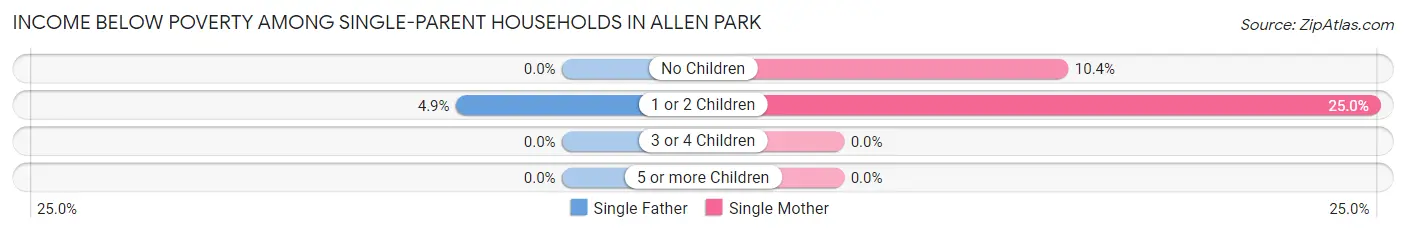
| Children | Single Father | Single Mother |
| No Children | 0 (0.0%) | 76 (10.4%) |
| 1 or 2 Children | 16 (4.9%) | 184 (25.0%) |
| 3 or 4 Children | 0 (0.0%) | 0 (0.0%) |
| 5 or more Children | 0 (0.0%) | 0 (0.0%) |
| Total | 16 (3.0%) | 260 (17.5%) |
Income Below Poverty Among Married-Couple vs Single-Parent Households in Allen Park
The poverty data for Allen Park shows that 140 of the married-couple family households (2.5%) and 276 of the single-parent households (13.7%) are living below the poverty level. Within the married-couple family households, those with 1 or 2 children have the highest poverty rate, with 60 households (3.3%) falling below the poverty line. Among the single-parent households, those with 1 or 2 children have the highest poverty rate, with 200 household (18.9%) living below poverty.
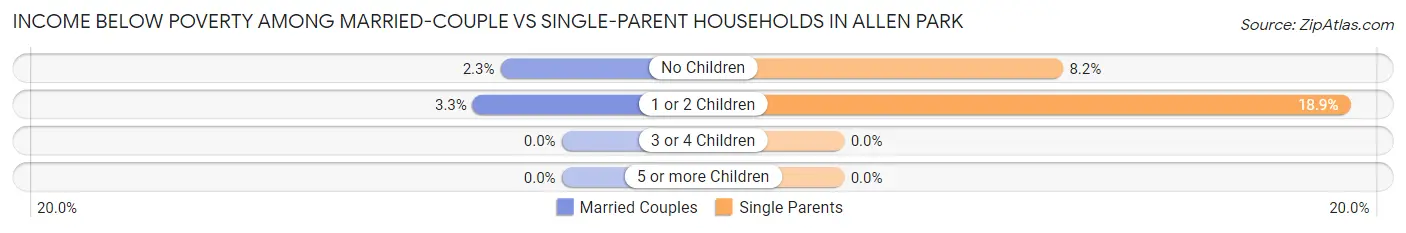
| Children | Married-Couple Families | Single-Parent Households |
| No Children | 80 (2.3%) | 76 (8.2%) |
| 1 or 2 Children | 60 (3.3%) | 200 (18.9%) |
| 3 or 4 Children | 0 (0.0%) | 0 (0.0%) |
| 5 or more Children | 0 (0.0%) | 0 (0.0%) |
| Total | 140 (2.5%) | 276 (13.7%) |
Race in Allen Park
The most populous races in Allen Park are White / Caucasian (23,764 | 83.7%), Hispanic or Latino (3,318 | 11.7%), and Two or more Races (2,117 | 7.5%).
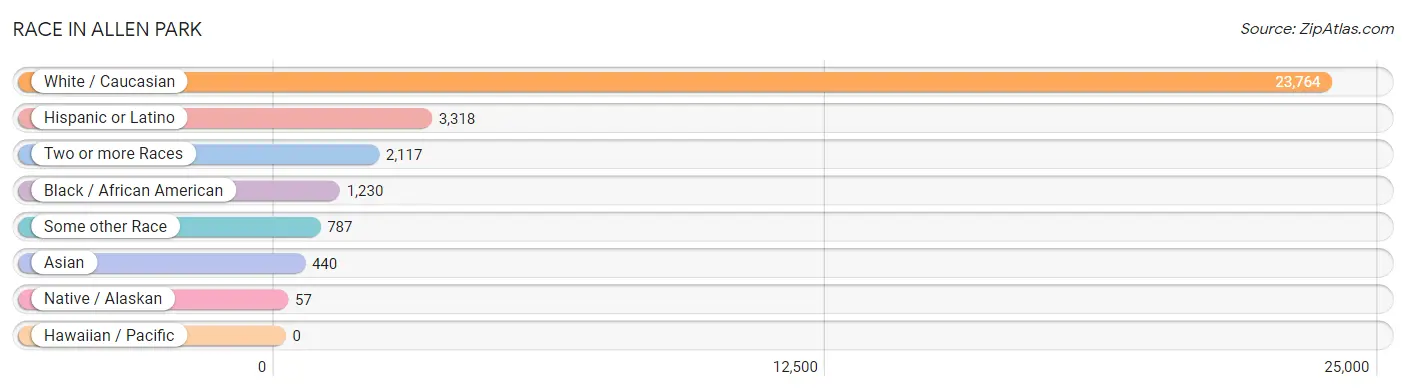
| Race | # Population | % Population |
| Asian | 440 | 1.5% |
| Black / African American | 1,230 | 4.3% |
| Hawaiian / Pacific | 0 | 0.0% |
| Hispanic or Latino | 3,318 | 11.7% |
| Native / Alaskan | 57 | 0.2% |
| White / Caucasian | 23,764 | 83.7% |
| Two or more Races | 2,117 | 7.5% |
| Some other Race | 787 | 2.8% |
| Total | 28,395 | 100.0% |
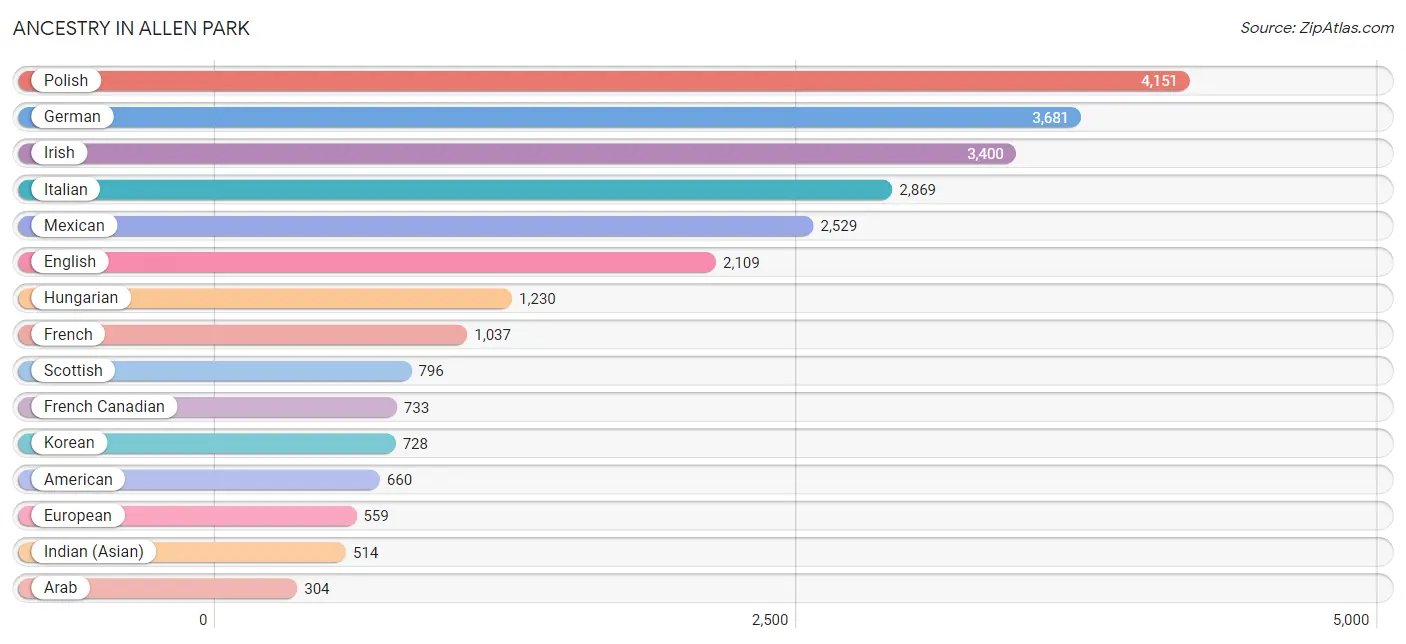
Ancestry in Allen Park
The most populous ancestries reported in Allen Park are Polish (4,151 | 14.6%), German (3,681 | 13.0%), Irish (3,400 | 12.0%), Italian (2,869 | 10.1%), and Mexican (2,529 | 8.9%), together accounting for 58.6% of all Allen Park residents.
| Ancestry | # Population | % Population |
| African | 25 | 0.1% |
| Albanian | 16 | 0.1% |
| American | 660 | 2.3% |
| Apache | 6 | 0.0% |
| Arab | 304 | 1.1% |
| Armenian | 40 | 0.1% |
| Austrian | 246 | 0.9% |
| Bangladeshi | 9 | 0.0% |
| Belgian | 109 | 0.4% |
| Bhutanese | 89 | 0.3% |
| Blackfeet | 9 | 0.0% |
| British | 92 | 0.3% |
| Burmese | 12 | 0.0% |
| Cajun | 7 | 0.0% |
| Canadian | 157 | 0.5% |
| Central American | 140 | 0.5% |
| Cherokee | 96 | 0.3% |
| Chippewa | 54 | 0.2% |
| Choctaw | 3 | 0.0% |
| Cree | 5 | 0.0% |
| Creek | 5 | 0.0% |
| Croatian | 99 | 0.4% |
| Cuban | 30 | 0.1% |
| Czech | 112 | 0.4% |
| Czechoslovakian | 87 | 0.3% |
| Danish | 51 | 0.2% |
| Dominican | 24 | 0.1% |
| Dutch | 273 | 1.0% |
| Eastern European | 43 | 0.2% |
| Egyptian | 12 | 0.0% |
| English | 2,109 | 7.4% |
| Ethiopian | 6 | 0.0% |
| European | 559 | 2.0% |
| Filipino | 9 | 0.0% |
| Finnish | 67 | 0.2% |
| French | 1,037 | 3.6% |
| French Canadian | 733 | 2.6% |
| German | 3,681 | 13.0% |
| Greek | 275 | 1.0% |
| Guatemalan | 5 | 0.0% |
| Hungarian | 1,230 | 4.3% |
| Indian (Asian) | 514 | 1.8% |
| Iraqi | 11 | 0.0% |
| Irish | 3,400 | 12.0% |
| Iroquois | 9 | 0.0% |
| Italian | 2,869 | 10.1% |
| Korean | 728 | 2.6% |
| Latvian | 27 | 0.1% |
| Lebanese | 178 | 0.6% |
| Lithuanian | 33 | 0.1% |
| Lumbee | 5 | 0.0% |
| Luxembourger | 28 | 0.1% |
| Macedonian | 43 | 0.2% |
| Maltese | 132 | 0.5% |
| Mexican | 2,529 | 8.9% |
| Mexican American Indian | 59 | 0.2% |
| Nicaraguan | 18 | 0.1% |
| Nigerian | 32 | 0.1% |
| Norwegian | 110 | 0.4% |
| Palestinian | 91 | 0.3% |
| Panamanian | 42 | 0.2% |
| Pennsylvania German | 14 | 0.1% |
| Peruvian | 64 | 0.2% |
| Polish | 4,151 | 14.6% |
| Potawatomi | 7 | 0.0% |
| Puerto Rican | 83 | 0.3% |
| Romanian | 234 | 0.8% |
| Russian | 124 | 0.4% |
| Salvadoran | 75 | 0.3% |
| Scandinavian | 25 | 0.1% |
| Scotch-Irish | 248 | 0.9% |
| Scottish | 796 | 2.8% |
| Serbian | 80 | 0.3% |
| Slavic | 44 | 0.2% |
| Slovak | 120 | 0.4% |
| Slovene | 9 | 0.0% |
| South American | 93 | 0.3% |
| Spaniard | 34 | 0.1% |
| Spanish | 224 | 0.8% |
| Sri Lankan | 10 | 0.0% |
| Subsaharan African | 63 | 0.2% |
| Swedish | 184 | 0.6% |
| Swiss | 9 | 0.0% |
| Syrian | 1 | 0.0% |
| Thai | 32 | 0.1% |
| Ukrainian | 154 | 0.5% |
| Venezuelan | 29 | 0.1% |
| Welsh | 125 | 0.4% |
| Yaqui | 6 | 0.0% |
| Yugoslavian | 13 | 0.1% | View All 90 Rows |
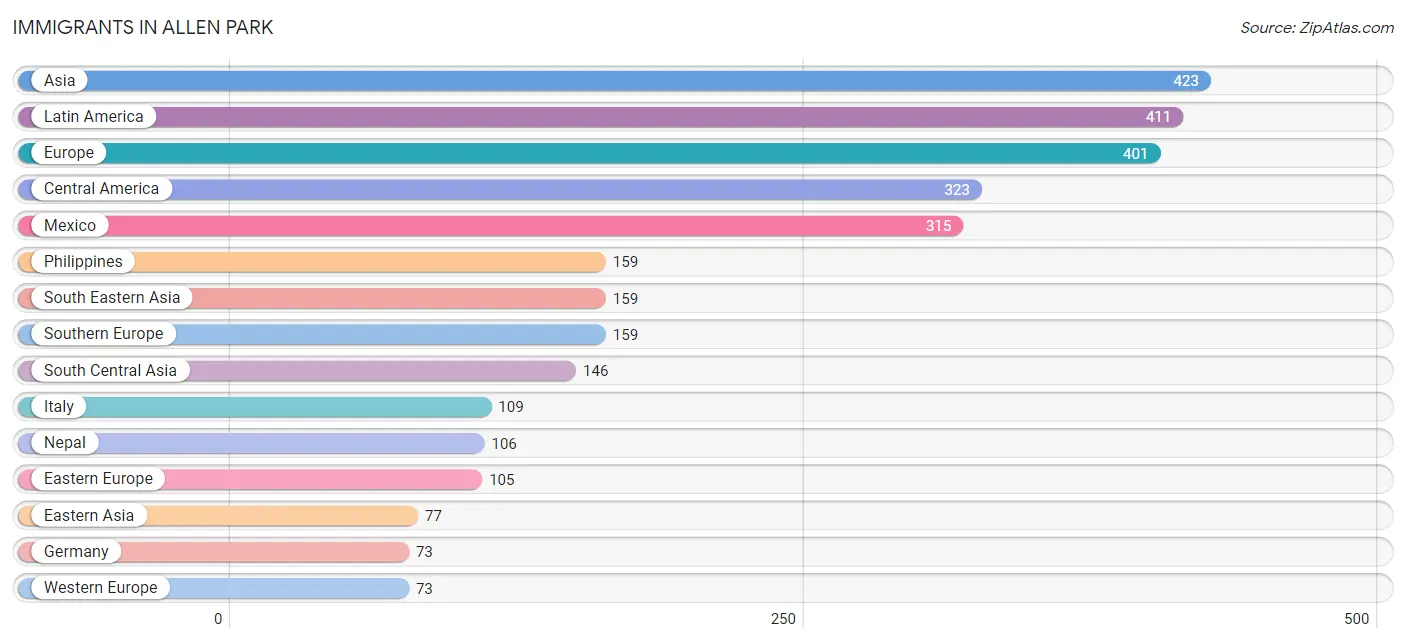
Immigrants in Allen Park
The most numerous immigrant groups reported in Allen Park came from Asia (423 | 1.5%), Latin America (411 | 1.5%), Europe (401 | 1.4%), Central America (323 | 1.1%), and Mexico (315 | 1.1%), together accounting for 6.6% of all Allen Park residents.
| Immigration Origin | # Population | % Population |
| Africa | 22 | 0.1% |
| Asia | 423 | 1.5% |
| Brazil | 8 | 0.0% |
| Canada | 47 | 0.2% |
| Caribbean | 20 | 0.1% |
| Central America | 323 | 1.1% |
| China | 48 | 0.2% |
| Cuba | 20 | 0.1% |
| Czechoslovakia | 17 | 0.1% |
| Eastern Africa | 10 | 0.0% |
| Eastern Asia | 77 | 0.3% |
| Eastern Europe | 105 | 0.4% |
| Egypt | 12 | 0.0% |
| England | 21 | 0.1% |
| Europe | 401 | 1.4% |
| Germany | 73 | 0.3% |
| Greece | 38 | 0.1% |
| Hungary | 15 | 0.1% |
| India | 29 | 0.1% |
| Ireland | 33 | 0.1% |
| Israel | 16 | 0.1% |
| Italy | 109 | 0.4% |
| Japan | 9 | 0.0% |
| Korea | 20 | 0.1% |
| Latin America | 411 | 1.5% |
| Lebanon | 24 | 0.1% |
| Mexico | 315 | 1.1% |
| Nepal | 106 | 0.4% |
| Nicaragua | 8 | 0.0% |
| Northern Africa | 12 | 0.0% |
| Northern Europe | 64 | 0.2% |
| Pakistan | 11 | 0.0% |
| Peru | 31 | 0.1% |
| Philippines | 159 | 0.6% |
| Romania | 43 | 0.2% |
| Russia | 30 | 0.1% |
| Scotland | 4 | 0.0% |
| South America | 68 | 0.2% |
| South Central Asia | 146 | 0.5% |
| South Eastern Asia | 159 | 0.6% |
| Southern Europe | 159 | 0.6% |
| Syria | 1 | 0.0% |
| Taiwan | 8 | 0.0% |
| Uganda | 10 | 0.0% |
| Venezuela | 29 | 0.1% |
| Western Asia | 41 | 0.1% |
| Western Europe | 73 | 0.3% | View All 47 Rows |
Sex and Age in Allen Park
Sex and Age in Allen Park
The most populous age groups in Allen Park are 60 to 64 Years (1,102 | 8.2%) for men and 55 to 59 Years (1,233 | 8.2%) for women.
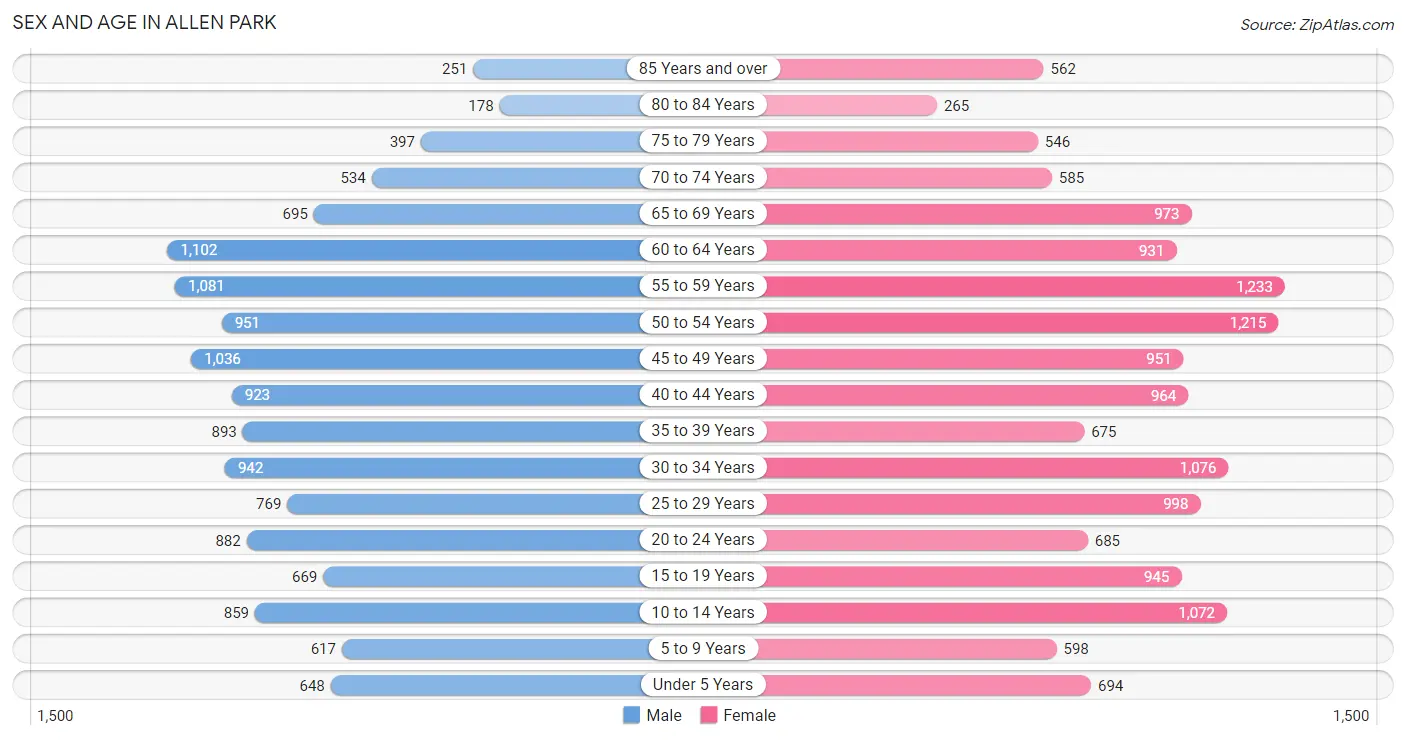
| Age Bracket | Male | Female |
| Under 5 Years | 648 (4.8%) | 694 (4.6%) |
| 5 to 9 Years | 617 (4.6%) | 598 (4.0%) |
| 10 to 14 Years | 859 (6.4%) | 1,072 (7.2%) |
| 15 to 19 Years | 669 (5.0%) | 945 (6.3%) |
| 20 to 24 Years | 882 (6.6%) | 685 (4.6%) |
| 25 to 29 Years | 769 (5.7%) | 998 (6.7%) |
| 30 to 34 Years | 942 (7.0%) | 1,076 (7.2%) |
| 35 to 39 Years | 893 (6.7%) | 675 (4.5%) |
| 40 to 44 Years | 923 (6.9%) | 964 (6.4%) |
| 45 to 49 Years | 1,036 (7.7%) | 951 (6.4%) |
| 50 to 54 Years | 951 (7.1%) | 1,215 (8.1%) |
| 55 to 59 Years | 1,081 (8.1%) | 1,233 (8.2%) |
| 60 to 64 Years | 1,102 (8.2%) | 931 (6.2%) |
| 65 to 69 Years | 695 (5.2%) | 973 (6.5%) |
| 70 to 74 Years | 534 (4.0%) | 585 (3.9%) |
| 75 to 79 Years | 397 (3.0%) | 546 (3.6%) |
| 80 to 84 Years | 178 (1.3%) | 265 (1.8%) |
| 85 Years and over | 251 (1.9%) | 562 (3.7%) |
| Total | 13,427 (100.0%) | 14,968 (100.0%) |
Families and Households in Allen Park
Median Family Size in Allen Park
The median family size in Allen Park is 3.01 persons per family, with married-couple families (5,544 | 73.4%) accounting for the largest median family size of 3.02 persons per family. On the other hand, single male/father families (529 | 7.0%) represent the smallest median family size with 2.84 persons per family.
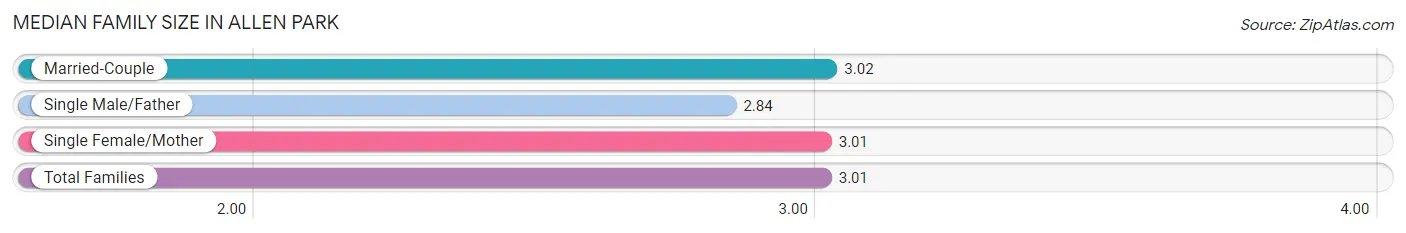
| Family Type | # Families | Family Size |
| Married-Couple | 5,544 (73.4%) | 3.02 |
| Single Male/Father | 529 (7.0%) | 2.84 |
| Single Female/Mother | 1,483 (19.6%) | 3.01 |
| Total Families | 7,556 (100.0%) | 3.01 |
Median Household Size in Allen Park
The median household size in Allen Park is 2.38 persons per household, with single female/mother households (1,483 | 12.5%) accounting for the largest median household size of 3.2 persons per household. non-family households (4,298 | 36.3%) represent the smallest median household size with 1.17 persons per household.
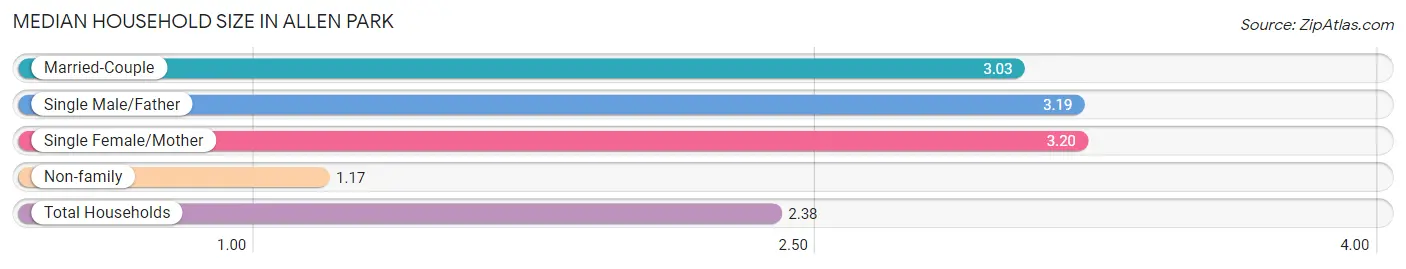
| Household Type | # Households | Household Size |
| Married-Couple | 5,544 (46.8%) | 3.03 |
| Single Male/Father | 529 (4.5%) | 3.19 |
| Single Female/Mother | 1,483 (12.5%) | 3.20 |
| Non-family | 4,298 (36.3%) | 1.17 |
| Total Households | 11,854 (100.0%) | 2.38 |
Household Size by Marriage Status in Allen Park
Out of a total of 11,854 households in Allen Park, 7,556 (63.7%) are family households, while 4,298 (36.3%) are nonfamily households. The most numerous type of family households are 2-person households, comprising 3,571, and the most common type of nonfamily households are 1-person households, comprising 3,783.
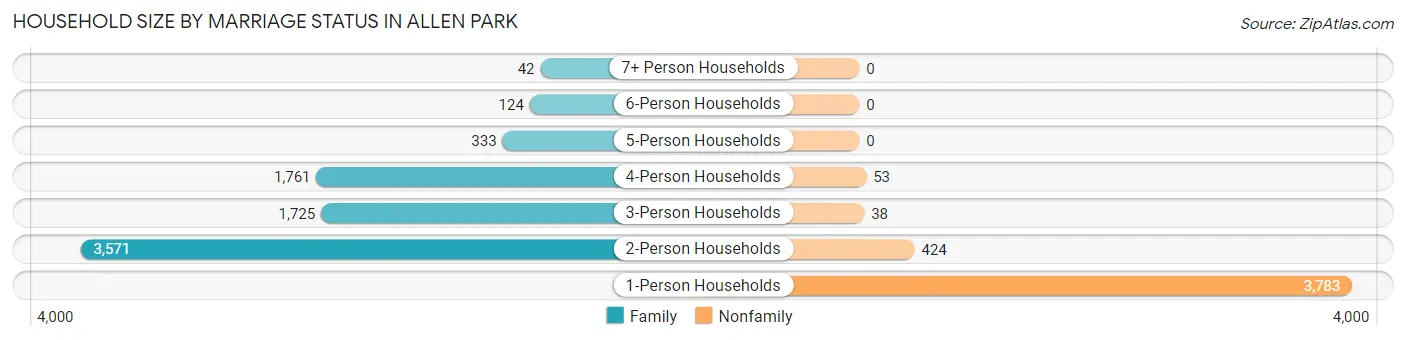
| Household Size | Family Households | Nonfamily Households |
| 1-Person Households | - | 3,783 (31.9%) |
| 2-Person Households | 3,571 (30.1%) | 424 (3.6%) |
| 3-Person Households | 1,725 (14.5%) | 38 (0.3%) |
| 4-Person Households | 1,761 (14.9%) | 53 (0.4%) |
| 5-Person Households | 333 (2.8%) | 0 (0.0%) |
| 6-Person Households | 124 (1.1%) | 0 (0.0%) |
| 7+ Person Households | 42 (0.4%) | 0 (0.0%) |
| Total | 7,556 (63.7%) | 4,298 (36.3%) |
Female Fertility in Allen Park
Fertility by Age in Allen Park
Average fertility rate in Allen Park is 59.0 births per 1,000 women. Women in the age bracket of 20 to 34 years have the highest fertility rate with 107.0 births per 1,000 women. Women in the age bracket of 20 to 34 years acount for 76.2% of all women with births.
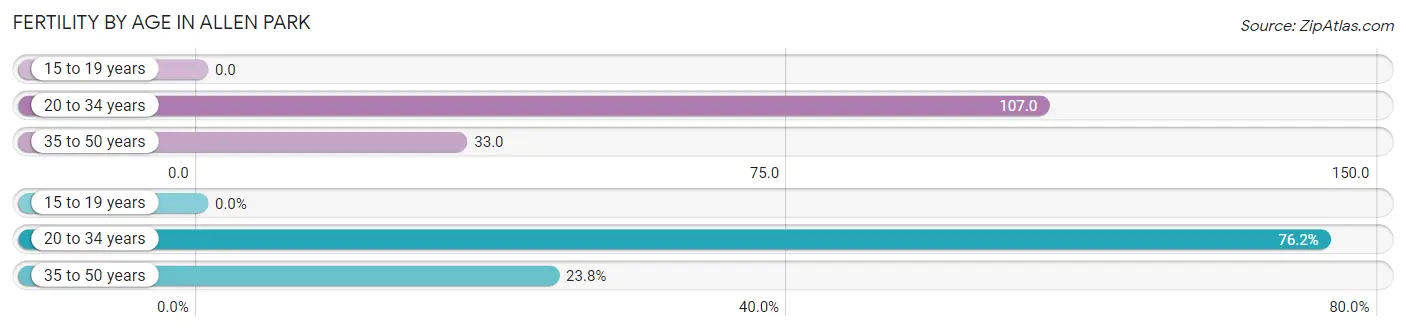
| Age Bracket | Women with Births | Births / 1,000 Women |
| 15 to 19 years | 0 (0.0%) | 0.0 |
| 20 to 34 years | 294 (76.2%) | 107.0 |
| 35 to 50 years | 92 (23.8%) | 33.0 |
| Total | 386 (100.0%) | 59.0 |
Fertility by Age by Marriage Status in Allen Park
69.7% of women with births (386) in Allen Park are married. The highest percentage of unmarried women with births falls into 35 to 50 years age bracket with 38.0% of them unmarried at the time of birth, while the lowest percentage of unmarried women with births belong to 20 to 34 years age bracket with 27.9% of them unmarried.
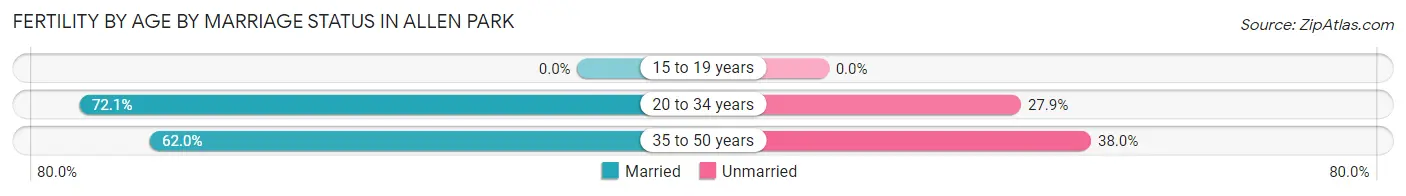
| Age Bracket | Married | Unmarried |
| 15 to 19 years | 0 (0.0%) | 0 (0.0%) |
| 20 to 34 years | 212 (72.1%) | 82 (27.9%) |
| 35 to 50 years | 57 (62.0%) | 35 (38.0%) |
| Total | 269 (69.7%) | 117 (30.3%) |
Fertility by Education in Allen Park
Average fertility rate in Allen Park is 59.0 births per 1,000 women. Women with the education attainment of graduate degree have the highest fertility rate of 123.0 births per 1,000 women, while women with the education attainment of high school diploma have the lowest fertility at 17.0 births per 1,000 women. Women with the education attainment of college or associate's degree represent 39.1% of all women with births.
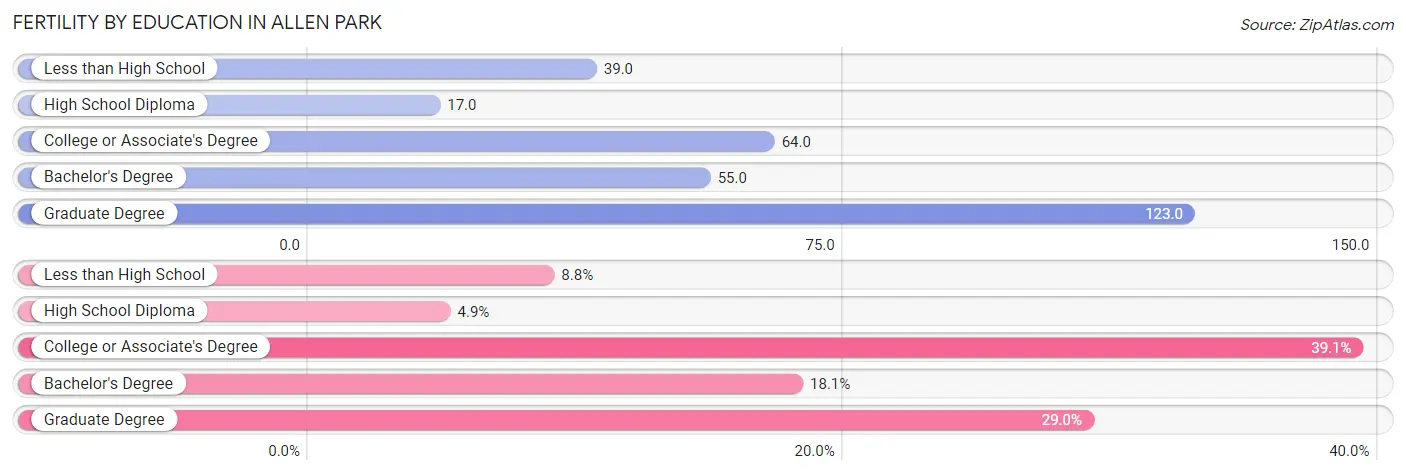
| Educational Attainment | Women with Births | Births / 1,000 Women |
| Less than High School | 34 (8.8%) | 39.0 |
| High School Diploma | 19 (4.9%) | 17.0 |
| College or Associate's Degree | 151 (39.1%) | 64.0 |
| Bachelor's Degree | 70 (18.1%) | 55.0 |
| Graduate Degree | 112 (29.0%) | 123.0 |
| Total | 386 (100.0%) | 59.0 |
Fertility by Education by Marriage Status in Allen Park
30.3% of women with births in Allen Park are unmarried. Women with the educational attainment of less than high school are most likely to be married with 100.0% of them married at childbirth, while women with the educational attainment of high school diploma are least likely to be married with 52.6% of them unmarried at childbirth.
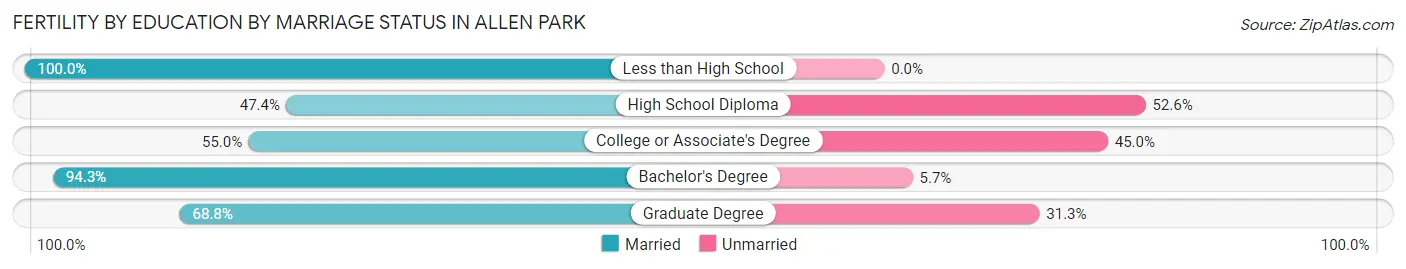
| Educational Attainment | Married | Unmarried |
| Less than High School | 34 (100.0%) | 0 (0.0%) |
| High School Diploma | 9 (47.4%) | 10 (52.6%) |
| College or Associate's Degree | 83 (55.0%) | 68 (45.0%) |
| Bachelor's Degree | 66 (94.3%) | 4 (5.7%) |
| Graduate Degree | 77 (68.8%) | 35 (31.2%) |
| Total | 269 (69.7%) | 117 (30.3%) |
Employment Characteristics in Allen Park
Employment by Class of Employer in Allen Park
Among the 13,688 employed individuals in Allen Park, private company employees (10,009 | 73.1%), not-for-profit organizations (1,583 | 11.6%), and local government employees (844 | 6.2%) make up the most common classes of employment.
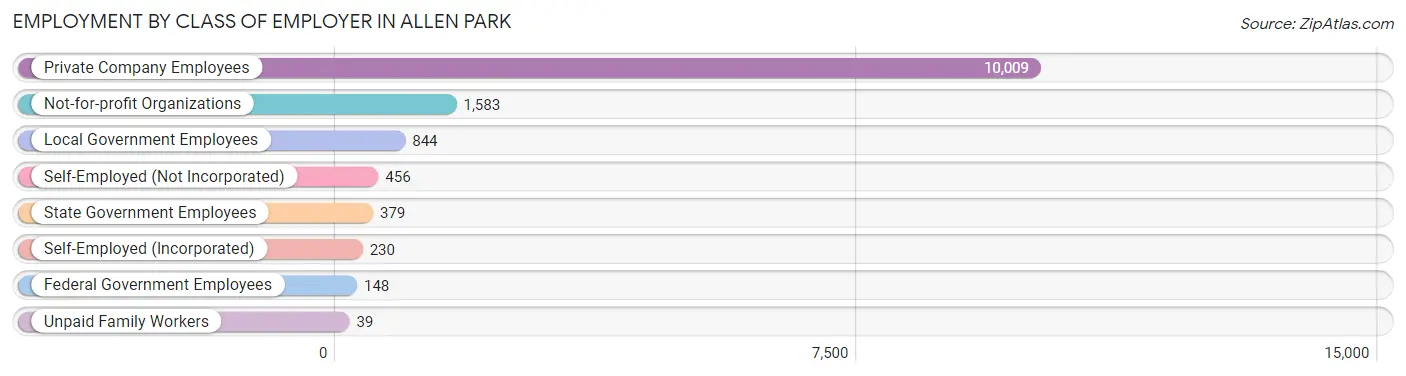
| Employer Class | # Employees | % Employees |
| Private Company Employees | 10,009 | 73.1% |
| Self-Employed (Incorporated) | 230 | 1.7% |
| Self-Employed (Not Incorporated) | 456 | 3.3% |
| Not-for-profit Organizations | 1,583 | 11.6% |
| Local Government Employees | 844 | 6.2% |
| State Government Employees | 379 | 2.8% |
| Federal Government Employees | 148 | 1.1% |
| Unpaid Family Workers | 39 | 0.3% |
| Total | 13,688 | 100.0% |
Employment Status by Age in Allen Park
According to the labor force statistics for Allen Park, out of the total population over 16 years of age (23,472), 63.3% or 14,858 individuals are in the labor force, with 6.0% or 891 of them unemployed. The age group with the highest labor force participation rate is 35 to 44 years, with 92.1% or 3,182 individuals in the labor force. Within the labor force, the 20 to 24 years age range has the highest percentage of unemployed individuals, with 14.8% or 165 of them being unemployed.
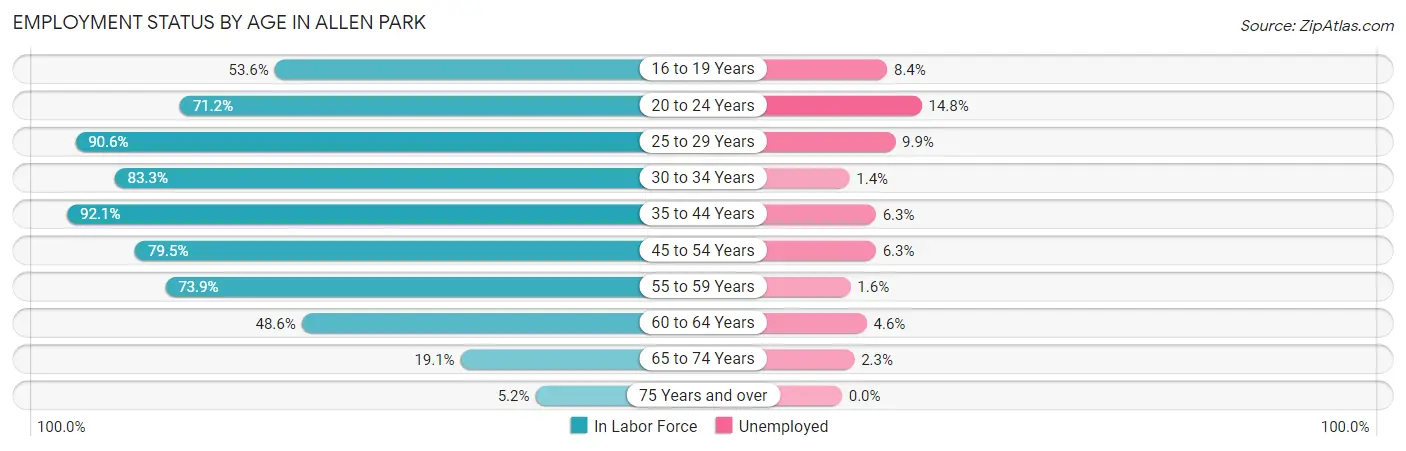
| Age Bracket | In Labor Force | Unemployed |
| 16 to 19 Years | 632 (53.6%) | 53 (8.4%) |
| 20 to 24 Years | 1,116 (71.2%) | 165 (14.8%) |
| 25 to 29 Years | 1,601 (90.6%) | 158 (9.9%) |
| 30 to 34 Years | 1,681 (83.3%) | 24 (1.4%) |
| 35 to 44 Years | 3,182 (92.1%) | 200 (6.3%) |
| 45 to 54 Years | 3,302 (79.5%) | 208 (6.3%) |
| 55 to 59 Years | 1,710 (73.9%) | 27 (1.6%) |
| 60 to 64 Years | 988 (48.6%) | 45 (4.6%) |
| 65 to 74 Years | 532 (19.1%) | 12 (2.3%) |
| 75 Years and over | 114 (5.2%) | 0 (0.0%) |
| Total | 14,858 (63.3%) | 891 (6.0%) |
Employment Status by Educational Attainment in Allen Park
According to labor force statistics for Allen Park, 79.2% of individuals (12,466) out of the total population between 25 and 64 years of age (15,740) are in the labor force, with 5.3% or 661 of them being unemployed. The group with the highest labor force participation rate are those with the educational attainment of bachelor's degree or higher, with 88.6% or 4,317 individuals in the labor force. Within the labor force, individuals with less than high school education have the highest percentage of unemployment, with 13.0% or 68 of them being unemployed.
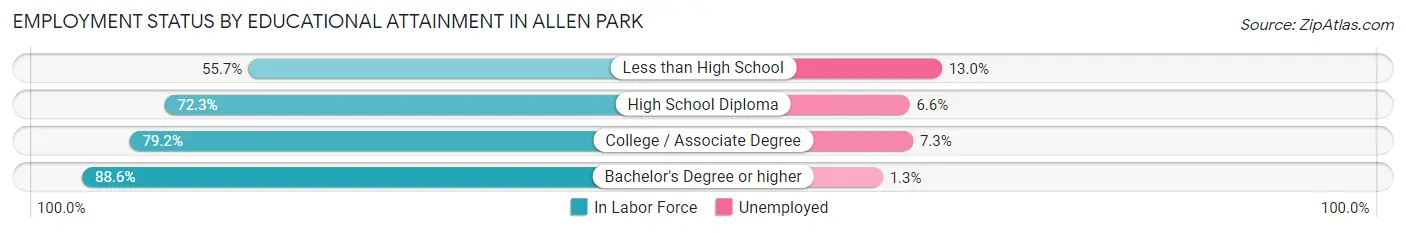
| Educational Attainment | In Labor Force | Unemployed |
| Less than High School | 524 (55.7%) | 122 (13.0%) |
| High School Diploma | 2,554 (72.3%) | 233 (6.6%) |
| College / Associate Degree | 5,065 (79.2%) | 467 (7.3%) |
| Bachelor's Degree or higher | 4,317 (88.6%) | 63 (1.3%) |
| Total | 12,466 (79.2%) | 834 (5.3%) |
Employment Occupations by Sex in Allen Park
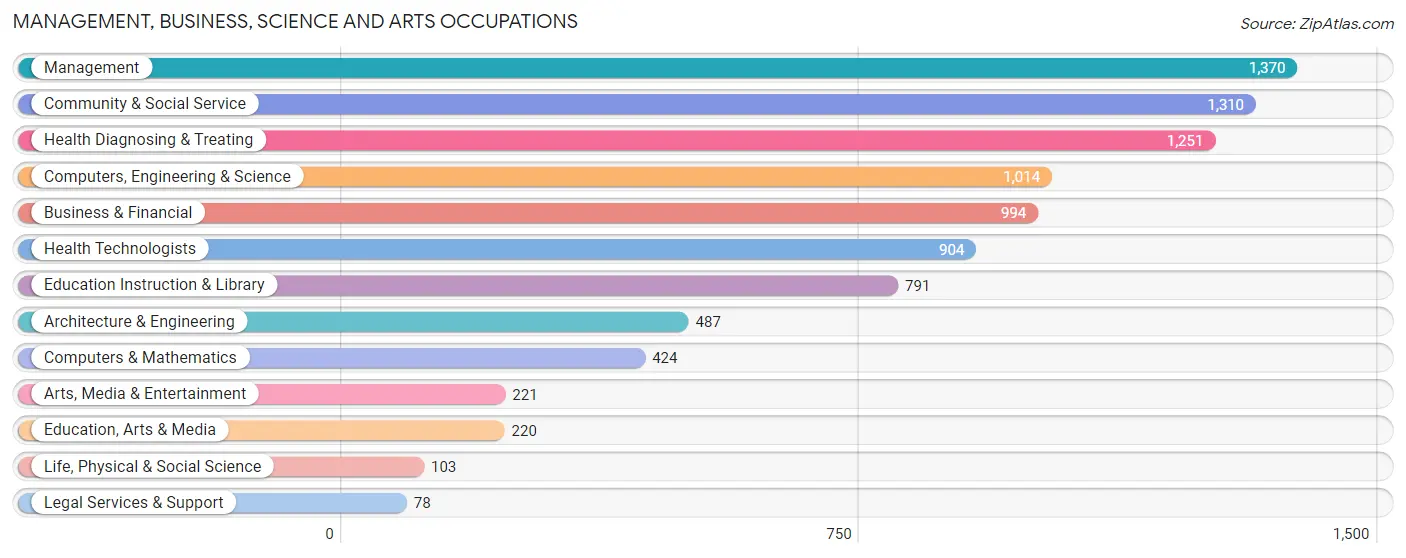
Management, Business, Science and Arts Occupations
The most common Management, Business, Science and Arts occupations in Allen Park are Management (1,370 | 9.8%), Community & Social Service (1,310 | 9.4%), Health Diagnosing & Treating (1,251 | 9.0%), Computers, Engineering & Science (1,014 | 7.3%), and Business & Financial (994 | 7.1%).
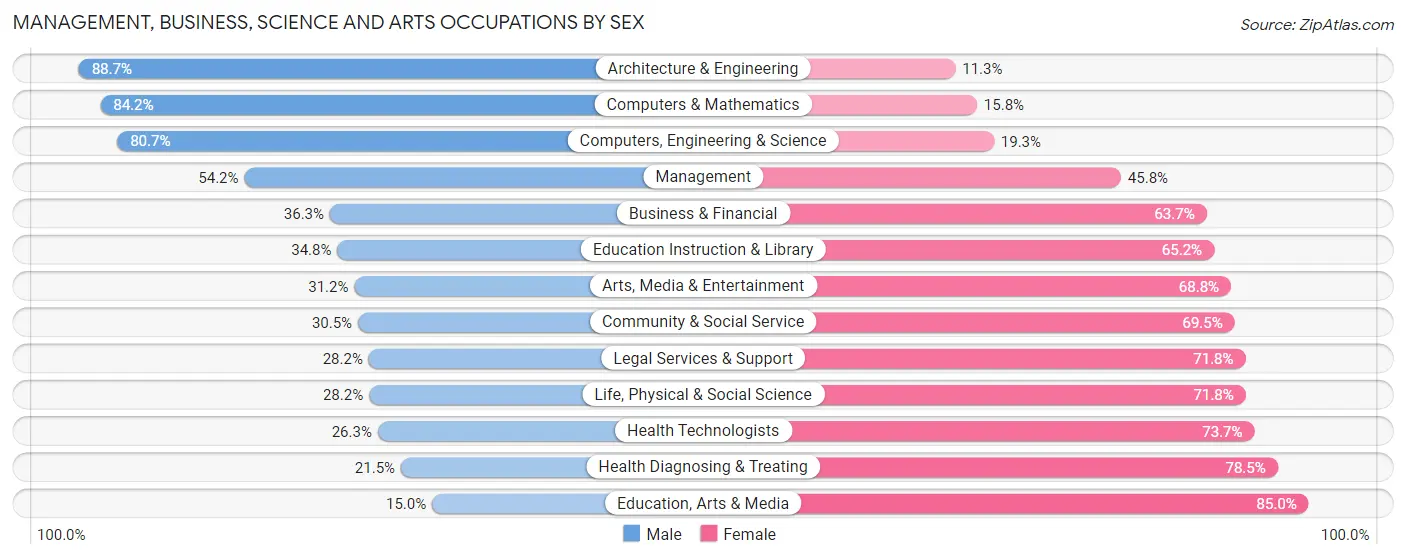
Management, Business, Science and Arts Occupations by Sex
Within the Management, Business, Science and Arts occupations in Allen Park, the most male-oriented occupations are Architecture & Engineering (88.7%), Computers & Mathematics (84.2%), and Computers, Engineering & Science (80.7%), while the most female-oriented occupations are Education, Arts & Media (85.0%), Health Diagnosing & Treating (78.5%), and Health Technologists (73.7%).
| Occupation | Male | Female |
| Management | 742 (54.2%) | 628 (45.8%) |
| Business & Financial | 361 (36.3%) | 633 (63.7%) |
| Computers, Engineering & Science | 818 (80.7%) | 196 (19.3%) |
| Computers & Mathematics | 357 (84.2%) | 67 (15.8%) |
| Architecture & Engineering | 432 (88.7%) | 55 (11.3%) |
| Life, Physical & Social Science | 29 (28.2%) | 74 (71.8%) |
| Community & Social Service | 399 (30.5%) | 911 (69.5%) |
| Education, Arts & Media | 33 (15.0%) | 187 (85.0%) |
| Legal Services & Support | 22 (28.2%) | 56 (71.8%) |
| Education Instruction & Library | 275 (34.8%) | 516 (65.2%) |
| Arts, Media & Entertainment | 69 (31.2%) | 152 (68.8%) |
| Health Diagnosing & Treating | 269 (21.5%) | 982 (78.5%) |
| Health Technologists | 238 (26.3%) | 666 (73.7%) |
| Total (Category) | 2,589 (43.6%) | 3,350 (56.4%) |
| Total (Overall) | 7,341 (52.6%) | 6,625 (47.4%) |
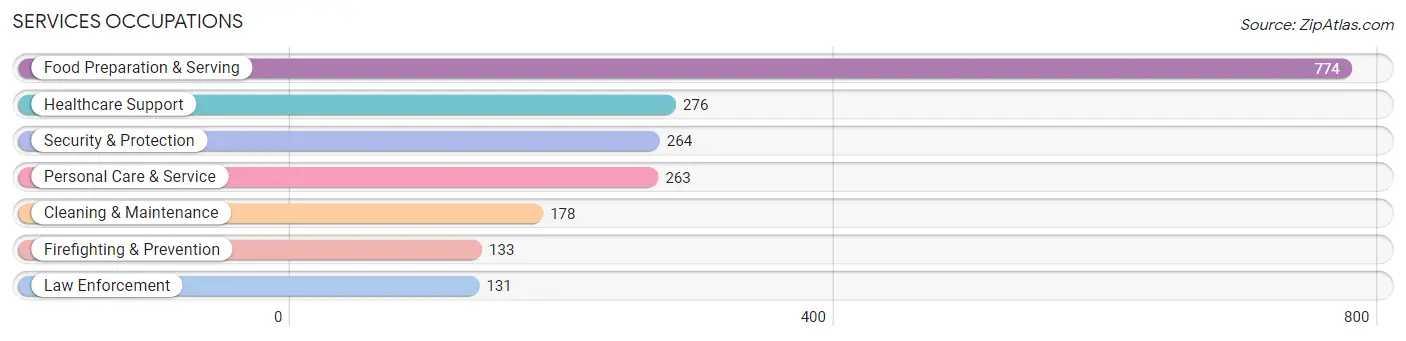
Services Occupations
The most common Services occupations in Allen Park are Food Preparation & Serving (774 | 5.5%), Healthcare Support (276 | 2.0%), Security & Protection (264 | 1.9%), Personal Care & Service (263 | 1.9%), and Cleaning & Maintenance (178 | 1.3%).
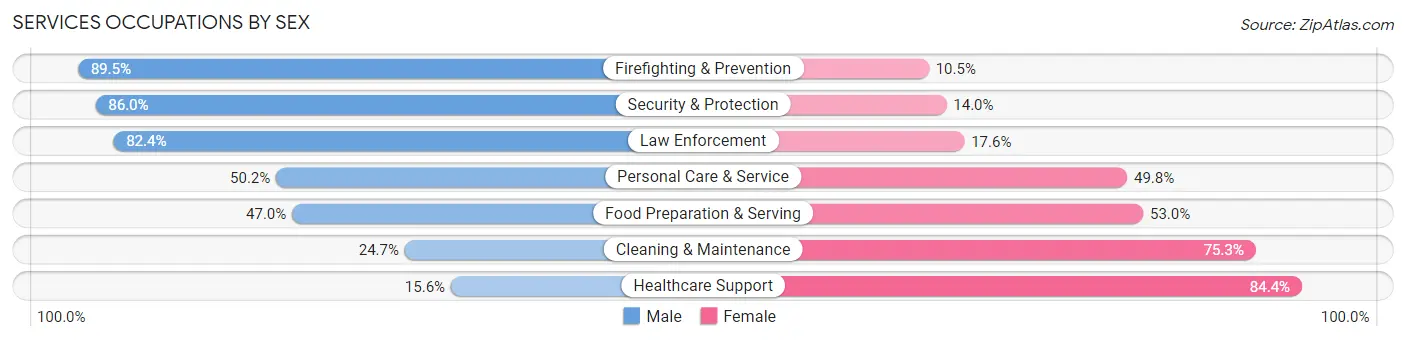
Services Occupations by Sex
Within the Services occupations in Allen Park, the most male-oriented occupations are Firefighting & Prevention (89.5%), Security & Protection (86.0%), and Law Enforcement (82.4%), while the most female-oriented occupations are Healthcare Support (84.4%), Cleaning & Maintenance (75.3%), and Food Preparation & Serving (53.0%).
| Occupation | Male | Female |
| Healthcare Support | 43 (15.6%) | 233 (84.4%) |
| Security & Protection | 227 (86.0%) | 37 (14.0%) |
| Firefighting & Prevention | 119 (89.5%) | 14 (10.5%) |
| Law Enforcement | 108 (82.4%) | 23 (17.6%) |
| Food Preparation & Serving | 364 (47.0%) | 410 (53.0%) |
| Cleaning & Maintenance | 44 (24.7%) | 134 (75.3%) |
| Personal Care & Service | 132 (50.2%) | 131 (49.8%) |
| Total (Category) | 810 (46.2%) | 945 (53.8%) |
| Total (Overall) | 7,341 (52.6%) | 6,625 (47.4%) |
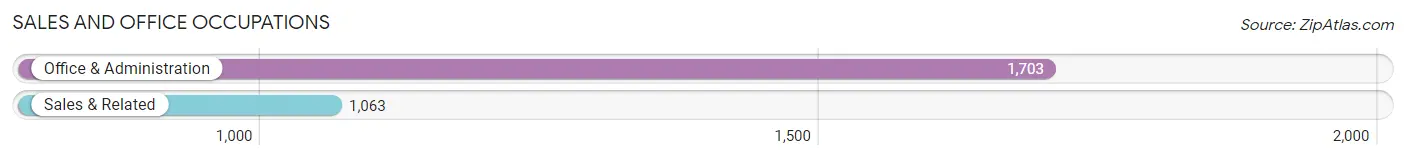
Sales and Office Occupations
The most common Sales and Office occupations in Allen Park are Office & Administration (1,703 | 12.2%), and Sales & Related (1,063 | 7.6%).
Sales and Office Occupations by Sex
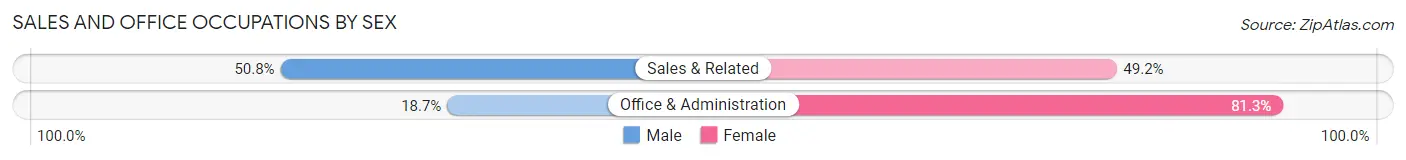
| Occupation | Male | Female |
| Sales & Related | 540 (50.8%) | 523 (49.2%) |
| Office & Administration | 319 (18.7%) | 1,384 (81.3%) |
| Total (Category) | 859 (31.1%) | 1,907 (68.9%) |
| Total (Overall) | 7,341 (52.6%) | 6,625 (47.4%) |
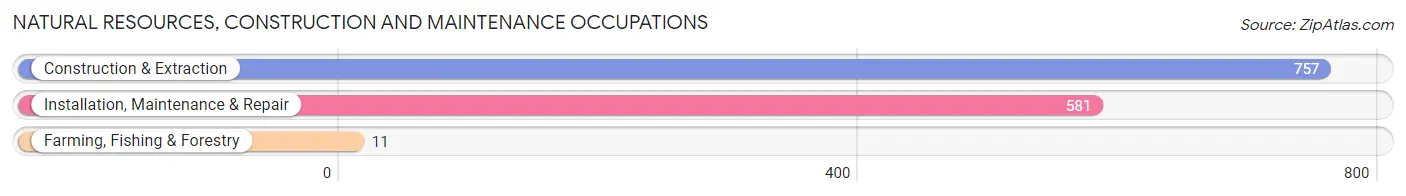
Natural Resources, Construction and Maintenance Occupations
The most common Natural Resources, Construction and Maintenance occupations in Allen Park are Construction & Extraction (757 | 5.4%), Installation, Maintenance & Repair (581 | 4.2%), and Farming, Fishing & Forestry (11 | 0.1%).
Natural Resources, Construction and Maintenance Occupations by Sex
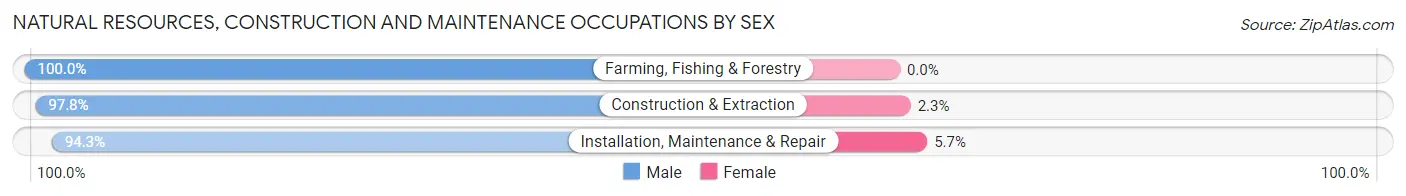
| Occupation | Male | Female |
| Farming, Fishing & Forestry | 11 (100.0%) | 0 (0.0%) |
| Construction & Extraction | 740 (97.8%) | 17 (2.2%) |
| Installation, Maintenance & Repair | 548 (94.3%) | 33 (5.7%) |
| Total (Category) | 1,299 (96.3%) | 50 (3.7%) |
| Total (Overall) | 7,341 (52.6%) | 6,625 (47.4%) |
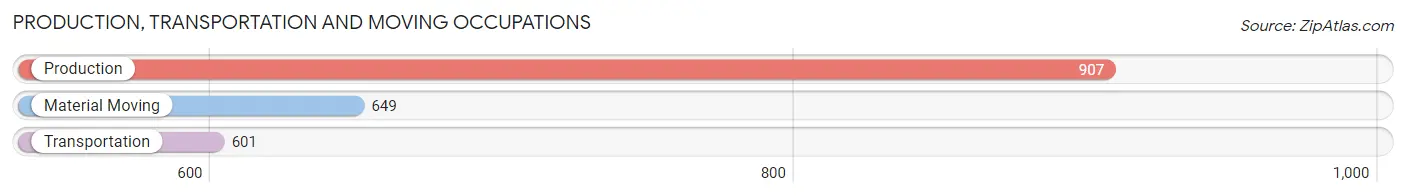
Production, Transportation and Moving Occupations
The most common Production, Transportation and Moving occupations in Allen Park are Production (907 | 6.5%), Material Moving (649 | 4.6%), and Transportation (601 | 4.3%).
Production, Transportation and Moving Occupations by Sex
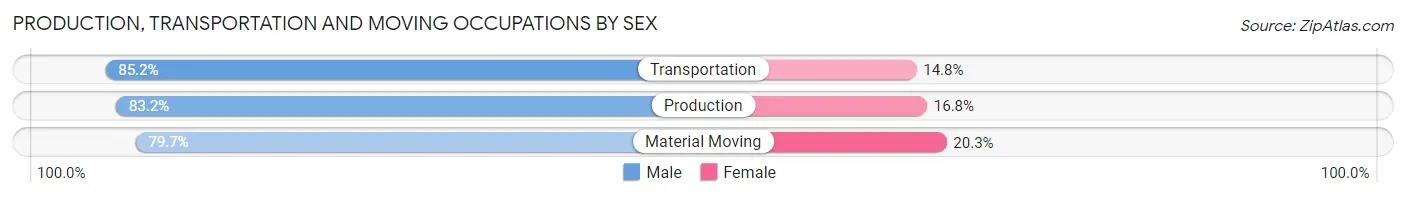
| Occupation | Male | Female |
| Production | 755 (83.2%) | 152 (16.8%) |
| Transportation | 512 (85.2%) | 89 (14.8%) |
| Material Moving | 517 (79.7%) | 132 (20.3%) |
| Total (Category) | 1,784 (82.7%) | 373 (17.3%) |
| Total (Overall) | 7,341 (52.6%) | 6,625 (47.4%) |
Employment Industries by Sex in Allen Park
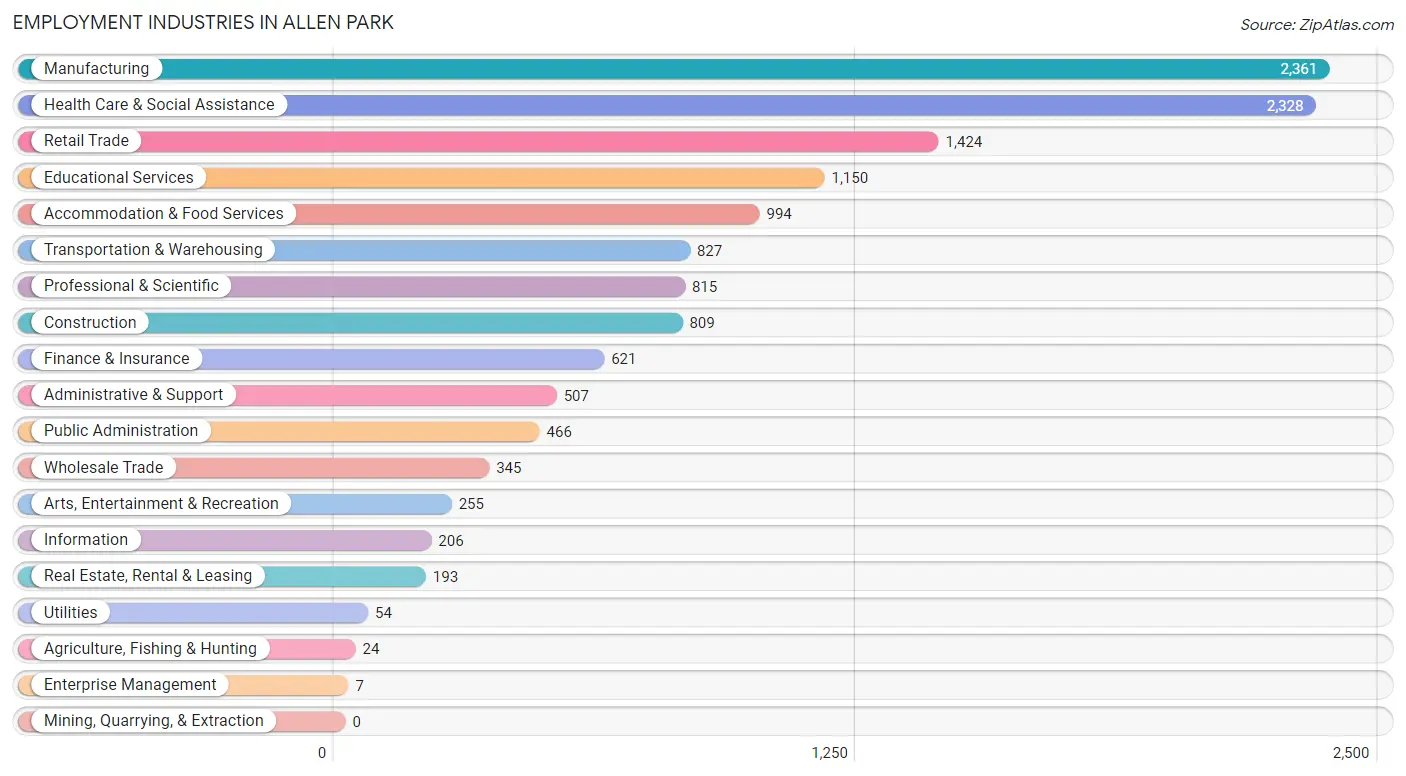
Employment Industries in Allen Park
The major employment industries in Allen Park include Manufacturing (2,361 | 16.9%), Health Care & Social Assistance (2,328 | 16.7%), Retail Trade (1,424 | 10.2%), Educational Services (1,150 | 8.2%), and Accommodation & Food Services (994 | 7.1%).
Employment Industries by Sex in Allen Park
The Allen Park industries that see more men than women are Agriculture, Fishing & Hunting (100.0%), Utilities (100.0%), and Arts, Entertainment & Recreation (85.9%), whereas the industries that tend to have a higher number of women are Enterprise Management (100.0%), Health Care & Social Assistance (74.2%), and Finance & Insurance (73.4%).
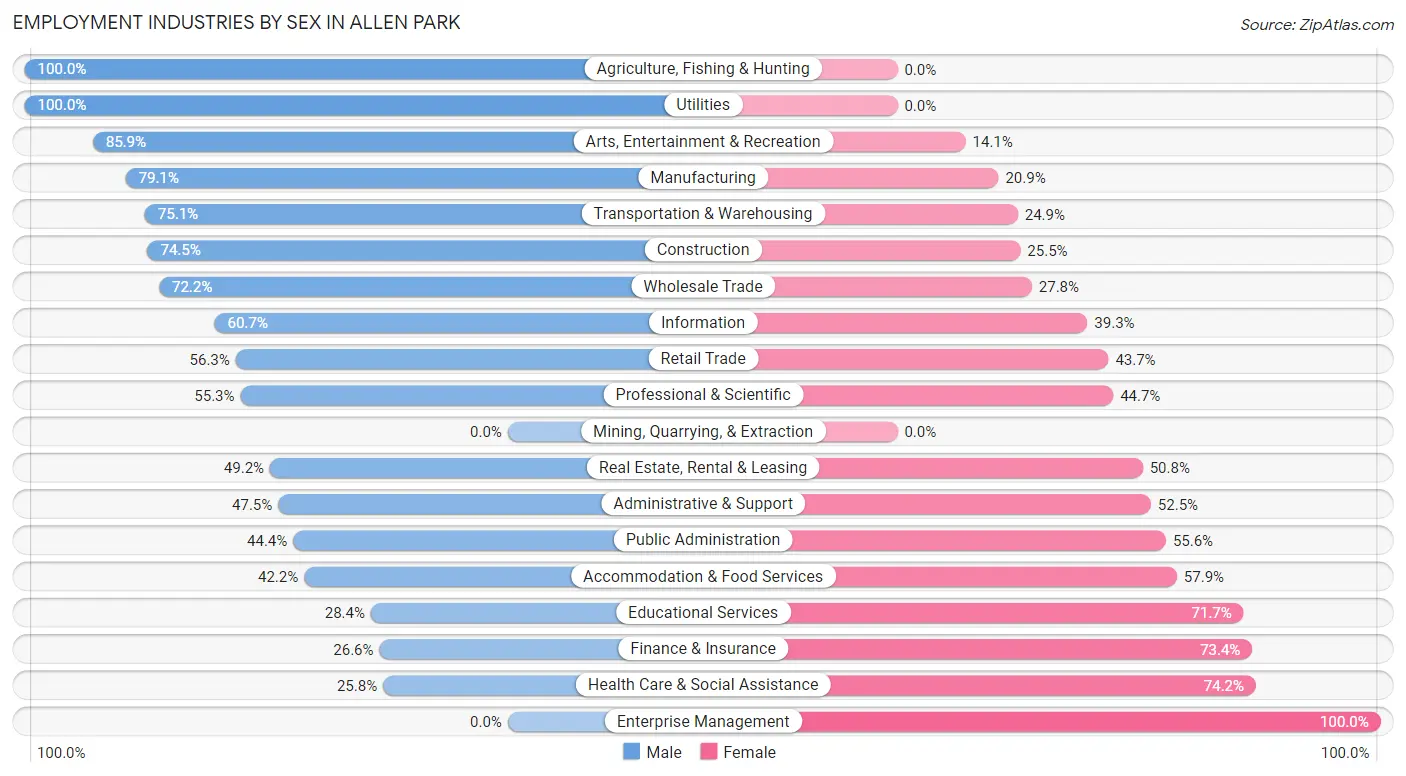
| Industry | Male | Female |
| Agriculture, Fishing & Hunting | 24 (100.0%) | 0 (0.0%) |
| Mining, Quarrying, & Extraction | 0 (0.0%) | 0 (0.0%) |
| Construction | 603 (74.5%) | 206 (25.5%) |
| Manufacturing | 1,867 (79.1%) | 494 (20.9%) |
| Wholesale Trade | 249 (72.2%) | 96 (27.8%) |
| Retail Trade | 802 (56.3%) | 622 (43.7%) |
| Transportation & Warehousing | 621 (75.1%) | 206 (24.9%) |
| Utilities | 54 (100.0%) | 0 (0.0%) |
| Information | 125 (60.7%) | 81 (39.3%) |
| Finance & Insurance | 165 (26.6%) | 456 (73.4%) |
| Real Estate, Rental & Leasing | 95 (49.2%) | 98 (50.8%) |
| Professional & Scientific | 451 (55.3%) | 364 (44.7%) |
| Enterprise Management | 0 (0.0%) | 7 (100.0%) |
| Administrative & Support | 241 (47.5%) | 266 (52.5%) |
| Educational Services | 326 (28.3%) | 824 (71.7%) |
| Health Care & Social Assistance | 601 (25.8%) | 1,727 (74.2%) |
| Arts, Entertainment & Recreation | 219 (85.9%) | 36 (14.1%) |
| Accommodation & Food Services | 419 (42.1%) | 575 (57.9%) |
| Public Administration | 207 (44.4%) | 259 (55.6%) |
| Total | 7,341 (52.6%) | 6,625 (47.4%) |
Education in Allen Park
School Enrollment in Allen Park
The most common levels of schooling among the 6,137 students in Allen Park are middle school (1,546 | 25.2%), high school (1,387 | 22.6%), and college / undergraduate (1,218 | 19.9%).
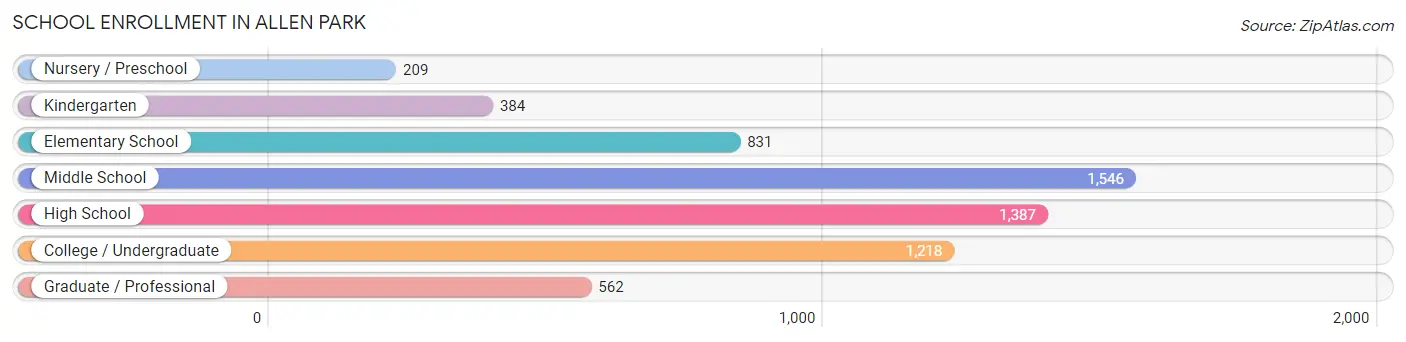
| School Level | # Students | % Students |
| Nursery / Preschool | 209 | 3.4% |
| Kindergarten | 384 | 6.3% |
| Elementary School | 831 | 13.5% |
| Middle School | 1,546 | 25.2% |
| High School | 1,387 | 22.6% |
| College / Undergraduate | 1,218 | 19.9% |
| Graduate / Professional | 562 | 9.2% |
| Total | 6,137 | 100.0% |
School Enrollment by Age by Funding Source in Allen Park
Out of a total of 6,137 students who are enrolled in schools in Allen Park, 1,436 (23.4%) attend a private institution, while the remaining 4,701 (76.6%) are enrolled in public schools. The age group of 35 years and over has the highest likelihood of being enrolled in private schools, with 255 (52.1% in the age bracket) enrolled. Conversely, the age group of 18 to 19 year olds has the lowest likelihood of being enrolled in a private school, with 243 (92.4% in the age bracket) attending a public institution.
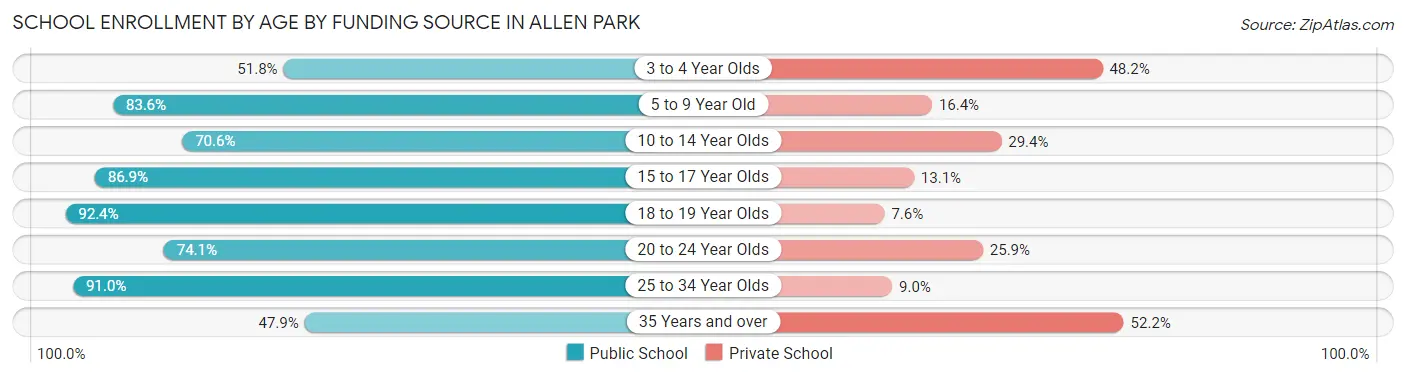
| Age Bracket | Public School | Private School |
| 3 to 4 Year Olds | 87 (51.8%) | 81 (48.2%) |
| 5 to 9 Year Old | 986 (83.6%) | 194 (16.4%) |
| 10 to 14 Year Olds | 1,311 (70.6%) | 545 (29.4%) |
| 15 to 17 Year Olds | 884 (86.9%) | 133 (13.1%) |
| 18 to 19 Year Olds | 243 (92.4%) | 20 (7.6%) |
| 20 to 24 Year Olds | 460 (74.1%) | 161 (25.9%) |
| 25 to 34 Year Olds | 494 (91.0%) | 49 (9.0%) |
| 35 Years and over | 234 (47.8%) | 255 (52.1%) |
| Total | 4,701 (76.6%) | 1,436 (23.4%) |
Educational Attainment by Field of Study in Allen Park
Business (1,099 | 18.0%), science & technology (1,076 | 17.6%), education (753 | 12.3%), psychology (525 | 8.6%), and computers & mathematics (450 | 7.4%) are the most common fields of study among 6,096 individuals in Allen Park who have obtained a bachelor's degree or higher.
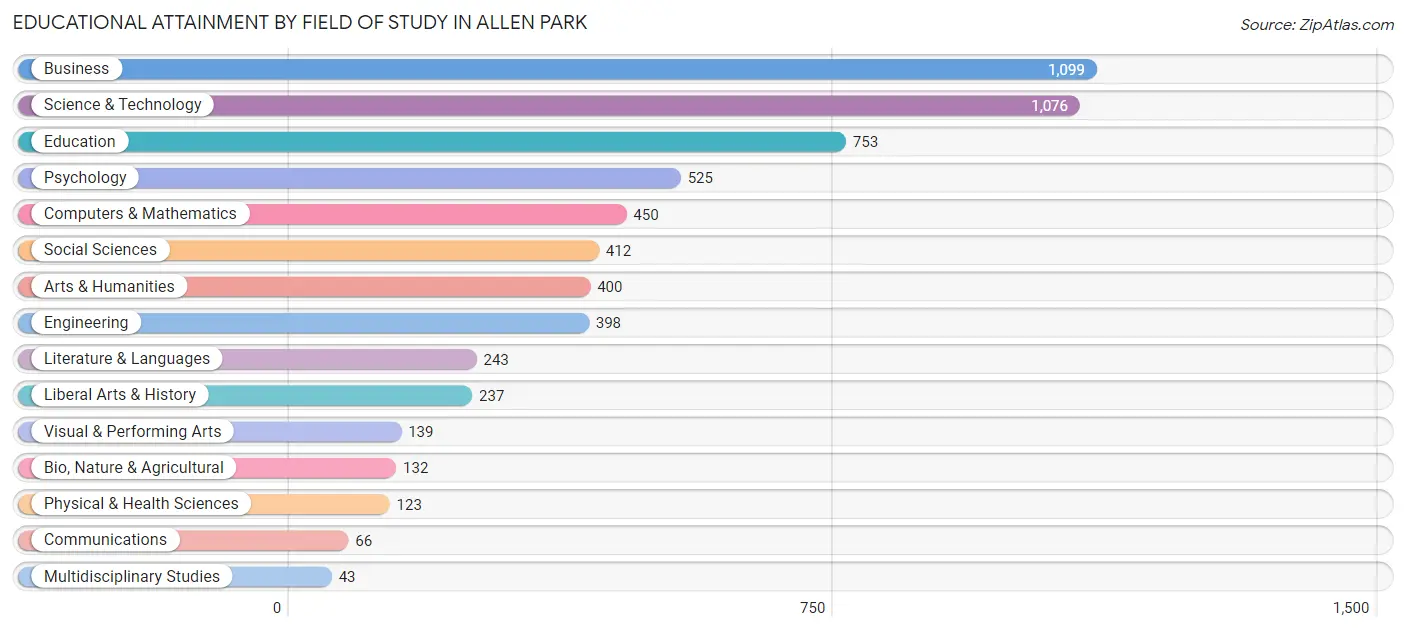
| Field of Study | # Graduates | % Graduates |
| Computers & Mathematics | 450 | 7.4% |
| Bio, Nature & Agricultural | 132 | 2.2% |
| Physical & Health Sciences | 123 | 2.0% |
| Psychology | 525 | 8.6% |
| Social Sciences | 412 | 6.8% |
| Engineering | 398 | 6.5% |
| Multidisciplinary Studies | 43 | 0.7% |
| Science & Technology | 1,076 | 17.6% |
| Business | 1,099 | 18.0% |
| Education | 753 | 12.3% |
| Literature & Languages | 243 | 4.0% |
| Liberal Arts & History | 237 | 3.9% |
| Visual & Performing Arts | 139 | 2.3% |
| Communications | 66 | 1.1% |
| Arts & Humanities | 400 | 6.6% |
| Total | 6,096 | 100.0% |
Transportation & Commute in Allen Park
Vehicle Availability by Sex in Allen Park
The most prevalent vehicle ownership categories in Allen Park are males with 2 vehicles (3,374, accounting for 46.9%) and females with 2 vehicles (2,965, making up 52.0%).
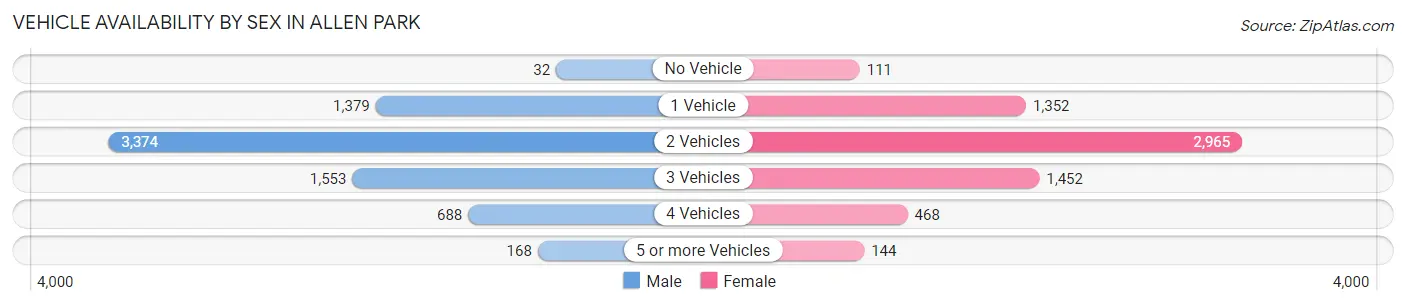
| Vehicles Available | Male | Female |
| No Vehicle | 32 (0.4%) | 111 (1.7%) |
| 1 Vehicle | 1,379 (19.2%) | 1,352 (20.8%) |
| 2 Vehicles | 3,374 (46.9%) | 2,965 (45.7%) |
| 3 Vehicles | 1,553 (21.6%) | 1,452 (22.4%) |
| 4 Vehicles | 688 (9.6%) | 468 (7.2%) |
| 5 or more Vehicles | 168 (2.3%) | 144 (2.2%) |
| Total | 7,194 (100.0%) | 6,492 (100.0%) |
Commute Time in Allen Park
The most frequently occuring commute durations in Allen Park are 15 to 19 minutes (2,355 commuters, 18.7%), 10 to 14 minutes (1,780 commuters, 14.1%), and 20 to 24 minutes (1,764 commuters, 14.0%).
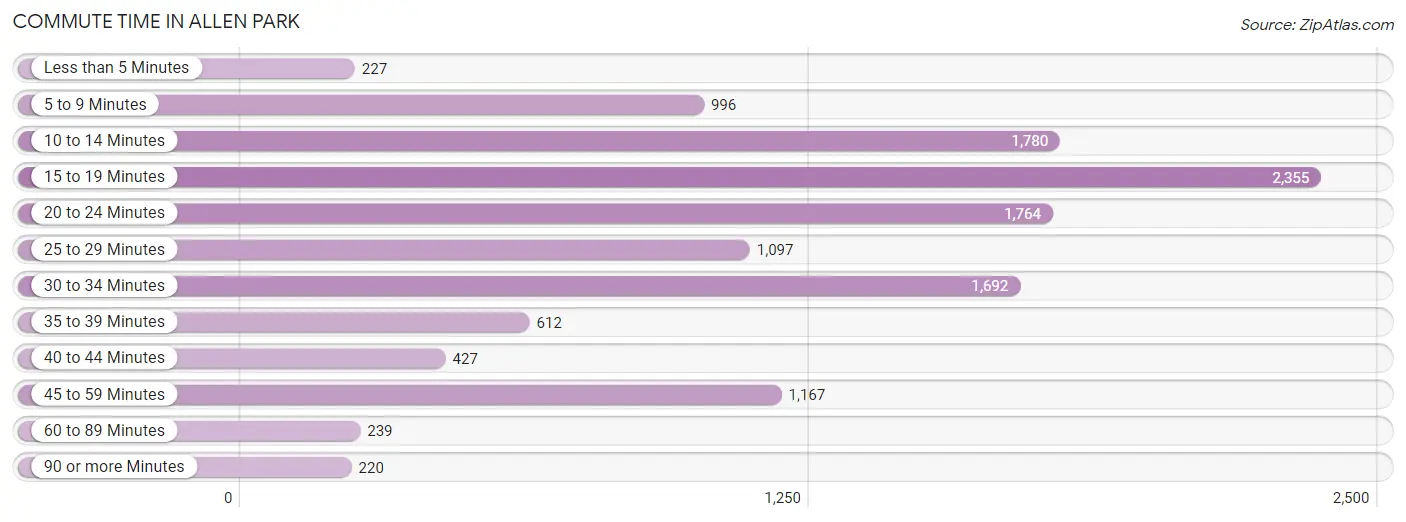
| Commute Time | # Commuters | % Commuters |
| Less than 5 Minutes | 227 | 1.8% |
| 5 to 9 Minutes | 996 | 7.9% |
| 10 to 14 Minutes | 1,780 | 14.1% |
| 15 to 19 Minutes | 2,355 | 18.7% |
| 20 to 24 Minutes | 1,764 | 14.0% |
| 25 to 29 Minutes | 1,097 | 8.7% |
| 30 to 34 Minutes | 1,692 | 13.5% |
| 35 to 39 Minutes | 612 | 4.9% |
| 40 to 44 Minutes | 427 | 3.4% |
| 45 to 59 Minutes | 1,167 | 9.3% |
| 60 to 89 Minutes | 239 | 1.9% |
| 90 or more Minutes | 220 | 1.8% |
Commute Time by Sex in Allen Park
The most common commute times in Allen Park are 15 to 19 minutes (1,283 commuters, 19.0%) for males and 15 to 19 minutes (1,072 commuters, 18.4%) for females.
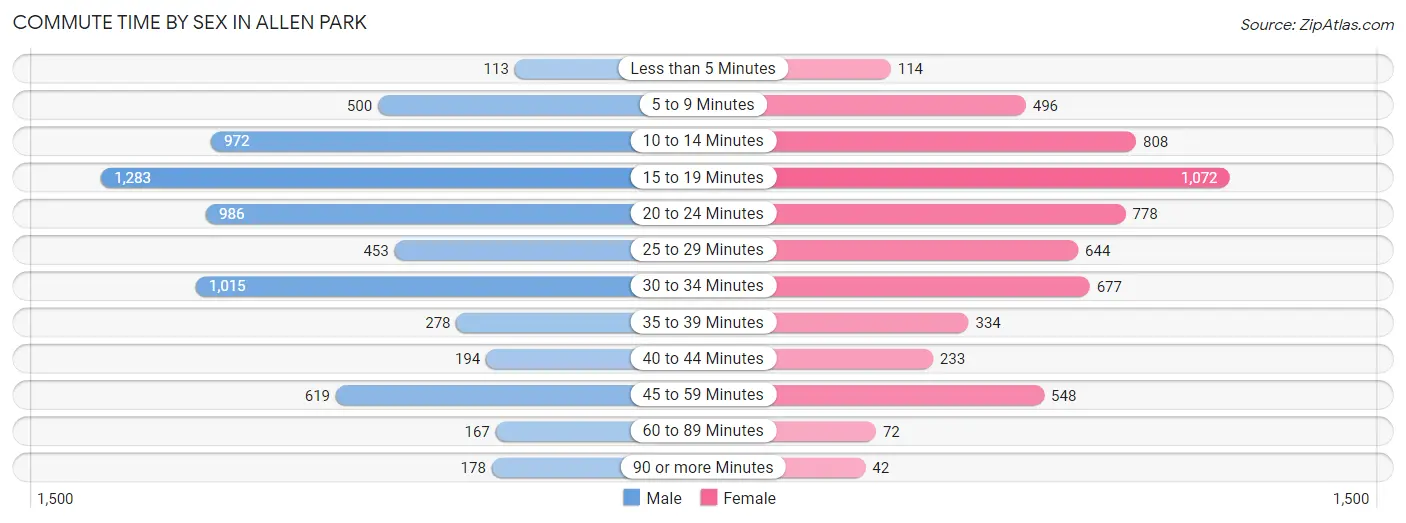
| Commute Time | Male | Female |
| Less than 5 Minutes | 113 (1.7%) | 114 (2.0%) |
| 5 to 9 Minutes | 500 (7.4%) | 496 (8.5%) |
| 10 to 14 Minutes | 972 (14.4%) | 808 (13.9%) |
| 15 to 19 Minutes | 1,283 (19.0%) | 1,072 (18.4%) |
| 20 to 24 Minutes | 986 (14.6%) | 778 (13.4%) |
| 25 to 29 Minutes | 453 (6.7%) | 644 (11.1%) |
| 30 to 34 Minutes | 1,015 (15.0%) | 677 (11.6%) |
| 35 to 39 Minutes | 278 (4.1%) | 334 (5.7%) |
| 40 to 44 Minutes | 194 (2.9%) | 233 (4.0%) |
| 45 to 59 Minutes | 619 (9.2%) | 548 (9.4%) |
| 60 to 89 Minutes | 167 (2.5%) | 72 (1.2%) |
| 90 or more Minutes | 178 (2.6%) | 42 (0.7%) |
Time of Departure to Work by Sex in Allen Park
The most frequent times of departure to work in Allen Park are 7:00 AM to 7:29 AM (802, 11.9%) for males and 7:30 AM to 7:59 AM (782, 13.4%) for females.
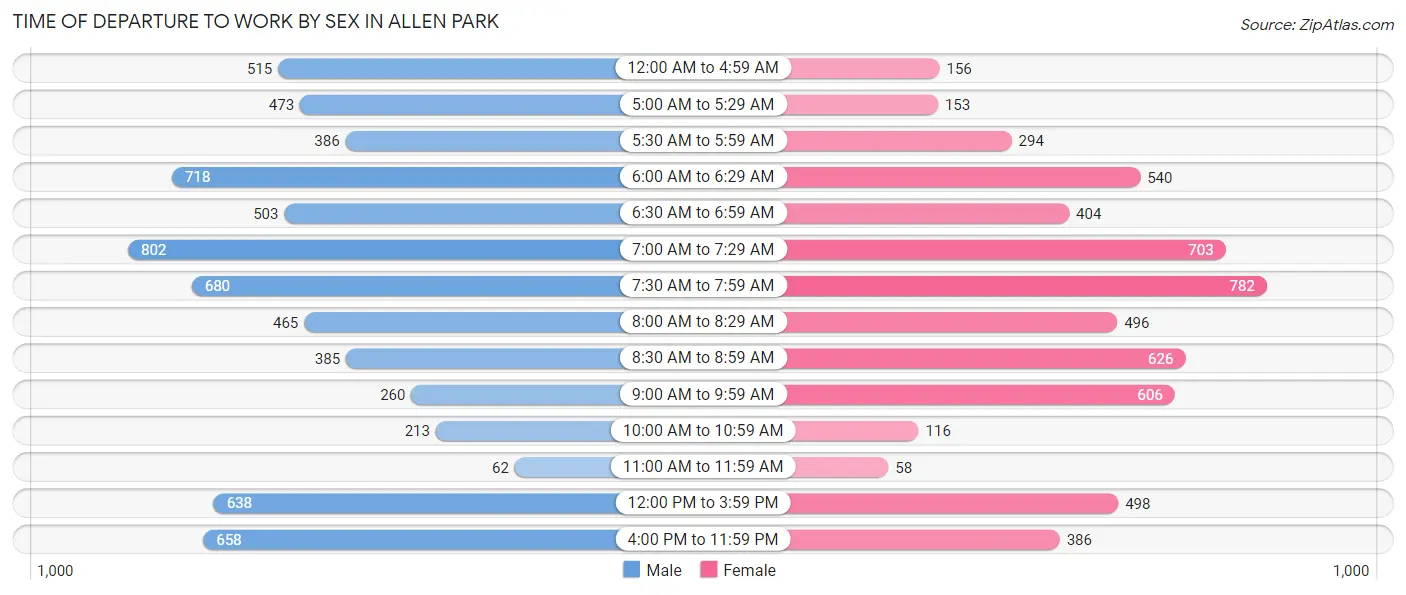
| Time of Departure | Male | Female |
| 12:00 AM to 4:59 AM | 515 (7.6%) | 156 (2.7%) |
| 5:00 AM to 5:29 AM | 473 (7.0%) | 153 (2.6%) |
| 5:30 AM to 5:59 AM | 386 (5.7%) | 294 (5.1%) |
| 6:00 AM to 6:29 AM | 718 (10.6%) | 540 (9.3%) |
| 6:30 AM to 6:59 AM | 503 (7.4%) | 404 (6.9%) |
| 7:00 AM to 7:29 AM | 802 (11.9%) | 703 (12.1%) |
| 7:30 AM to 7:59 AM | 680 (10.1%) | 782 (13.4%) |
| 8:00 AM to 8:29 AM | 465 (6.9%) | 496 (8.5%) |
| 8:30 AM to 8:59 AM | 385 (5.7%) | 626 (10.8%) |
| 9:00 AM to 9:59 AM | 260 (3.8%) | 606 (10.4%) |
| 10:00 AM to 10:59 AM | 213 (3.2%) | 116 (2.0%) |
| 11:00 AM to 11:59 AM | 62 (0.9%) | 58 (1.0%) |
| 12:00 PM to 3:59 PM | 638 (9.4%) | 498 (8.6%) |
| 4:00 PM to 11:59 PM | 658 (9.7%) | 386 (6.6%) |
| Total | 6,758 (100.0%) | 5,818 (100.0%) |
Housing Occupancy in Allen Park
Occupancy by Ownership in Allen Park
Of the total 11,854 dwellings in Allen Park, owner-occupied units account for 10,219 (86.2%), while renter-occupied units make up 1,635 (13.8%).
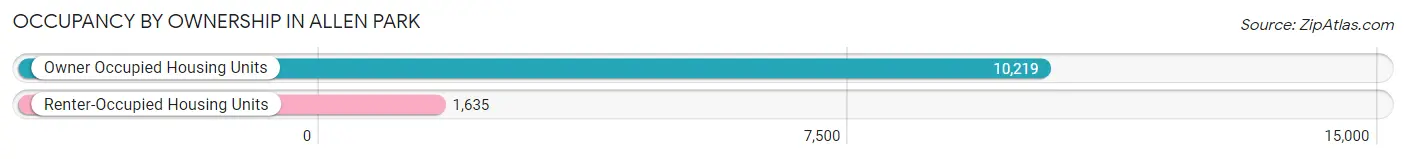
| Occupancy | # Housing Units | % Housing Units |
| Owner Occupied Housing Units | 10,219 | 86.2% |
| Renter-Occupied Housing Units | 1,635 | 13.8% |
| Total Occupied Housing Units | 11,854 | 100.0% |
Occupancy by Household Size in Allen Park
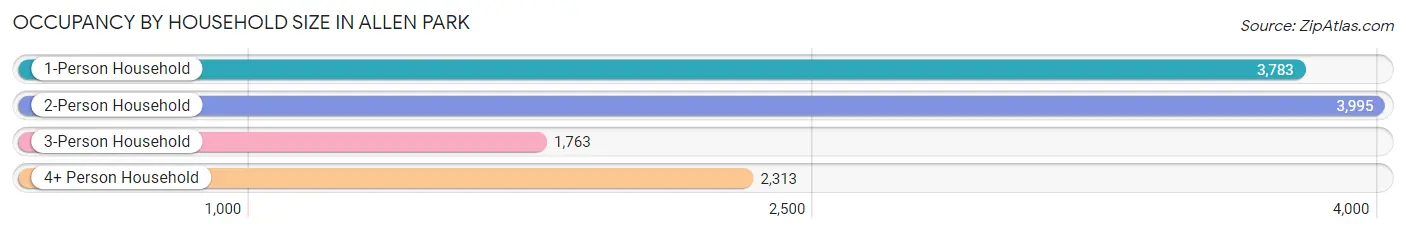
| Household Size | # Housing Units | % Housing Units |
| 1-Person Household | 3,783 | 31.9% |
| 2-Person Household | 3,995 | 33.7% |
| 3-Person Household | 1,763 | 14.9% |
| 4+ Person Household | 2,313 | 19.5% |
| Total Housing Units | 11,854 | 100.0% |
Occupancy by Ownership by Household Size in Allen Park
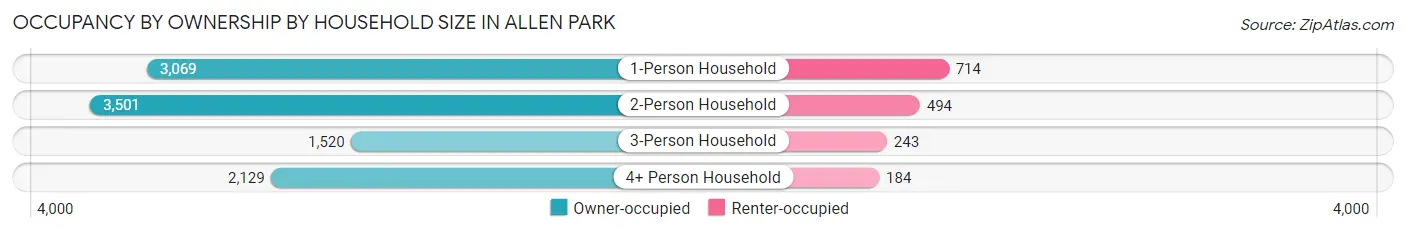
| Household Size | Owner-occupied | Renter-occupied |
| 1-Person Household | 3,069 (81.1%) | 714 (18.9%) |
| 2-Person Household | 3,501 (87.6%) | 494 (12.4%) |
| 3-Person Household | 1,520 (86.2%) | 243 (13.8%) |
| 4+ Person Household | 2,129 (92.0%) | 184 (8.0%) |
| Total Housing Units | 10,219 (86.2%) | 1,635 (13.8%) |
Occupancy by Educational Attainment in Allen Park
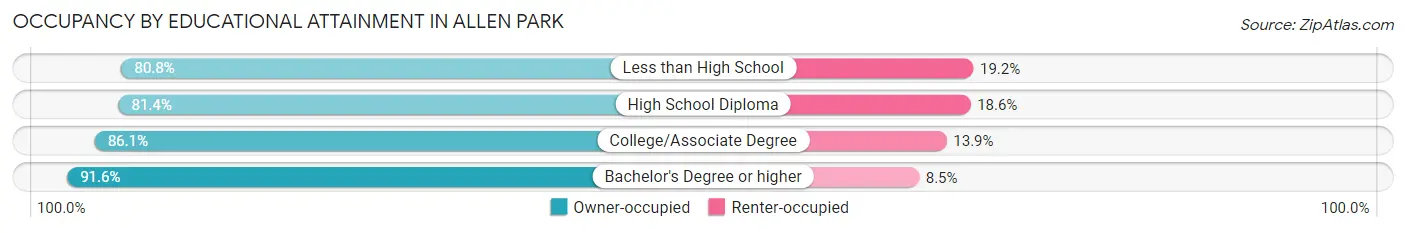
| Household Size | Owner-occupied | Renter-occupied |
| Less than High School | 606 (80.8%) | 144 (19.2%) |
| High School Diploma | 2,401 (81.4%) | 550 (18.6%) |
| College/Associate Degree | 3,972 (86.1%) | 642 (13.9%) |
| Bachelor's Degree or higher | 3,240 (91.5%) | 299 (8.5%) |
Occupancy by Age of Householder in Allen Park
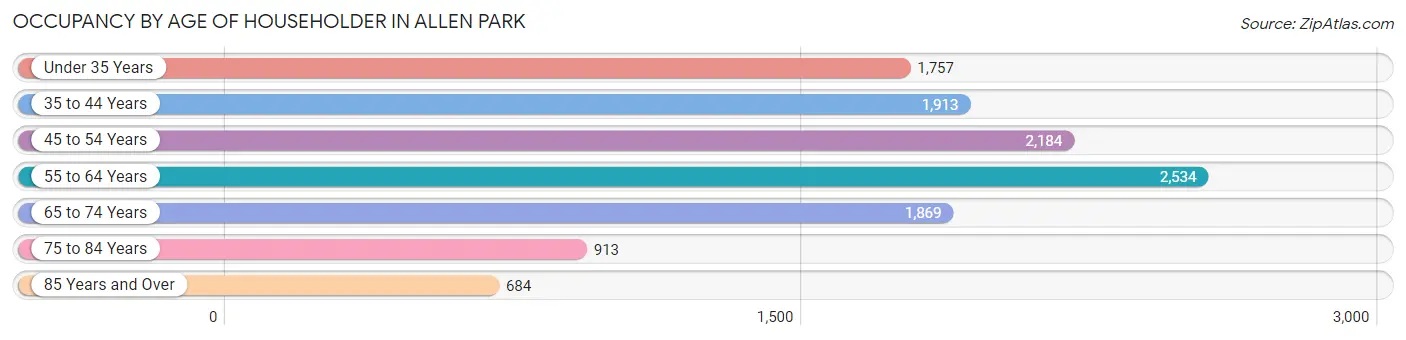
| Age Bracket | # Households | % Households |
| Under 35 Years | 1,757 | 14.8% |
| 35 to 44 Years | 1,913 | 16.1% |
| 45 to 54 Years | 2,184 | 18.4% |
| 55 to 64 Years | 2,534 | 21.4% |
| 65 to 74 Years | 1,869 | 15.8% |
| 75 to 84 Years | 913 | 7.7% |
| 85 Years and Over | 684 | 5.8% |
| Total | 11,854 | 100.0% |
Housing Finances in Allen Park
Median Income by Occupancy in Allen Park
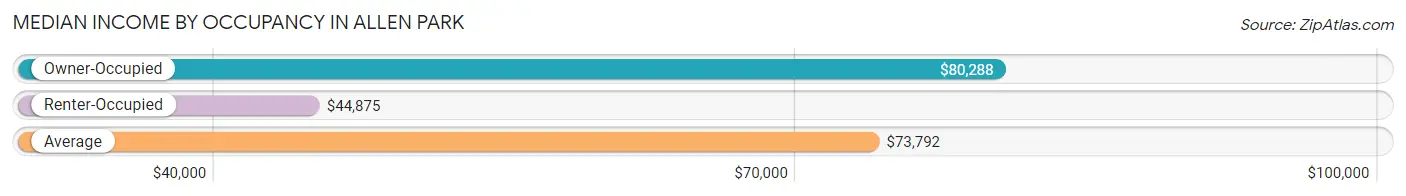
| Occupancy Type | # Households | Median Income |
| Owner-Occupied | 10,219 (86.2%) | $80,288 |
| Renter-Occupied | 1,635 (13.8%) | $44,875 |
| Average | 11,854 (100.0%) | $73,792 |
Occupancy by Householder Income Bracket in Allen Park
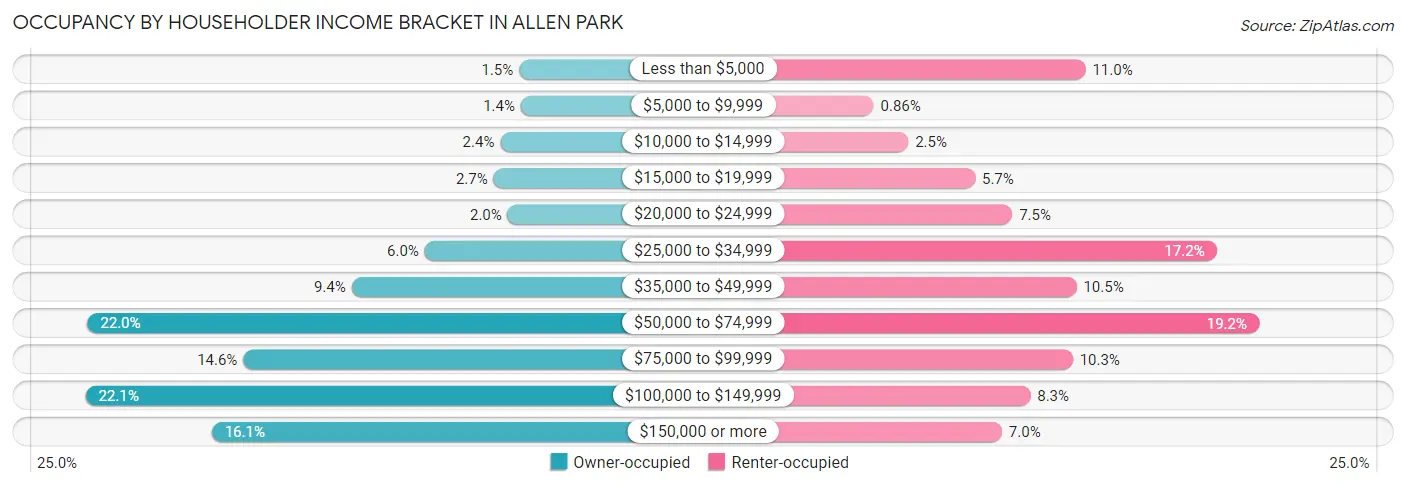
| Income Bracket | Owner-occupied | Renter-occupied |
| Less than $5,000 | 148 (1.5%) | 179 (11.0%) |
| $5,000 to $9,999 | 140 (1.4%) | 14 (0.9%) |
| $10,000 to $14,999 | 240 (2.4%) | 41 (2.5%) |
| $15,000 to $19,999 | 273 (2.7%) | 93 (5.7%) |
| $20,000 to $24,999 | 204 (2.0%) | 122 (7.5%) |
| $25,000 to $34,999 | 608 (5.9%) | 281 (17.2%) |
| $35,000 to $49,999 | 964 (9.4%) | 172 (10.5%) |
| $50,000 to $74,999 | 2,249 (22.0%) | 314 (19.2%) |
| $75,000 to $99,999 | 1,491 (14.6%) | 169 (10.3%) |
| $100,000 to $149,999 | 2,258 (22.1%) | 136 (8.3%) |
| $150,000 or more | 1,644 (16.1%) | 114 (7.0%) |
| Total | 10,219 (100.0%) | 1,635 (100.0%) |
Monthly Housing Cost Tiers in Allen Park
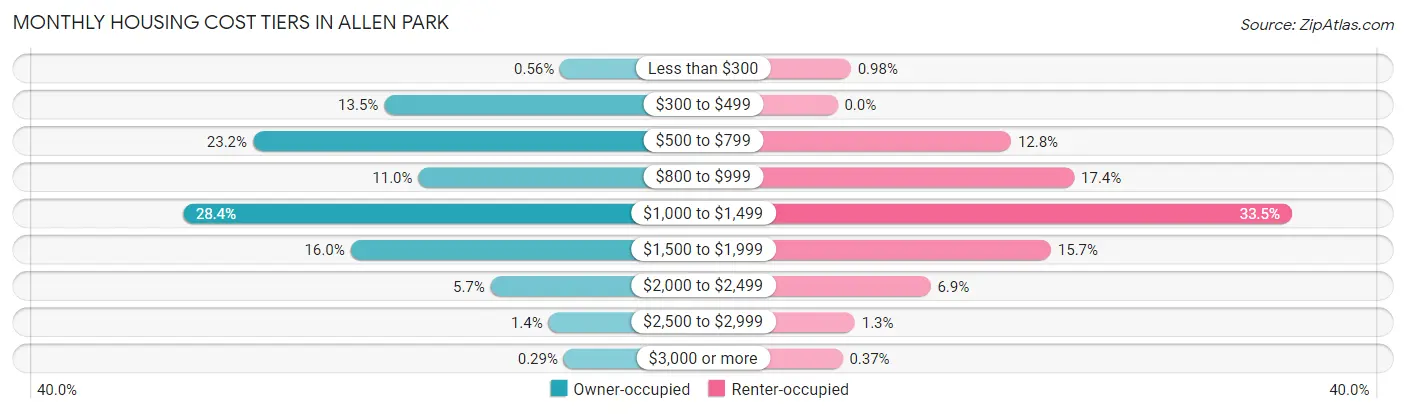
| Monthly Cost | Owner-occupied | Renter-occupied |
| Less than $300 | 57 (0.6%) | 16 (1.0%) |
| $300 to $499 | 1,382 (13.5%) | 0 (0.0%) |
| $500 to $799 | 2,370 (23.2%) | 209 (12.8%) |
| $800 to $999 | 1,124 (11.0%) | 285 (17.4%) |
| $1,000 to $1,499 | 2,897 (28.3%) | 547 (33.5%) |
| $1,500 to $1,999 | 1,635 (16.0%) | 257 (15.7%) |
| $2,000 to $2,499 | 580 (5.7%) | 112 (6.9%) |
| $2,500 to $2,999 | 144 (1.4%) | 21 (1.3%) |
| $3,000 or more | 30 (0.3%) | 6 (0.4%) |
| Total | 10,219 (100.0%) | 1,635 (100.0%) |
Physical Housing Characteristics in Allen Park
Housing Structures in Allen Park
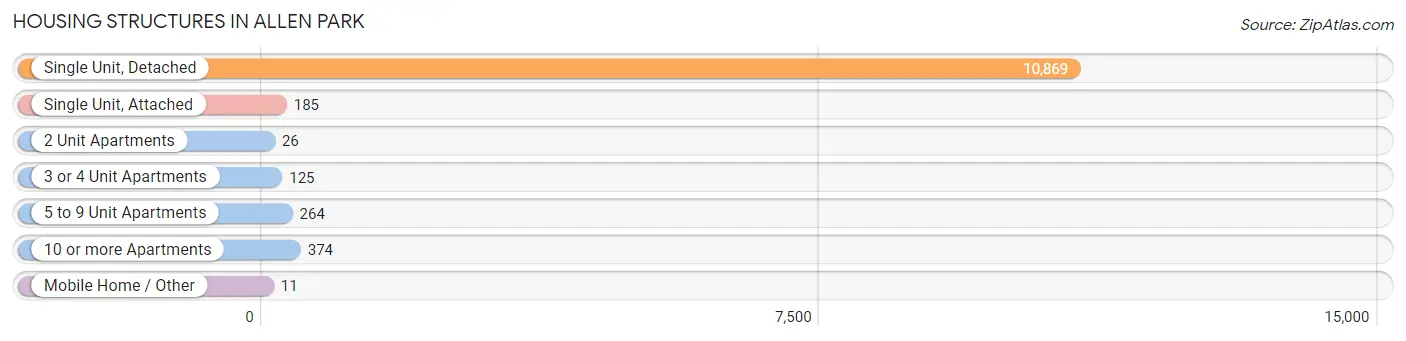
| Structure Type | # Housing Units | % Housing Units |
| Single Unit, Detached | 10,869 | 91.7% |
| Single Unit, Attached | 185 | 1.6% |
| 2 Unit Apartments | 26 | 0.2% |
| 3 or 4 Unit Apartments | 125 | 1.1% |
| 5 to 9 Unit Apartments | 264 | 2.2% |
| 10 or more Apartments | 374 | 3.2% |
| Mobile Home / Other | 11 | 0.1% |
| Total | 11,854 | 100.0% |
Housing Structures by Occupancy in Allen Park
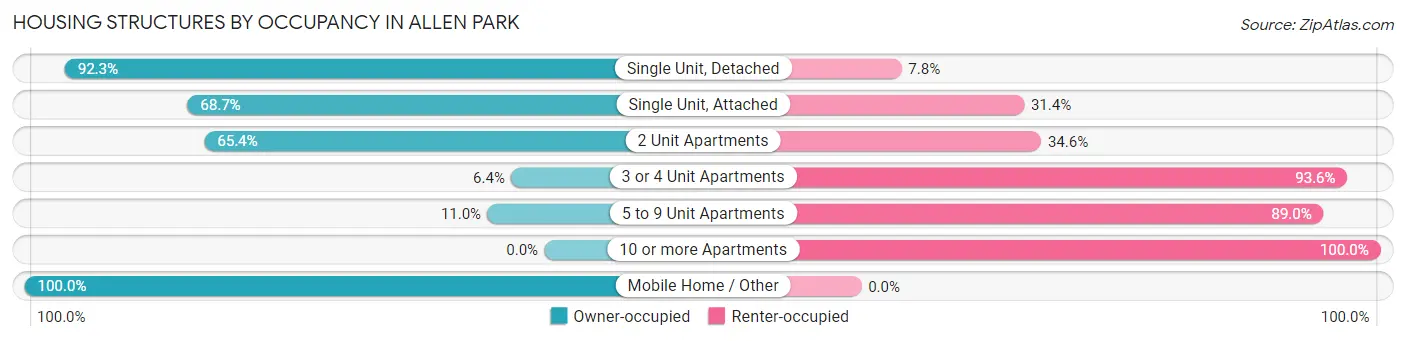
| Structure Type | Owner-occupied | Renter-occupied |
| Single Unit, Detached | 10,027 (92.2%) | 842 (7.7%) |
| Single Unit, Attached | 127 (68.6%) | 58 (31.4%) |
| 2 Unit Apartments | 17 (65.4%) | 9 (34.6%) |
| 3 or 4 Unit Apartments | 8 (6.4%) | 117 (93.6%) |
| 5 to 9 Unit Apartments | 29 (11.0%) | 235 (89.0%) |
| 10 or more Apartments | 0 (0.0%) | 374 (100.0%) |
| Mobile Home / Other | 11 (100.0%) | 0 (0.0%) |
| Total | 10,219 (86.2%) | 1,635 (13.8%) |
Housing Structures by Number of Rooms in Allen Park
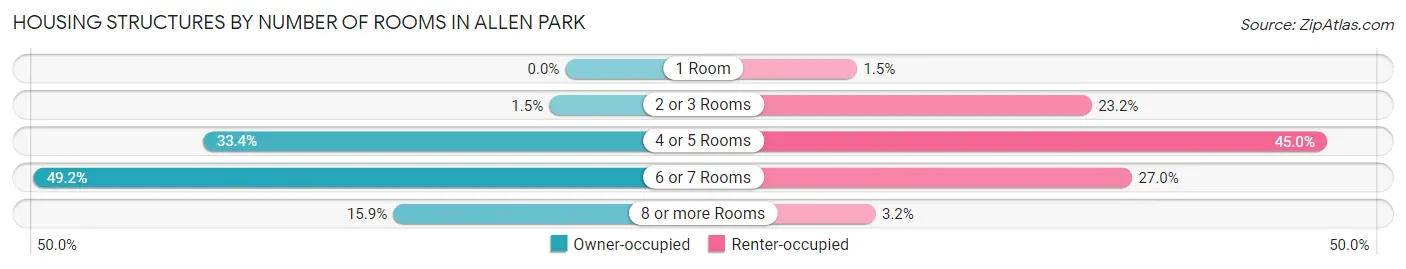
| Number of Rooms | Owner-occupied | Renter-occupied |
| 1 Room | 0 (0.0%) | 25 (1.5%) |
| 2 or 3 Rooms | 153 (1.5%) | 380 (23.2%) |
| 4 or 5 Rooms | 3,415 (33.4%) | 736 (45.0%) |
| 6 or 7 Rooms | 5,023 (49.1%) | 441 (27.0%) |
| 8 or more Rooms | 1,628 (15.9%) | 53 (3.2%) |
| Total | 10,219 (100.0%) | 1,635 (100.0%) |
Housing Structure by Heating Type in Allen Park
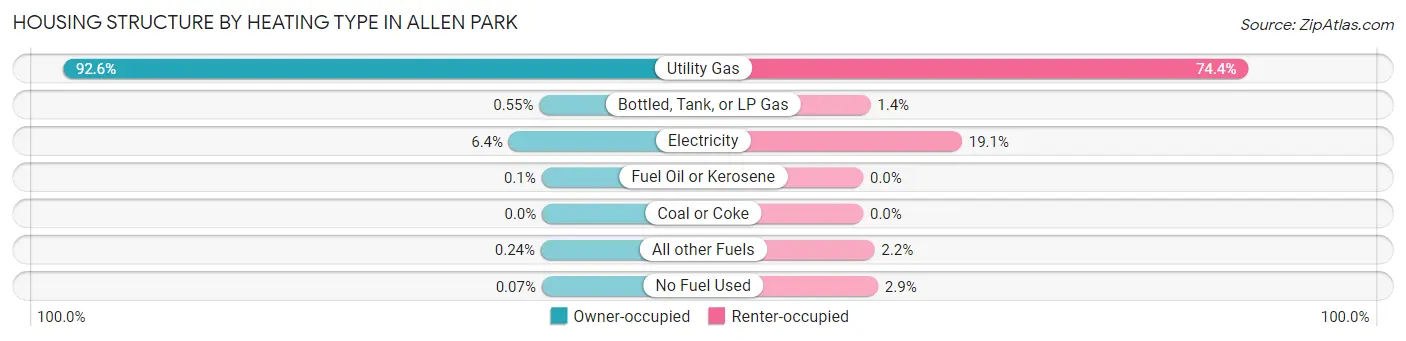
| Heating Type | Owner-occupied | Renter-occupied |
| Utility Gas | 9,465 (92.6%) | 1,217 (74.4%) |
| Bottled, Tank, or LP Gas | 56 (0.5%) | 23 (1.4%) |
| Electricity | 656 (6.4%) | 312 (19.1%) |
| Fuel Oil or Kerosene | 10 (0.1%) | 0 (0.0%) |
| Coal or Coke | 0 (0.0%) | 0 (0.0%) |
| All other Fuels | 25 (0.2%) | 36 (2.2%) |
| No Fuel Used | 7 (0.1%) | 47 (2.9%) |
| Total | 10,219 (100.0%) | 1,635 (100.0%) |
Household Vehicle Usage in Allen Park
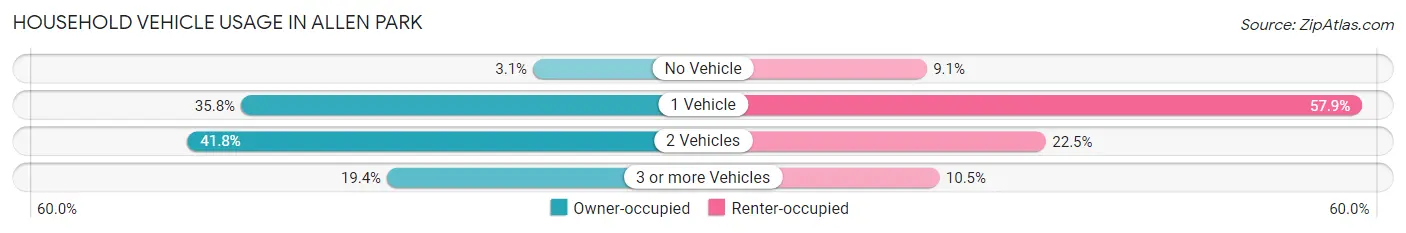
| Vehicles per Household | Owner-occupied | Renter-occupied |
| No Vehicle | 313 (3.1%) | 149 (9.1%) |
| 1 Vehicle | 3,655 (35.8%) | 947 (57.9%) |
| 2 Vehicles | 4,267 (41.8%) | 367 (22.5%) |
| 3 or more Vehicles | 1,984 (19.4%) | 172 (10.5%) |
| Total | 10,219 (100.0%) | 1,635 (100.0%) |
Real Estate & Mortgages in Allen Park
Real Estate and Mortgage Overview in Allen Park
| Characteristic | Without Mortgage | With Mortgage |
| Housing Units | 4,217 | 6,002 |
| Median Property Value | $157,700 | $171,400 |
| Median Household Income | $60,761 | $1,184 |
| Monthly Housing Costs | $569 | $30 |
| Real Estate Taxes | $3,048 | $226 |
Property Value by Mortgage Status in Allen Park
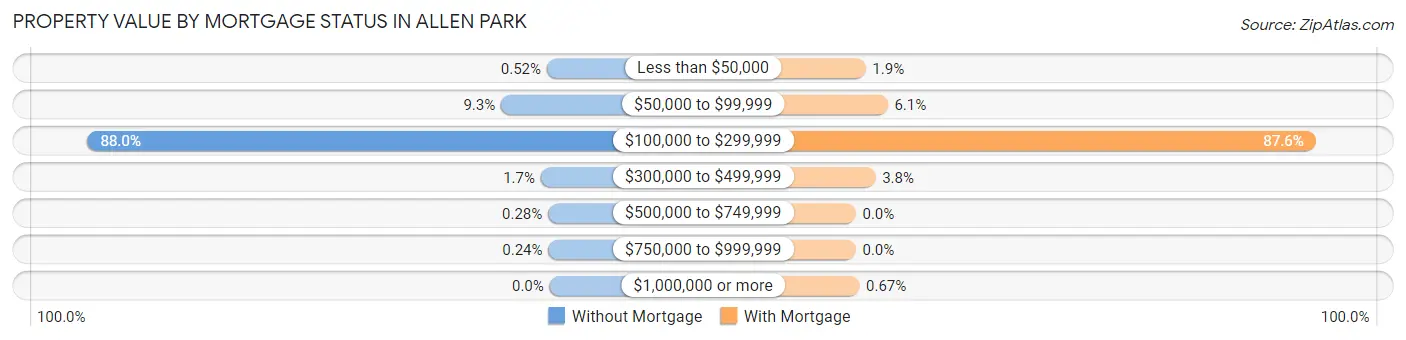
| Property Value | Without Mortgage | With Mortgage |
| Less than $50,000 | 22 (0.5%) | 113 (1.9%) |
| $50,000 to $99,999 | 390 (9.2%) | 365 (6.1%) |
| $100,000 to $299,999 | 3,712 (88.0%) | 5,259 (87.6%) |
| $300,000 to $499,999 | 71 (1.7%) | 225 (3.7%) |
| $500,000 to $749,999 | 12 (0.3%) | 0 (0.0%) |
| $750,000 to $999,999 | 10 (0.2%) | 0 (0.0%) |
| $1,000,000 or more | 0 (0.0%) | 40 (0.7%) |
| Total | 4,217 (100.0%) | 6,002 (100.0%) |
Household Income by Mortgage Status in Allen Park
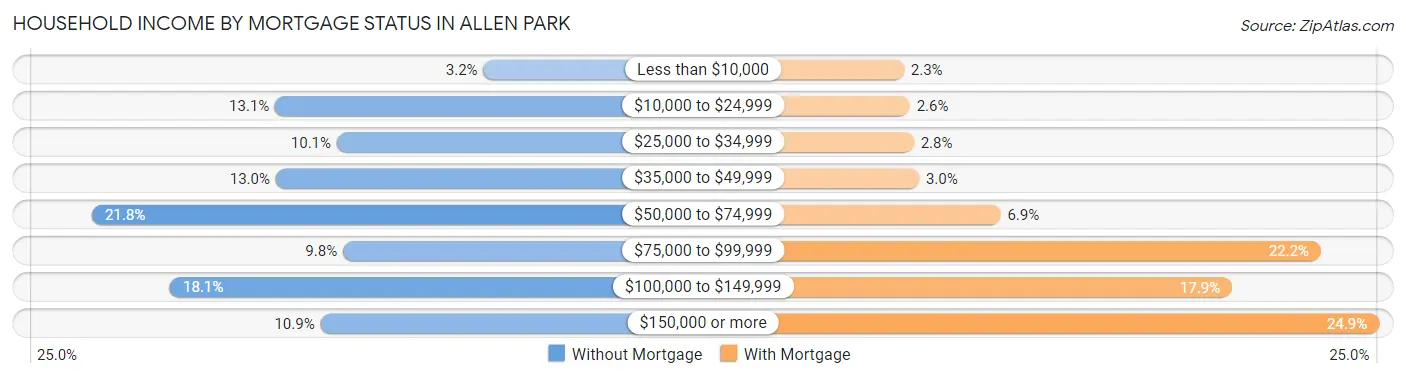
| Household Income | Without Mortgage | With Mortgage |
| Less than $10,000 | 133 (3.2%) | 138 (2.3%) |
| $10,000 to $24,999 | 551 (13.1%) | 155 (2.6%) |
| $25,000 to $34,999 | 427 (10.1%) | 166 (2.8%) |
| $35,000 to $49,999 | 550 (13.0%) | 181 (3.0%) |
| $50,000 to $74,999 | 919 (21.8%) | 414 (6.9%) |
| $75,000 to $99,999 | 415 (9.8%) | 1,330 (22.2%) |
| $100,000 to $149,999 | 762 (18.1%) | 1,076 (17.9%) |
| $150,000 or more | 460 (10.9%) | 1,496 (24.9%) |
| Total | 4,217 (100.0%) | 6,002 (100.0%) |
Property Value to Household Income Ratio in Allen Park
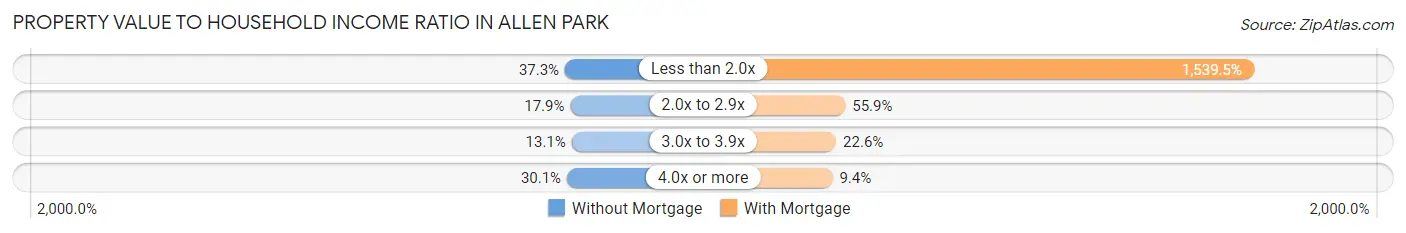
| Value-to-Income Ratio | Without Mortgage | With Mortgage |
| Less than 2.0x | 1,572 (37.3%) | 92,401 (1,539.5%) |
| 2.0x to 2.9x | 756 (17.9%) | 3,353 (55.9%) |
| 3.0x to 3.9x | 553 (13.1%) | 1,354 (22.6%) |
| 4.0x or more | 1,267 (30.0%) | 561 (9.3%) |
| Total | 4,217 (100.0%) | 6,002 (100.0%) |
Real Estate Taxes by Mortgage Status in Allen Park
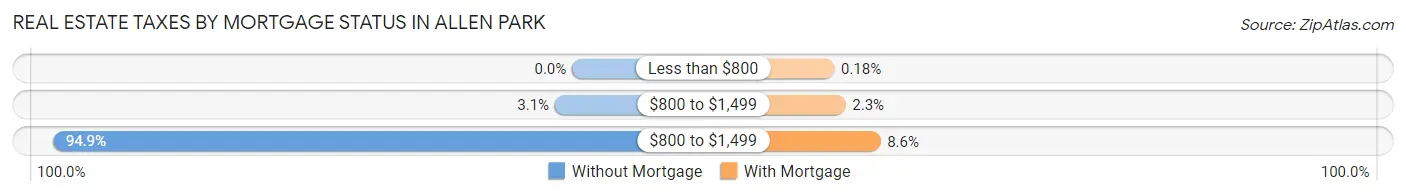
| Property Taxes | Without Mortgage | With Mortgage |
| Less than $800 | 0 (0.0%) | 11 (0.2%) |
| $800 to $1,499 | 132 (3.1%) | 135 (2.2%) |
| $800 to $1,499 | 4,000 (94.9%) | 517 (8.6%) |
| Total | 4,217 (100.0%) | 6,002 (100.0%) |
Health & Disability in Allen Park
Health Insurance Coverage by Age in Allen Park
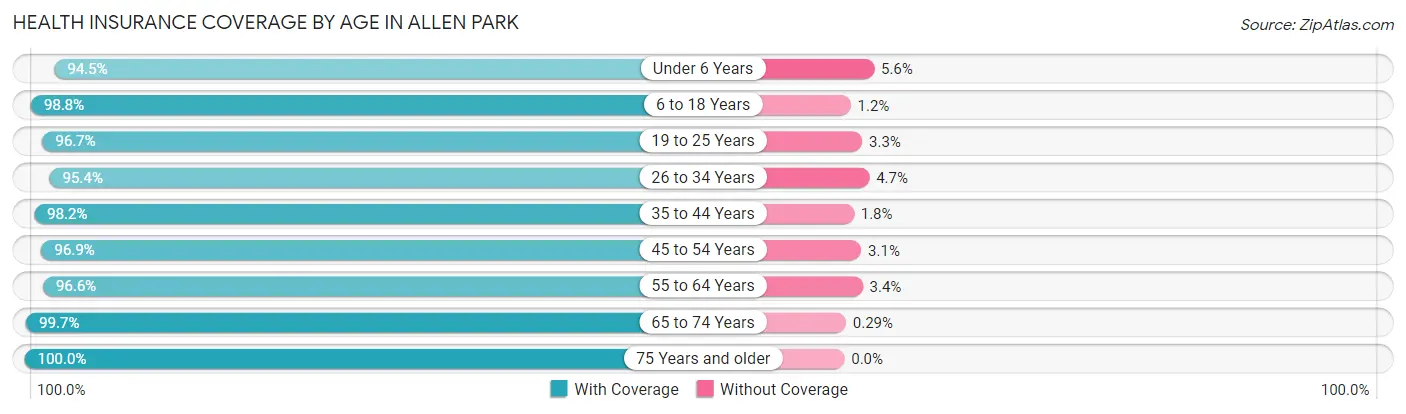
| Age Bracket | With Coverage | Without Coverage |
| Under 6 Years | 1,633 (94.5%) | 96 (5.6%) |
| 6 to 18 Years | 4,102 (98.8%) | 49 (1.2%) |
| 19 to 25 Years | 1,980 (96.7%) | 68 (3.3%) |
| 26 to 34 Years | 3,362 (95.4%) | 164 (4.6%) |
| 35 to 44 Years | 3,392 (98.2%) | 61 (1.8%) |
| 45 to 54 Years | 4,006 (96.9%) | 130 (3.1%) |
| 55 to 64 Years | 4,184 (96.6%) | 148 (3.4%) |
| 65 to 74 Years | 2,749 (99.7%) | 8 (0.3%) |
| 75 Years and older | 2,138 (100.0%) | 0 (0.0%) |
| Total | 27,546 (97.4%) | 724 (2.6%) |
Health Insurance Coverage by Citizenship Status in Allen Park
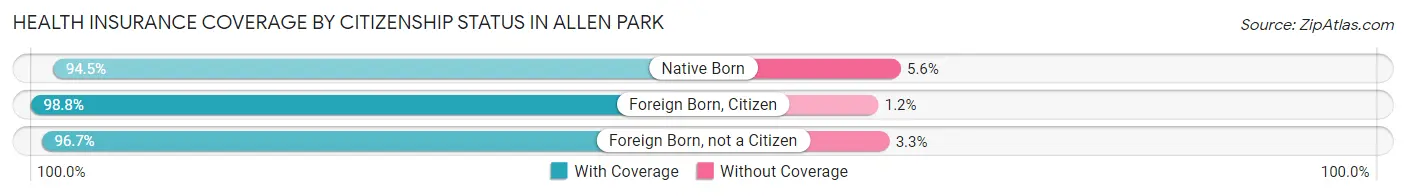
| Citizenship Status | With Coverage | Without Coverage |
| Native Born | 1,633 (94.5%) | 96 (5.6%) |
| Foreign Born, Citizen | 4,102 (98.8%) | 49 (1.2%) |
| Foreign Born, not a Citizen | 1,980 (96.7%) | 68 (3.3%) |
Health Insurance Coverage by Household Income in Allen Park
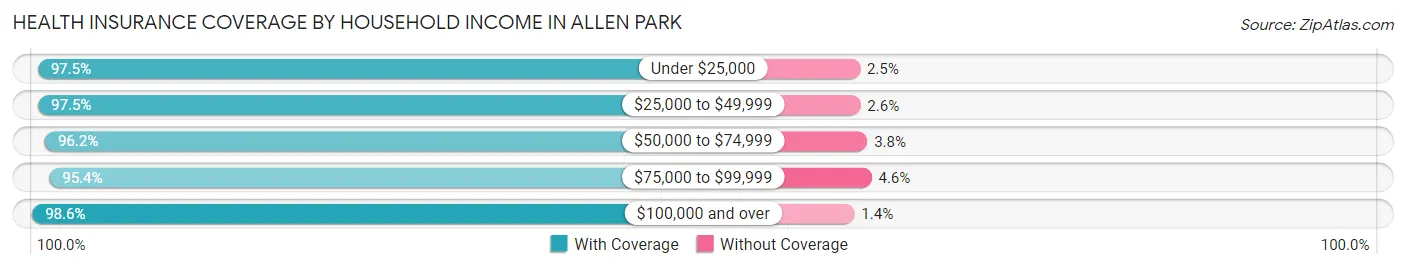
| Household Income | With Coverage | Without Coverage |
| Under $25,000 | 2,327 (97.5%) | 59 (2.5%) |
| $25,000 to $49,999 | 3,245 (97.5%) | 85 (2.5%) |
| $50,000 to $74,999 | 5,676 (96.2%) | 226 (3.8%) |
| $75,000 to $99,999 | 3,458 (95.4%) | 168 (4.6%) |
| $100,000 and over | 12,815 (98.6%) | 186 (1.4%) |
Public vs Private Health Insurance Coverage by Age in Allen Park
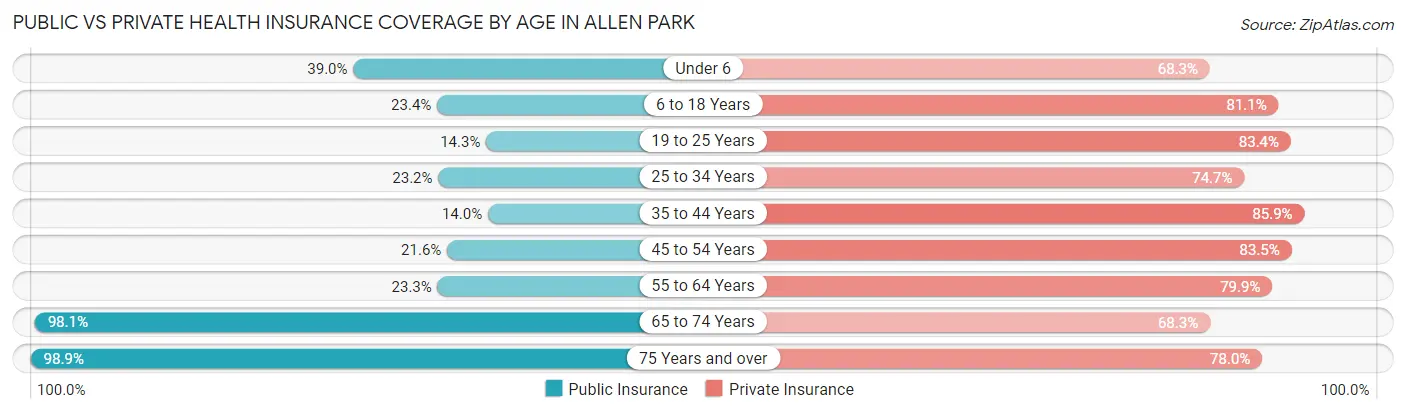
| Age Bracket | Public Insurance | Private Insurance |
| Under 6 | 674 (39.0%) | 1,181 (68.3%) |
| 6 to 18 Years | 972 (23.4%) | 3,365 (81.1%) |
| 19 to 25 Years | 293 (14.3%) | 1,707 (83.4%) |
| 25 to 34 Years | 818 (23.2%) | 2,634 (74.7%) |
| 35 to 44 Years | 483 (14.0%) | 2,965 (85.9%) |
| 45 to 54 Years | 892 (21.6%) | 3,453 (83.5%) |
| 55 to 64 Years | 1,011 (23.3%) | 3,461 (79.9%) |
| 65 to 74 Years | 2,705 (98.1%) | 1,884 (68.3%) |
| 75 Years and over | 2,114 (98.9%) | 1,668 (78.0%) |
| Total | 9,962 (35.2%) | 22,318 (78.9%) |
Disability Status by Sex by Age in Allen Park
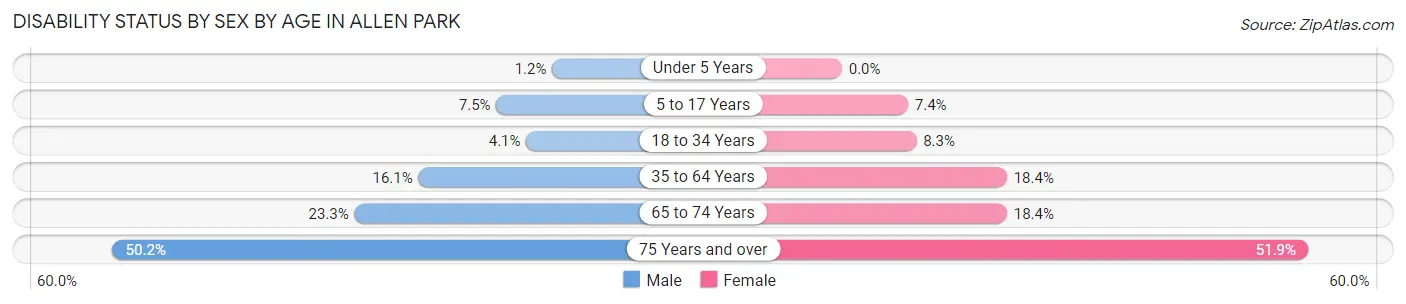
| Age Bracket | Male | Female |
| Under 5 Years | 8 (1.2%) | 0 (0.0%) |
| 5 to 17 Years | 147 (7.4%) | 170 (7.4%) |
| 18 to 34 Years | 114 (4.1%) | 254 (8.3%) |
| 35 to 64 Years | 963 (16.1%) | 1,093 (18.4%) |
| 65 to 74 Years | 283 (23.3%) | 283 (18.4%) |
| 75 Years and over | 398 (50.2%) | 698 (51.9%) |
Disability Class by Sex by Age in Allen Park
Disability Class: Hearing Difficulty
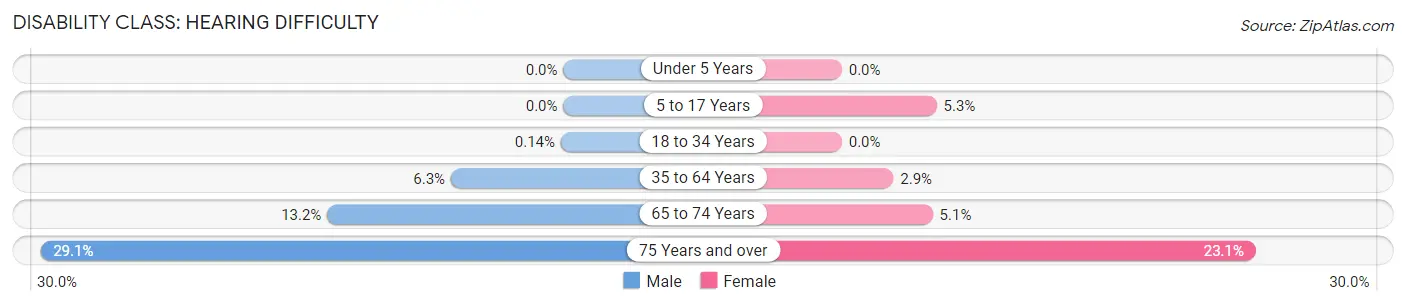
| Age Bracket | Male | Female |
| Under 5 Years | 0 (0.0%) | 0 (0.0%) |
| 5 to 17 Years | 0 (0.0%) | 122 (5.3%) |
| 18 to 34 Years | 4 (0.1%) | 0 (0.0%) |
| 35 to 64 Years | 374 (6.3%) | 171 (2.9%) |
| 65 to 74 Years | 160 (13.2%) | 78 (5.1%) |
| 75 Years and over | 231 (29.1%) | 310 (23.1%) |
Disability Class: Vision Difficulty
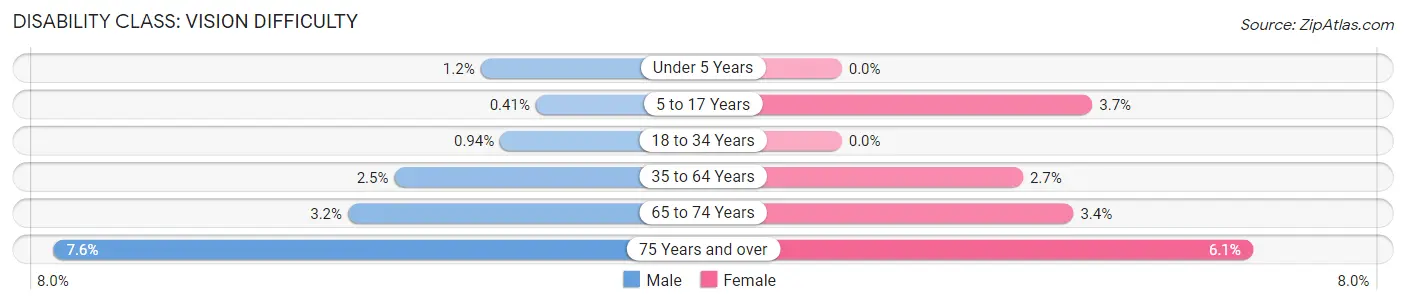
| Age Bracket | Male | Female |
| Under 5 Years | 8 (1.2%) | 0 (0.0%) |
| 5 to 17 Years | 8 (0.4%) | 86 (3.7%) |
| 18 to 34 Years | 26 (0.9%) | 0 (0.0%) |
| 35 to 64 Years | 150 (2.5%) | 160 (2.7%) |
| 65 to 74 Years | 39 (3.2%) | 53 (3.4%) |
| 75 Years and over | 60 (7.6%) | 82 (6.1%) |
Disability Class: Cognitive Difficulty
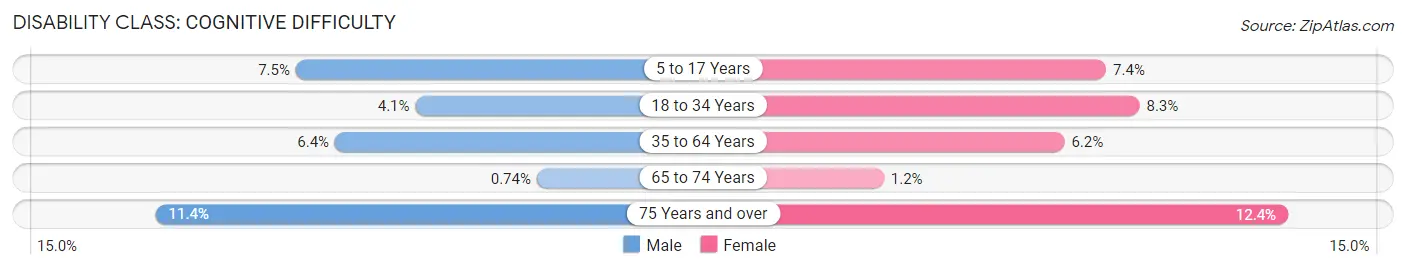
| Age Bracket | Male | Female |
| 5 to 17 Years | 147 (7.4%) | 170 (7.4%) |
| 18 to 34 Years | 114 (4.1%) | 254 (8.3%) |
| 35 to 64 Years | 380 (6.4%) | 369 (6.2%) |
| 65 to 74 Years | 9 (0.7%) | 18 (1.2%) |
| 75 Years and over | 90 (11.4%) | 167 (12.4%) |
Disability Class: Ambulatory Difficulty
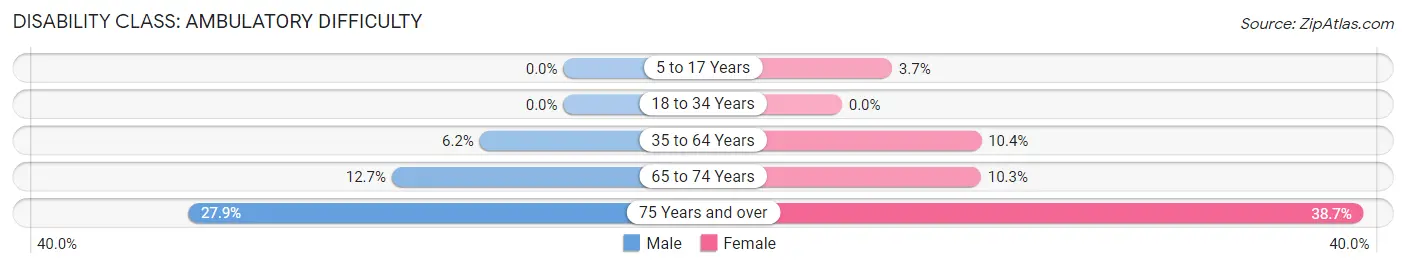
| Age Bracket | Male | Female |
| 5 to 17 Years | 0 (0.0%) | 86 (3.7%) |
| 18 to 34 Years | 0 (0.0%) | 0 (0.0%) |
| 35 to 64 Years | 371 (6.2%) | 616 (10.3%) |
| 65 to 74 Years | 155 (12.7%) | 159 (10.3%) |
| 75 Years and over | 221 (27.9%) | 521 (38.7%) |
Disability Class: Self-Care Difficulty
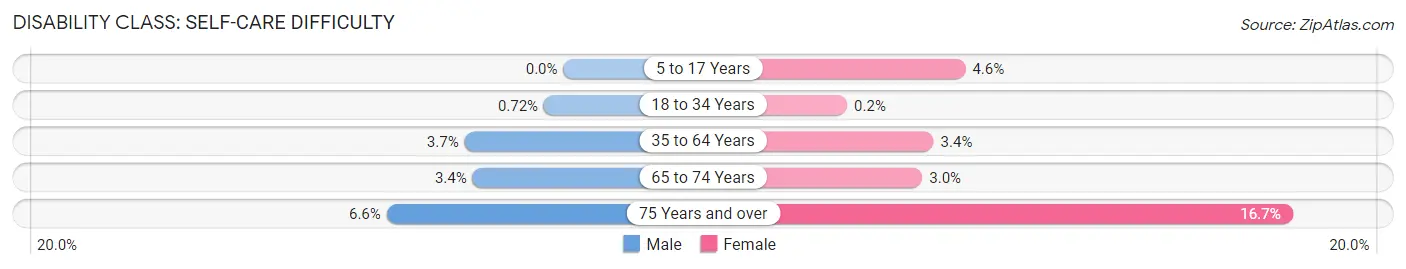
| Age Bracket | Male | Female |
| 5 to 17 Years | 0 (0.0%) | 106 (4.6%) |
| 18 to 34 Years | 20 (0.7%) | 6 (0.2%) |
| 35 to 64 Years | 219 (3.7%) | 203 (3.4%) |
| 65 to 74 Years | 41 (3.4%) | 46 (3.0%) |
| 75 Years and over | 52 (6.6%) | 225 (16.7%) |
Technology Access in Allen Park
Computing Device Access in Allen Park
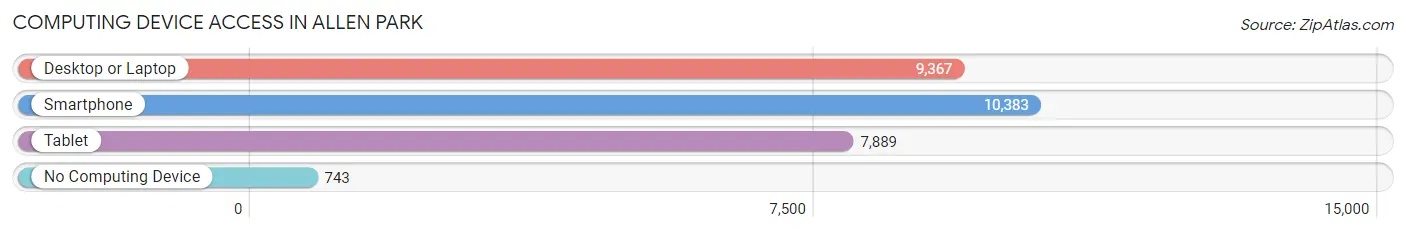
| Device Type | # Households | % Households |
| Desktop or Laptop | 9,367 | 79.0% |
| Smartphone | 10,383 | 87.6% |
| Tablet | 7,889 | 66.5% |
| No Computing Device | 743 | 6.3% |
| Total | 11,854 | 100.0% |
Internet Access in Allen Park
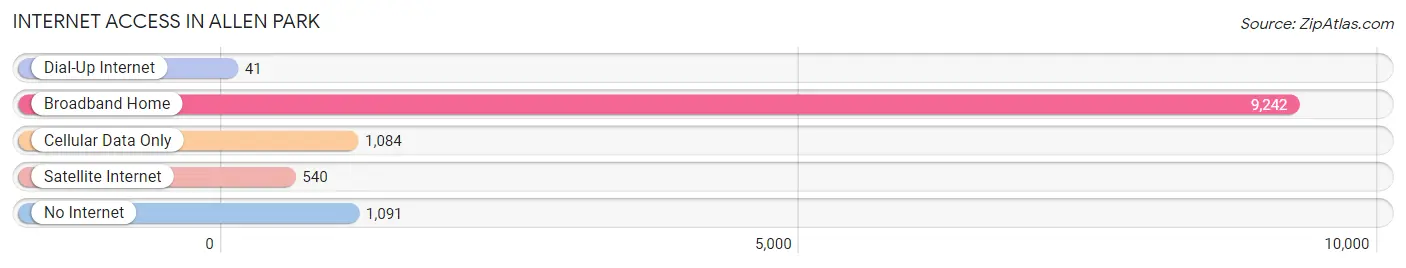
| Internet Type | # Households | % Households |
| Dial-Up Internet | 41 | 0.4% |
| Broadband Home | 9,242 | 78.0% |
| Cellular Data Only | 1,084 | 9.1% |
| Satellite Internet | 540 | 4.6% |
| No Internet | 1,091 | 9.2% |
| Total | 11,854 | 100.0% |
Allen Park Summary
Introduction
Allen Park is a city located in Wayne County, Michigan, United States. It is a suburb of Detroit and is part of the Downriver area. The city is known for its small-town charm and its close proximity to the city of Detroit. The population of Allen Park was 28,210 at the 2010 census.
History
The area that is now Allen Park was first settled in the early 1800s by farmers from New York and New England. The area was originally known as "Rougeville" and was part of Ecorse Township. In 1854, the area was renamed "Allen Park" after the Allen family, who were early settlers in the area.
In the late 1800s, the area began to develop as a residential suburb of Detroit. The first post office was established in 1891 and the first school was built in 1895. The city was officially incorporated in 1927.
Geography
Allen Park is located in southeastern Michigan, about 15 miles south of Detroit. It is bordered by Dearborn to the north, Lincoln Park to the east, Southgate to the south, and Melvindale to the west. The city covers an area of 4.7 square miles and has a population density of 5,945 people per square mile.
The city is situated on the banks of the Ecorse River, which flows through the city and into the Detroit River. The city is also home to several parks, including Allen Park Community Park, which features a playground, picnic area, and walking trails.
Economy
The economy of Allen Park is largely based on manufacturing and retail. The city is home to several large manufacturing companies, including Ford Motor Company, which has a large assembly plant in the city. Other major employers in the city include the City of Allen Park, the Allen Park Public Schools, and the Allen Park Community Center.
Retail is also an important part of the city's economy. The city is home to several shopping centers, including the Allen Park Shopping Center, which features a variety of stores and restaurants.
Demographics
As of the 2010 census, the population of Allen Park was 28,210. The racial makeup of the city was 87.3% White, 8.2% African American, 0.5% Native American, 1.2% Asian, 0.1% Pacific Islander, and 2.7% from other races. Hispanic or Latino of any race were 4.3% of the population.
The median household income in Allen Park was $45,945 in 2010. The per capita income was $21,945. About 11.3% of the population was below the poverty line.
Conclusion
Allen Park is a city located in Wayne County, Michigan, United States. It is a suburb of Detroit and is part of the Downriver area. The city is known for its small-town charm and its close proximity to the city of Detroit. The population of Allen Park was 28,210 at the 2010 census. The economy of Allen Park is largely based on manufacturing and retail. The city is home to several large manufacturing companies, including Ford Motor Company, and several shopping centers. The racial makeup of the city was 87.3% White, 8.2% African American, 0.5% Native American, 1.2% Asian, 0.1% Pacific Islander, and 2.7% from other races. The median household income in Allen Park was $45,945 in 2010. Allen Park is a vibrant city with a rich history and a bright future.
Common Questions
What is Per Capita Income in Allen Park?
Per Capita income in Allen Park is $39,032.
What is the Median Family Income in Allen Park?
Median Family Income in Allen Park is $97,118.
What is the Median Household income in Allen Park?
Median Household Income in Allen Park is $73,792.
What is Income or Wage Gap in Allen Park?
Income or Wage Gap in Allen Park is 24.2%.
Women in Allen Park earn 75.8 cents for every dollar earned by a man.
What is Inequality or Gini Index in Allen Park?
Inequality or Gini Index in Allen Park is 0.40.
What is the Total Population of Allen Park?
Total Population of Allen Park is 28,395.
What is the Total Male Population of Allen Park?
Total Male Population of Allen Park is 13,427.
What is the Total Female Population of Allen Park?
Total Female Population of Allen Park is 14,968.
What is the Ratio of Males per 100 Females in Allen Park?
There are 89.70 Males per 100 Females in Allen Park.
What is the Ratio of Females per 100 Males in Allen Park?
There are 111.48 Females per 100 Males in Allen Park.
What is the Median Population Age in Allen Park?
Median Population Age in Allen Park is 43.5 Years.
What is the Average Family Size in Allen Park
Average Family Size in Allen Park is 3.0 People.
What is the Average Household Size in Allen Park
Average Household Size in Allen Park is 2.4 People.
How Large is the Labor Force in Allen Park?
There are 14,858 People in the Labor Forcein in Allen Park.
What is the Percentage of People in the Labor Force in Allen Park?
63.3% of People are in the Labor Force in Allen Park.
What is the Unemployment Rate in Allen Park?
Unemployment Rate in Allen Park is 6.0%.