Almont, MI Map & Demographics
Almont Map
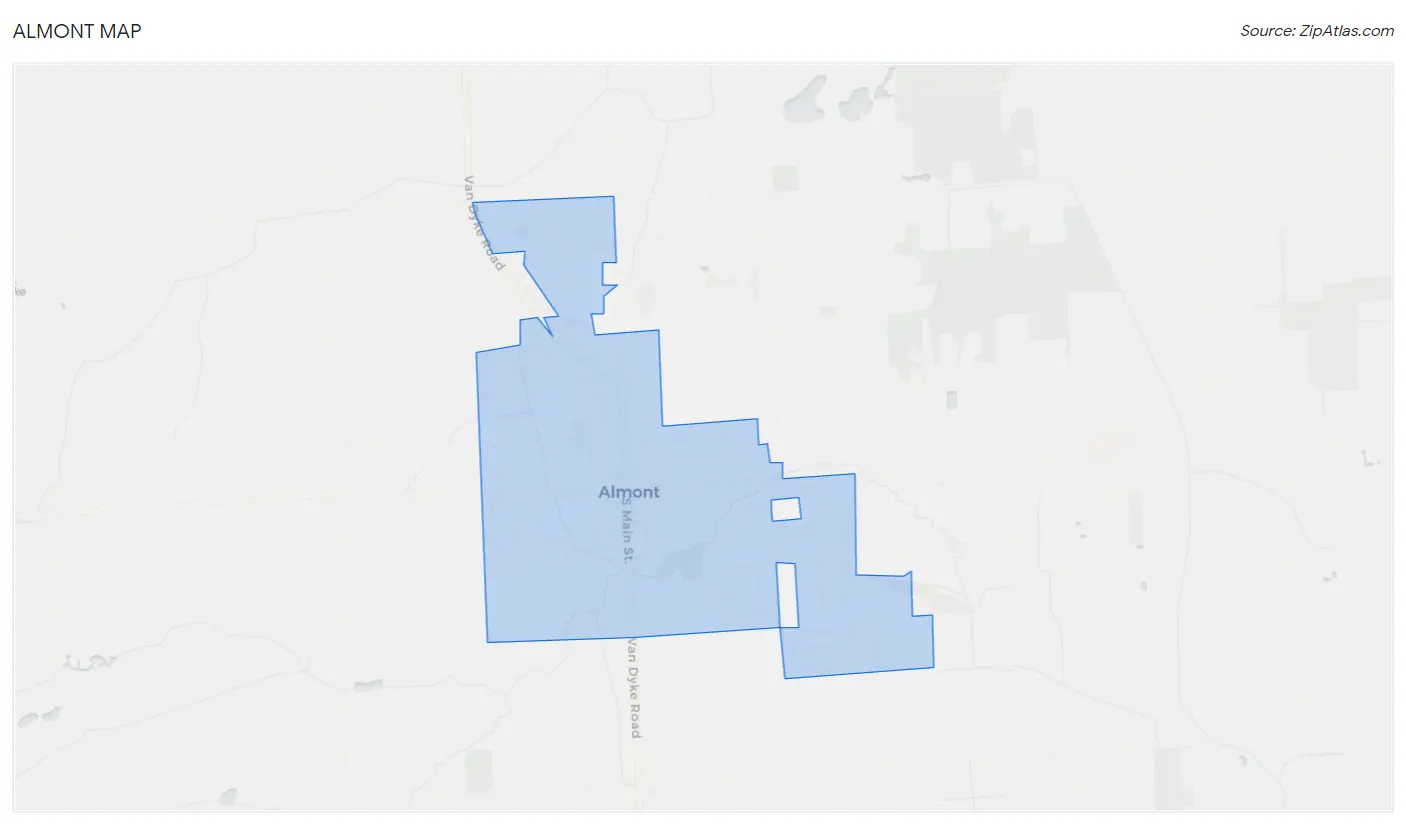
Almont Overview
$34,857
PER CAPITA INCOME
$84,856
AVG FAMILY INCOME
$76,607
AVG HOUSEHOLD INCOME
46.5%
WAGE / INCOME GAP [ % ]
53.5¢/ $1
WAGE / INCOME GAP [ $ ]
0.39
INEQUALITY / GINI INDEX
2,826
TOTAL POPULATION
1,419
MALE POPULATION
1,407
FEMALE POPULATION
100.85
MALES / 100 FEMALES
99.15
FEMALES / 100 MALES
42.6
MEDIAN AGE
2.9
AVG FAMILY SIZE
2.4
AVG HOUSEHOLD SIZE
1,576
LABOR FORCE [ PEOPLE ]
66.3%
PERCENT IN LABOR FORCE
8.6%
UNEMPLOYMENT RATE
Almont Zip Codes
Almont Area Codes
Income in Almont
Income Overview in Almont
Per Capita Income in Almont is $34,857, while median incomes of families and households are $84,856 and $76,607 respectively.
| Characteristic | Number | Measure |
| Per Capita Income | 2,826 | $34,857 |
| Median Family Income | 827 | $84,856 |
| Mean Family Income | 827 | $96,311 |
| Median Household Income | 1,157 | $76,607 |
| Mean Household Income | 1,157 | $83,106 |
| Income Deficit | 827 | $0 |
| Wage / Income Gap (%) | 2,826 | 46.46% |
| Wage / Income Gap ($) | 2,826 | 53.54¢ per $1 |
| Gini / Inequality Index | 2,826 | 0.39 |
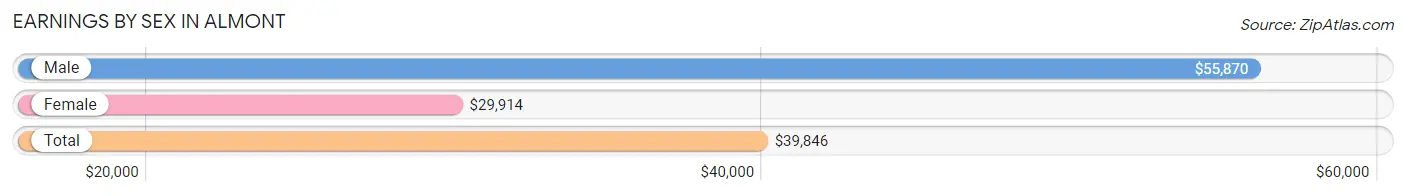
Earnings by Sex in Almont
Average Earnings in Almont are $39,846, $55,870 for men and $29,914 for women, a difference of 46.5%.
| Sex | Number | Average Earnings |
| Male | 908 (57.5%) | $55,870 |
| Female | 670 (42.5%) | $29,914 |
| Total | 1,578 (100.0%) | $39,846 |
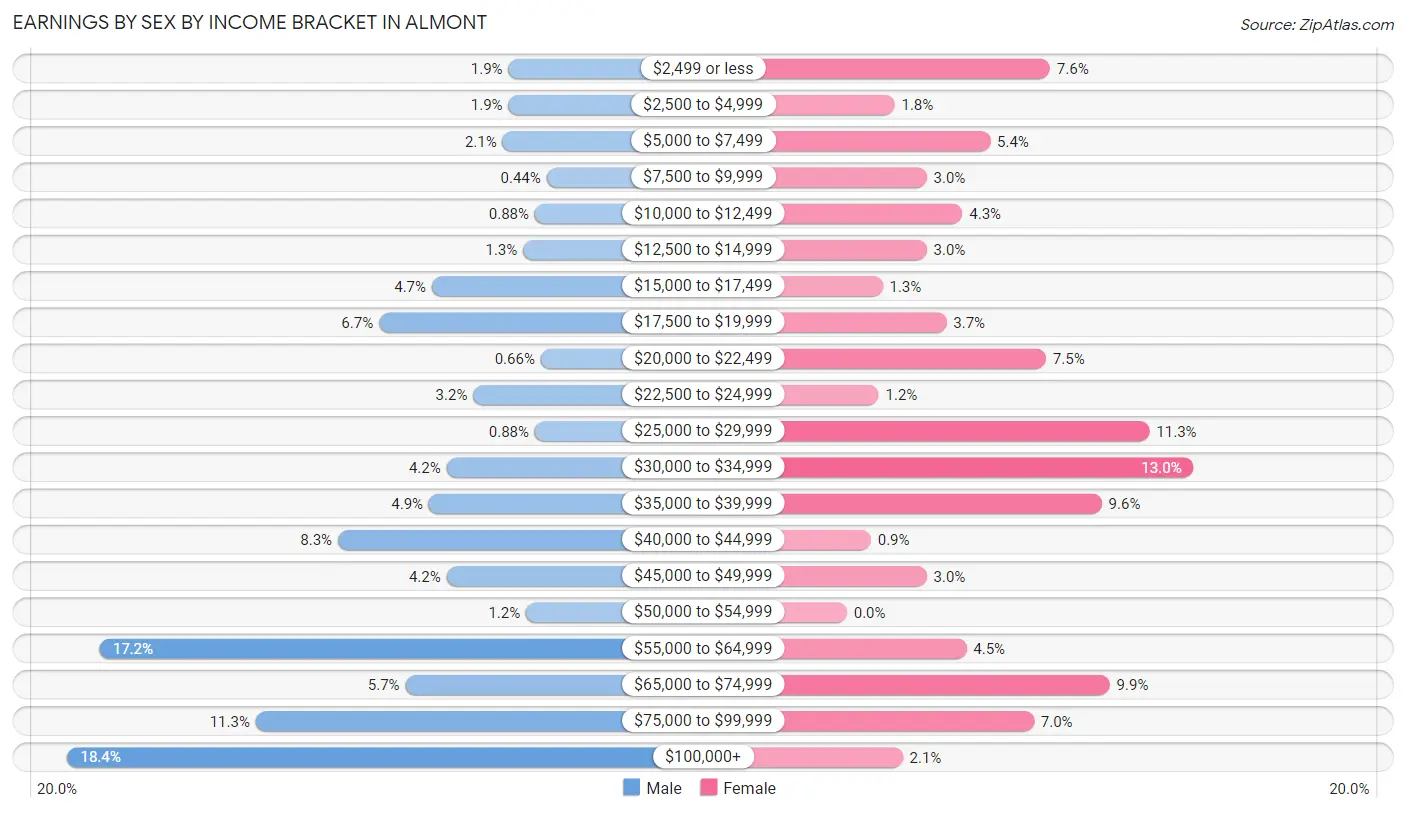
Earnings by Sex by Income Bracket in Almont
The most common earnings brackets in Almont are $100,000+ for men (167 | 18.4%) and $30,000 to $34,999 for women (87 | 13.0%).
| Income | Male | Female |
| $2,499 or less | 17 (1.9%) | 51 (7.6%) |
| $2,500 to $4,999 | 17 (1.9%) | 12 (1.8%) |
| $5,000 to $7,499 | 19 (2.1%) | 36 (5.4%) |
| $7,500 to $9,999 | 4 (0.4%) | 20 (3.0%) |
| $10,000 to $12,499 | 8 (0.9%) | 29 (4.3%) |
| $12,500 to $14,999 | 12 (1.3%) | 20 (3.0%) |
| $15,000 to $17,499 | 43 (4.7%) | 9 (1.3%) |
| $17,500 to $19,999 | 61 (6.7%) | 25 (3.7%) |
| $20,000 to $22,499 | 6 (0.7%) | 50 (7.5%) |
| $22,500 to $24,999 | 29 (3.2%) | 8 (1.2%) |
| $25,000 to $29,999 | 8 (0.9%) | 76 (11.3%) |
| $30,000 to $34,999 | 38 (4.2%) | 87 (13.0%) |
| $35,000 to $39,999 | 44 (4.9%) | 64 (9.6%) |
| $40,000 to $44,999 | 75 (8.3%) | 6 (0.9%) |
| $45,000 to $49,999 | 38 (4.2%) | 20 (3.0%) |
| $50,000 to $54,999 | 11 (1.2%) | 0 (0.0%) |
| $55,000 to $64,999 | 156 (17.2%) | 30 (4.5%) |
| $65,000 to $74,999 | 52 (5.7%) | 66 (9.9%) |
| $75,000 to $99,999 | 103 (11.3%) | 47 (7.0%) |
| $100,000+ | 167 (18.4%) | 14 (2.1%) |
| Total | 908 (100.0%) | 670 (100.0%) |
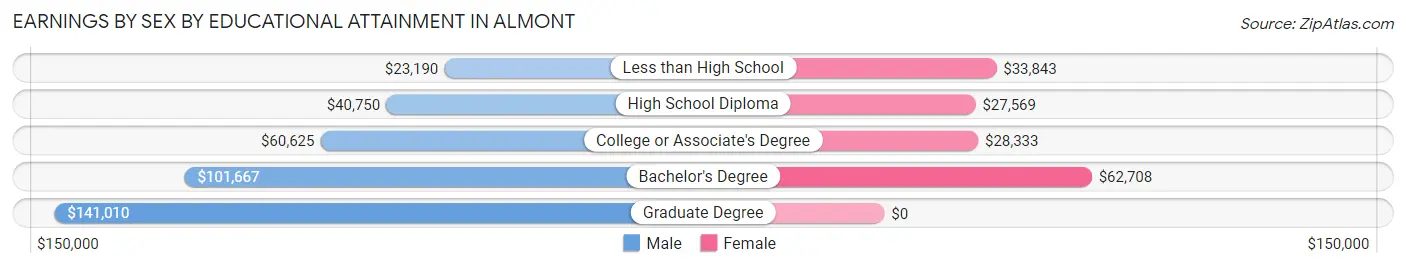
Earnings by Sex by Educational Attainment in Almont
Average earnings in Almont are $58,125 for men and $32,313 for women, a difference of 44.4%. Men with an educational attainment of graduate degree enjoy the highest average annual earnings of $141,010, while those with less than high school education earn the least with $23,190. Women with an educational attainment of bachelor's degree earn the most with the average annual earnings of $62,708, while those with high school diploma education have the smallest earnings of $27,569.
| Educational Attainment | Male Income | Female Income |
| Less than High School | $23,190 | $33,843 |
| High School Diploma | $40,750 | $27,569 |
| College or Associate's Degree | $60,625 | $28,333 |
| Bachelor's Degree | $101,667 | $62,708 |
| Graduate Degree | $141,010 | $0 |
| Total | $58,125 | $32,313 |
Family Income in Almont
Family Income Brackets in Almont
According to the Almont family income data, there are 214 families falling into the $75,000 to $99,999 income range, which is the most common income bracket and makes up 25.9% of all families. Conversely, the $15,000 to $24,999 income bracket is the least frequent group with only 22 families (2.7%) belonging to this category.
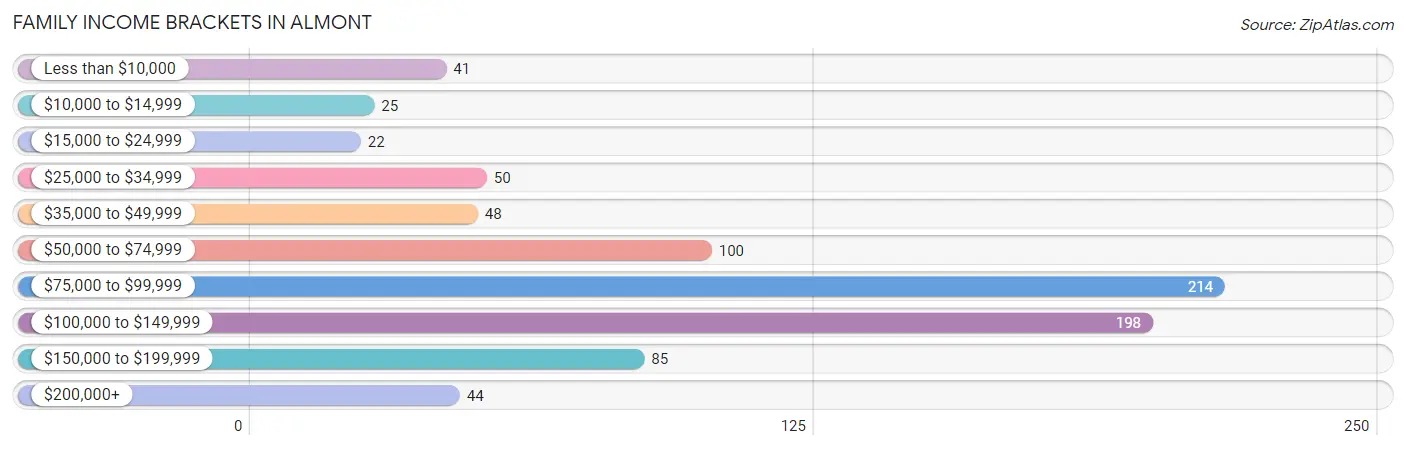
| Income Bracket | # Families | % Families |
| Less than $10,000 | 41 | 5.0% |
| $10,000 to $14,999 | 25 | 3.0% |
| $15,000 to $24,999 | 22 | 2.7% |
| $25,000 to $34,999 | 50 | 6.0% |
| $35,000 to $49,999 | 48 | 5.8% |
| $50,000 to $74,999 | 100 | 12.1% |
| $75,000 to $99,999 | 214 | 25.9% |
| $100,000 to $149,999 | 198 | 23.9% |
| $150,000 to $199,999 | 85 | 10.3% |
| $200,000+ | 44 | 5.3% |
Family Income by Famaliy Size in Almont
5-person families (96 | 11.6%) account for the highest median family income in Almont with $113,750 per family, while 2-person families (410 | 49.6%) have the highest median income of $39,695 per family member.
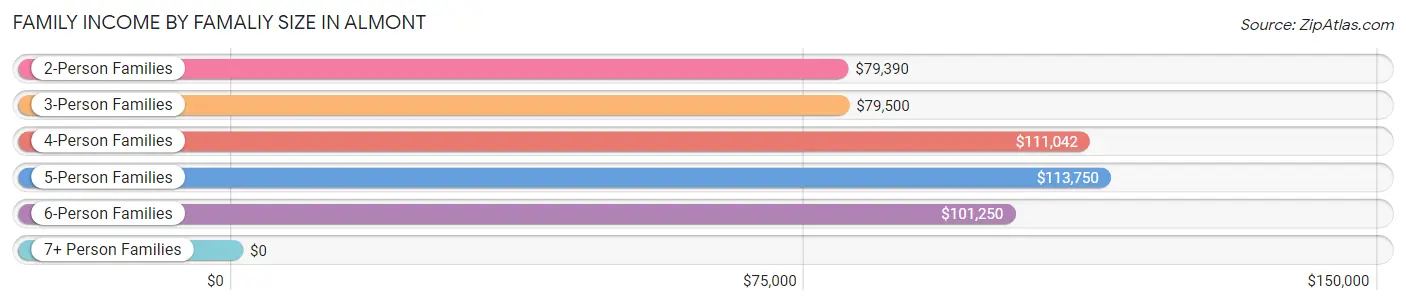
| Income Bracket | # Families | Median Income |
| 2-Person Families | 410 (49.6%) | $79,390 |
| 3-Person Families | 218 (26.4%) | $79,500 |
| 4-Person Families | 71 (8.6%) | $111,042 |
| 5-Person Families | 96 (11.6%) | $113,750 |
| 6-Person Families | 20 (2.4%) | $101,250 |
| 7+ Person Families | 12 (1.5%) | $0 |
| Total | 827 (100.0%) | $84,856 |
Family Income by Number of Earners in Almont
The median family income in Almont is $84,856, with families comprising 3+ earners (69) having the highest median family income of $172,813, while families with no earners (136) have the lowest median family income of $40,357, accounting for 8.3% and 16.4% of families, respectively.
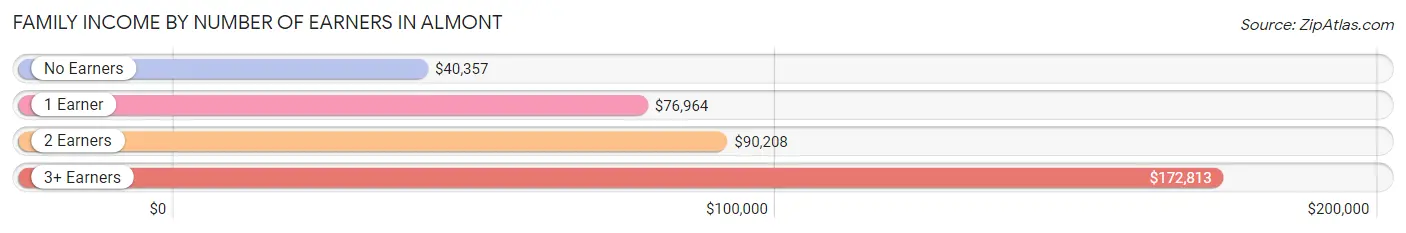
| Number of Earners | # Families | Median Income |
| No Earners | 136 (16.4%) | $40,357 |
| 1 Earner | 209 (25.3%) | $76,964 |
| 2 Earners | 413 (49.9%) | $90,208 |
| 3+ Earners | 69 (8.3%) | $172,813 |
| Total | 827 (100.0%) | $84,856 |
Household Income in Almont
Household Income Brackets in Almont
With 245 households falling in the category, the $75,000 to $99,999 income range is the most frequent in Almont, accounting for 21.2% of all households. In contrast, only 21 households (1.8%) fall into the $15,000 to $24,999 income bracket, making it the least populous group.
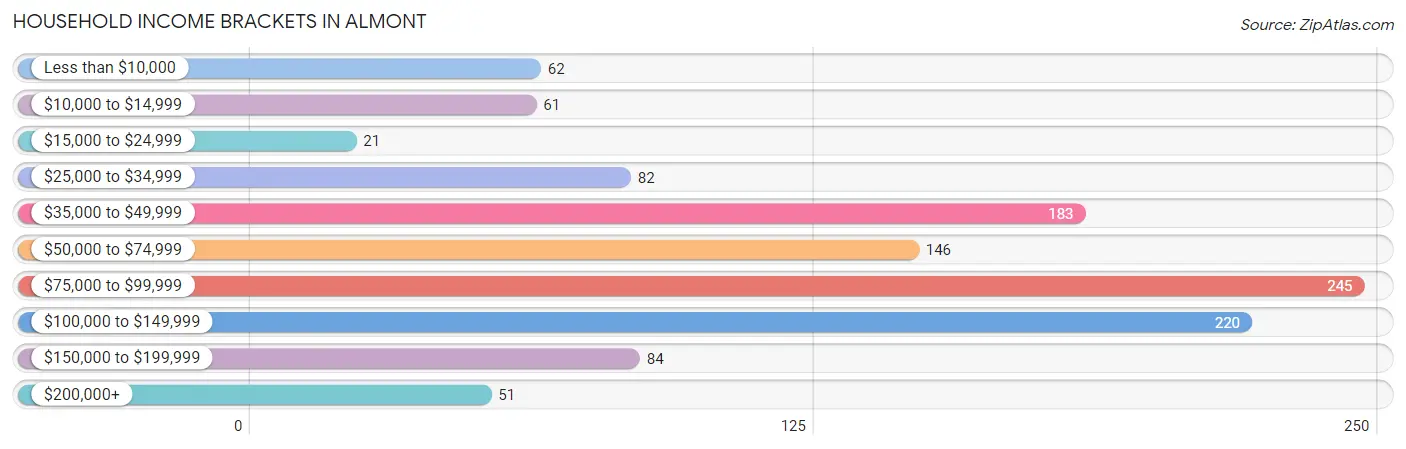
| Income Bracket | # Households | % Households |
| Less than $10,000 | 62 | 5.4% |
| $10,000 to $14,999 | 61 | 5.3% |
| $15,000 to $24,999 | 21 | 1.8% |
| $25,000 to $34,999 | 82 | 7.1% |
| $35,000 to $49,999 | 183 | 15.8% |
| $50,000 to $74,999 | 146 | 12.6% |
| $75,000 to $99,999 | 245 | 21.2% |
| $100,000 to $149,999 | 220 | 19.0% |
| $150,000 to $199,999 | 84 | 7.3% |
| $200,000+ | 51 | 4.4% |
Household Income by Householder Age in Almont
The median household income in Almont is $76,607, with the highest median household income of $85,000 found in the 45 to 64 years age bracket for the primary householder. A total of 486 households (42.0%) fall into this category. Meanwhile, the 15 to 24 years age bracket for the primary householder has the lowest median household income of $0, with 28 households (2.4%) in this group.
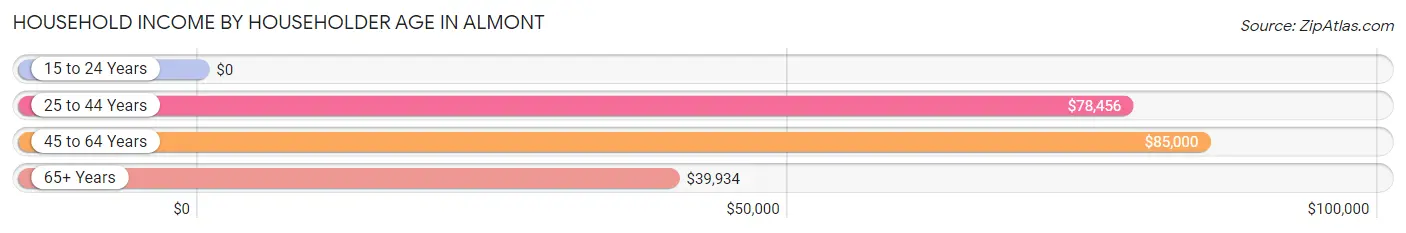
| Income Bracket | # Households | Median Income |
| 15 to 24 Years | 28 (2.4%) | $0 |
| 25 to 44 Years | 367 (31.7%) | $78,456 |
| 45 to 64 Years | 486 (42.0%) | $85,000 |
| 65+ Years | 276 (23.8%) | $39,934 |
| Total | 1,157 (100.0%) | $76,607 |
Poverty in Almont
Income Below Poverty by Sex and Age in Almont
With 10.8% poverty level for males and 13.4% for females among the residents of Almont, 5 year old males and 16 and 17 year old females are the most vulnerable to poverty, with 7 males (100.0%) and 26 females (48.1%) in their respective age groups living below the poverty level.
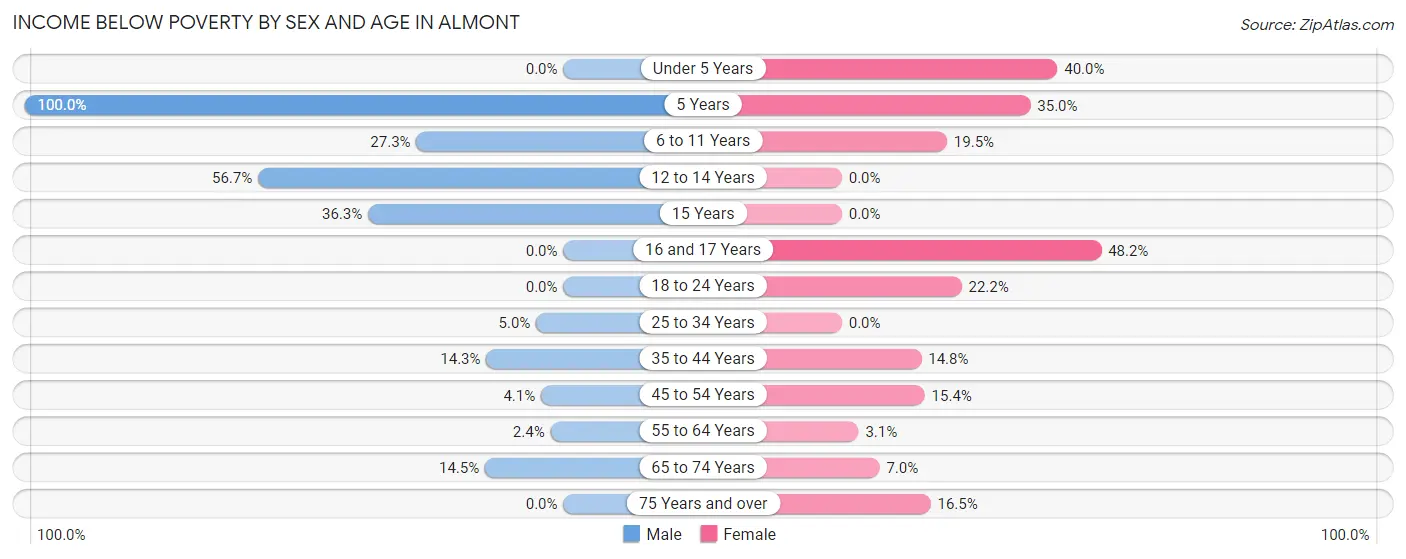
| Age Bracket | Male | Female |
| Under 5 Years | 0 (0.0%) | 14 (40.0%) |
| 5 Years | 7 (100.0%) | 7 (35.0%) |
| 6 to 11 Years | 30 (27.3%) | 16 (19.5%) |
| 12 to 14 Years | 17 (56.7%) | 0 (0.0%) |
| 15 Years | 29 (36.2%) | 0 (0.0%) |
| 16 and 17 Years | 0 (0.0%) | 26 (48.1%) |
| 18 to 24 Years | 0 (0.0%) | 26 (22.2%) |
| 25 to 34 Years | 13 (5.0%) | 0 (0.0%) |
| 35 to 44 Years | 28 (14.3%) | 32 (14.7%) |
| 45 to 54 Years | 6 (4.1%) | 32 (15.4%) |
| 55 to 64 Years | 6 (2.4%) | 7 (3.1%) |
| 65 to 74 Years | 17 (14.5%) | 14 (7.0%) |
| 75 Years and over | 0 (0.0%) | 14 (16.5%) |
| Total | 153 (10.8%) | 188 (13.4%) |
Income Above Poverty by Sex and Age in Almont
According to the poverty statistics in Almont, males aged under 5 years and females aged 12 to 14 years are the age groups that are most secure financially, with 100.0% of males and 100.0% of females in these age groups living above the poverty line.
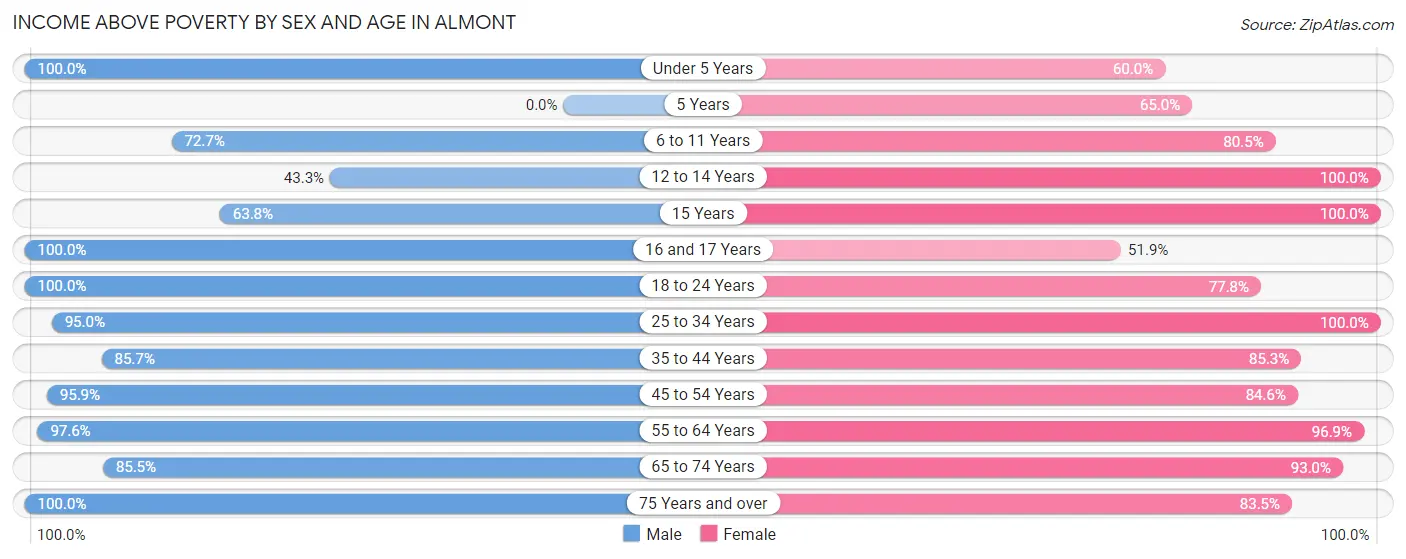
| Age Bracket | Male | Female |
| Under 5 Years | 33 (100.0%) | 21 (60.0%) |
| 5 Years | 0 (0.0%) | 13 (65.0%) |
| 6 to 11 Years | 80 (72.7%) | 66 (80.5%) |
| 12 to 14 Years | 13 (43.3%) | 40 (100.0%) |
| 15 Years | 51 (63.7%) | 12 (100.0%) |
| 16 and 17 Years | 21 (100.0%) | 28 (51.8%) |
| 18 to 24 Years | 124 (100.0%) | 91 (77.8%) |
| 25 to 34 Years | 245 (95.0%) | 111 (100.0%) |
| 35 to 44 Years | 168 (85.7%) | 185 (85.3%) |
| 45 to 54 Years | 139 (95.9%) | 176 (84.6%) |
| 55 to 64 Years | 245 (97.6%) | 219 (96.9%) |
| 65 to 74 Years | 100 (85.5%) | 186 (93.0%) |
| 75 Years and over | 47 (100.0%) | 71 (83.5%) |
| Total | 1,266 (89.2%) | 1,219 (86.6%) |
Income Below Poverty Among Married-Couple Families in Almont
The poverty statistics for married-couple families in Almont show that 1.9% or 13 of the total 674 families live below the poverty line. Families with 3 or 4 children have the highest poverty rate of 20.0%, comprising of 7 families. On the other hand, families with 1 or 2 children have the lowest poverty rate of 0.0%, which includes 0 families.
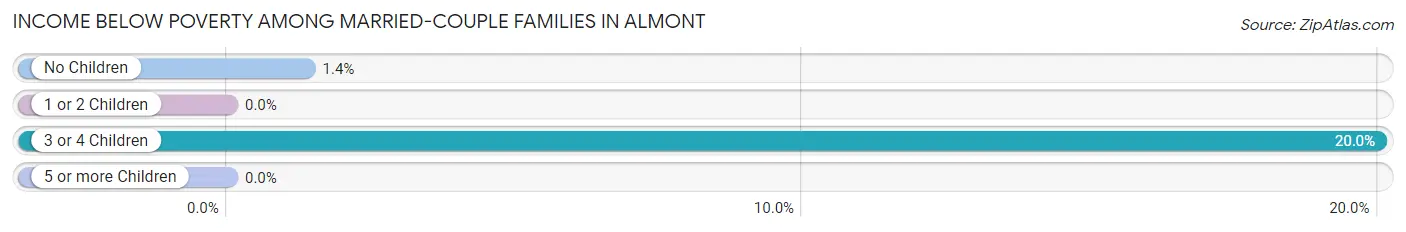
| Children | Above Poverty | Below Poverty |
| No Children | 440 (98.7%) | 6 (1.3%) |
| 1 or 2 Children | 181 (100.0%) | 0 (0.0%) |
| 3 or 4 Children | 28 (80.0%) | 7 (20.0%) |
| 5 or more Children | 12 (100.0%) | 0 (0.0%) |
| Total | 661 (98.1%) | 13 (1.9%) |
Income Below Poverty Among Single-Parent Households in Almont
According to the poverty data in Almont, 47.8% or 22 single-father households and 56.1% or 60 single-mother households are living below the poverty line. Among single-father households, those with 1 or 2 children have the highest poverty rate, with 22 households (53.7%) experiencing poverty. Likewise, among single-mother households, those with 3 or 4 children have the highest poverty rate, with 19 households (100.0%) falling below the poverty line.
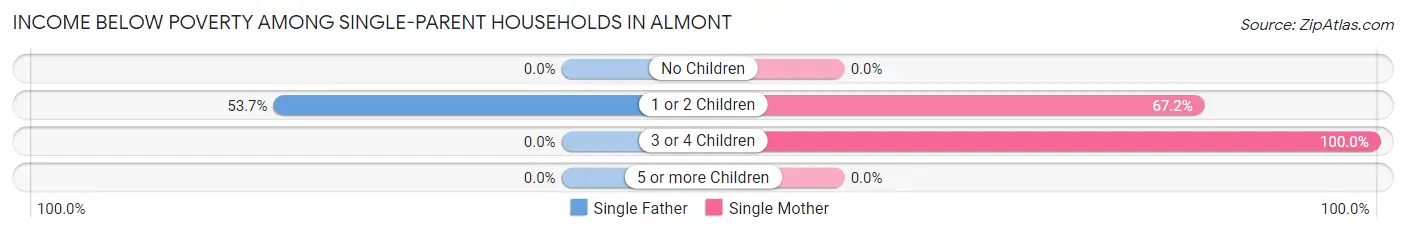
| Children | Single Father | Single Mother |
| No Children | 0 (0.0%) | 0 (0.0%) |
| 1 or 2 Children | 22 (53.7%) | 41 (67.2%) |
| 3 or 4 Children | 0 (0.0%) | 19 (100.0%) |
| 5 or more Children | 0 (0.0%) | 0 (0.0%) |
| Total | 22 (47.8%) | 60 (56.1%) |
Income Below Poverty Among Married-Couple vs Single-Parent Households in Almont
The poverty data for Almont shows that 13 of the married-couple family households (1.9%) and 82 of the single-parent households (53.6%) are living below the poverty level. Within the married-couple family households, those with 3 or 4 children have the highest poverty rate, with 7 households (20.0%) falling below the poverty line. Among the single-parent households, those with 3 or 4 children have the highest poverty rate, with 19 household (100.0%) living below poverty.
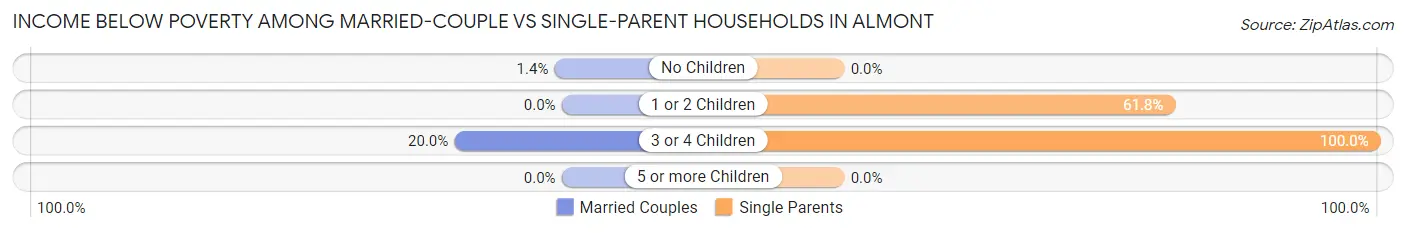
| Children | Married-Couple Families | Single-Parent Households |
| No Children | 6 (1.3%) | 0 (0.0%) |
| 1 or 2 Children | 0 (0.0%) | 63 (61.8%) |
| 3 or 4 Children | 7 (20.0%) | 19 (100.0%) |
| 5 or more Children | 0 (0.0%) | 0 (0.0%) |
| Total | 13 (1.9%) | 82 (53.6%) |
Race in Almont
The most populous races in Almont are White / Caucasian (2,522 | 89.2%), Hispanic or Latino (197 | 7.0%), and Some other Race (95 | 3.4%).
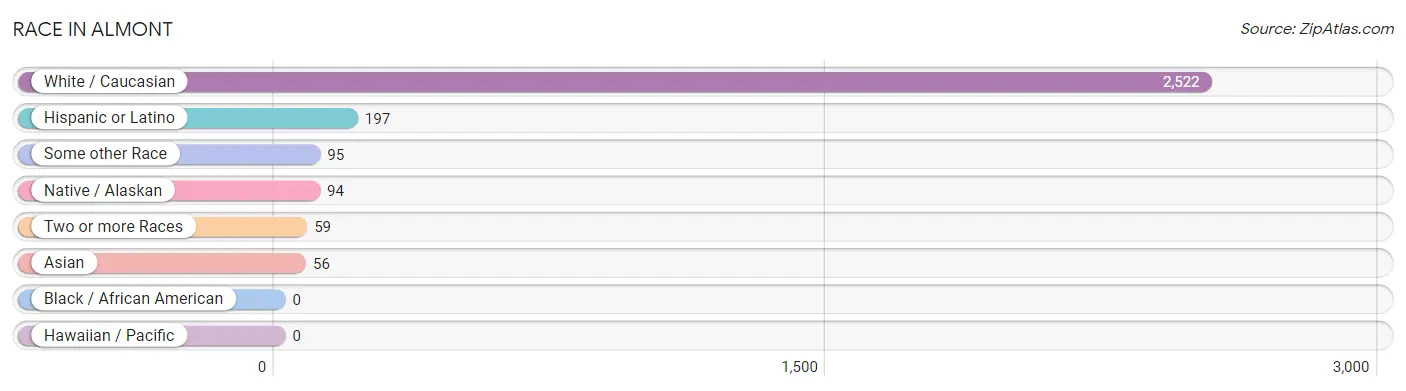
| Race | # Population | % Population |
| Asian | 56 | 2.0% |
| Black / African American | 0 | 0.0% |
| Hawaiian / Pacific | 0 | 0.0% |
| Hispanic or Latino | 197 | 7.0% |
| Native / Alaskan | 94 | 3.3% |
| White / Caucasian | 2,522 | 89.2% |
| Two or more Races | 59 | 2.1% |
| Some other Race | 95 | 3.4% |
| Total | 2,826 | 100.0% |
Ancestry in Almont
The most populous ancestries reported in Almont are German (504 | 17.8%), Polish (427 | 15.1%), English (294 | 10.4%), Irish (259 | 9.2%), and European (190 | 6.7%), together accounting for 59.2% of all Almont residents.
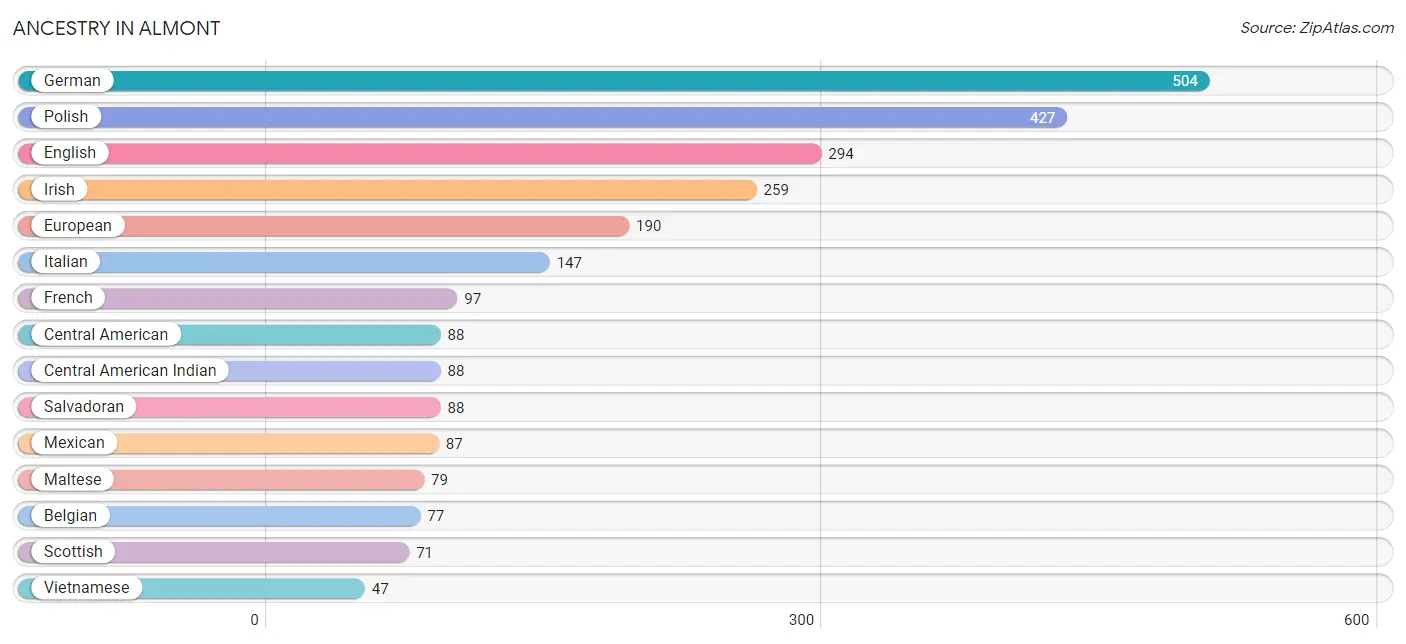
| Ancestry | # Population | % Population |
| American | 26 | 0.9% |
| Arab | 46 | 1.6% |
| Belgian | 77 | 2.7% |
| British | 14 | 0.5% |
| Canadian | 40 | 1.4% |
| Central American | 88 | 3.1% |
| Central American Indian | 88 | 3.1% |
| Cherokee | 2 | 0.1% |
| Chippewa | 6 | 0.2% |
| Croatian | 3 | 0.1% |
| Czech | 35 | 1.2% |
| Czechoslovakian | 19 | 0.7% |
| Danish | 6 | 0.2% |
| Dutch | 15 | 0.5% |
| Eastern European | 8 | 0.3% |
| English | 294 | 10.4% |
| European | 190 | 6.7% |
| Finnish | 3 | 0.1% |
| French | 97 | 3.4% |
| French Canadian | 40 | 1.4% |
| German | 504 | 17.8% |
| Hungarian | 17 | 0.6% |
| Irish | 259 | 9.2% |
| Italian | 147 | 5.2% |
| Korean | 9 | 0.3% |
| Lebanese | 18 | 0.6% |
| Maltese | 79 | 2.8% |
| Mexican | 87 | 3.1% |
| New Zealander | 8 | 0.3% |
| Polish | 427 | 15.1% |
| Puerto Rican | 22 | 0.8% |
| Romanian | 13 | 0.5% |
| Russian | 13 | 0.5% |
| Salvadoran | 88 | 3.1% |
| Scotch-Irish | 15 | 0.5% |
| Scottish | 71 | 2.5% |
| Serbian | 3 | 0.1% |
| Swiss | 11 | 0.4% |
| Ukrainian | 4 | 0.1% |
| Vietnamese | 47 | 1.7% |
| Welsh | 15 | 0.5% |
| Yugoslavian | 25 | 0.9% | View All 42 Rows |
Immigrants in Almont
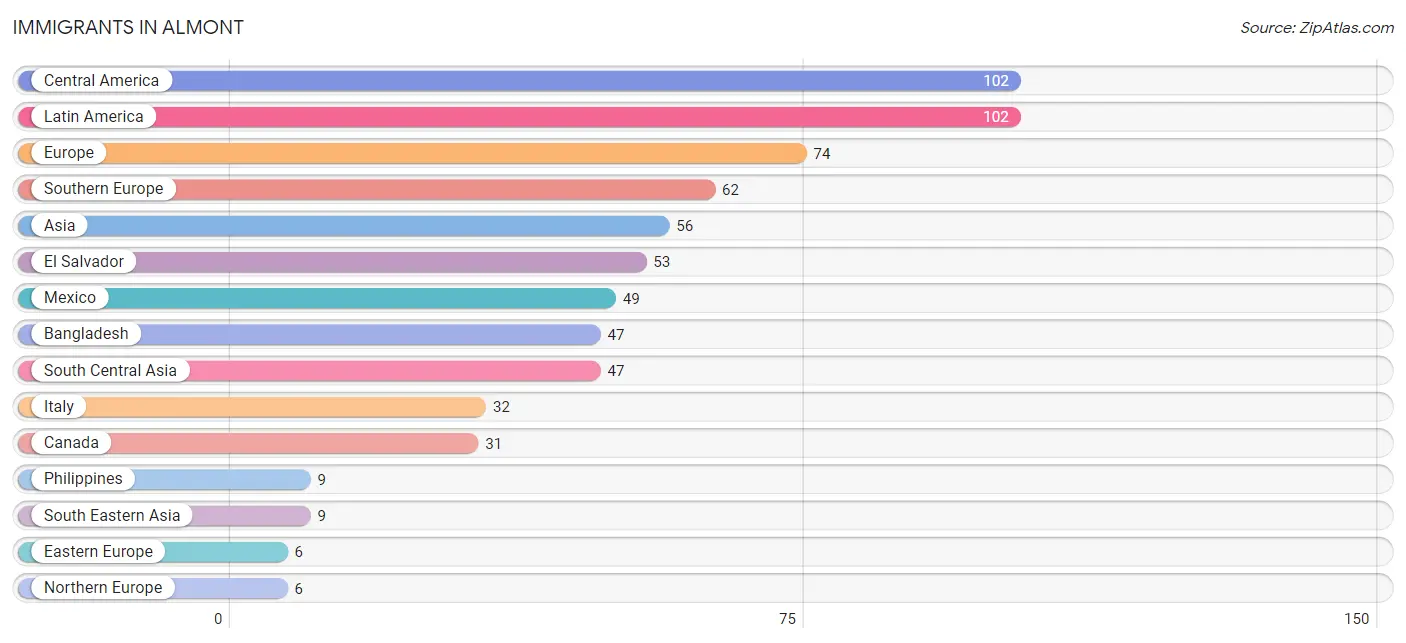
The most numerous immigrant groups reported in Almont came from Central America (102 | 3.6%), Latin America (102 | 3.6%), Europe (74 | 2.6%), Southern Europe (62 | 2.2%), and Asia (56 | 2.0%), together accounting for 14.0% of all Almont residents.
| Immigration Origin | # Population | % Population |
| Asia | 56 | 2.0% |
| Bangladesh | 47 | 1.7% |
| Canada | 31 | 1.1% |
| Central America | 102 | 3.6% |
| Eastern Europe | 6 | 0.2% |
| El Salvador | 53 | 1.9% |
| Europe | 74 | 2.6% |
| Italy | 32 | 1.1% |
| Latin America | 102 | 3.6% |
| Mexico | 49 | 1.7% |
| Northern Europe | 6 | 0.2% |
| Philippines | 9 | 0.3% |
| Poland | 6 | 0.2% |
| South Central Asia | 47 | 1.7% |
| South Eastern Asia | 9 | 0.3% |
| Southern Europe | 62 | 2.2% | View All 16 Rows |
Sex and Age in Almont
Sex and Age in Almont
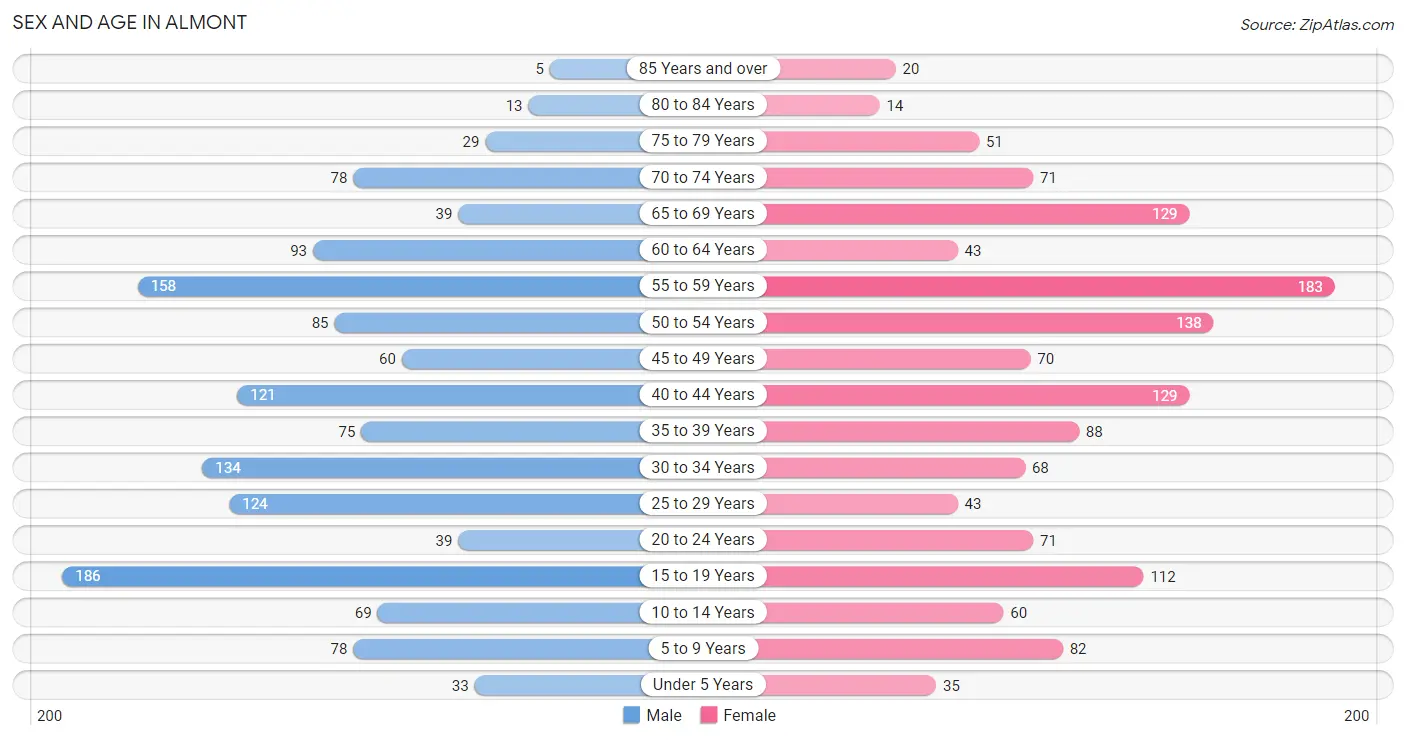
The most populous age groups in Almont are 15 to 19 Years (186 | 13.1%) for men and 55 to 59 Years (183 | 13.0%) for women.
| Age Bracket | Male | Female |
| Under 5 Years | 33 (2.3%) | 35 (2.5%) |
| 5 to 9 Years | 78 (5.5%) | 82 (5.8%) |
| 10 to 14 Years | 69 (4.9%) | 60 (4.3%) |
| 15 to 19 Years | 186 (13.1%) | 112 (8.0%) |
| 20 to 24 Years | 39 (2.8%) | 71 (5.1%) |
| 25 to 29 Years | 124 (8.7%) | 43 (3.1%) |
| 30 to 34 Years | 134 (9.4%) | 68 (4.8%) |
| 35 to 39 Years | 75 (5.3%) | 88 (6.2%) |
| 40 to 44 Years | 121 (8.5%) | 129 (9.2%) |
| 45 to 49 Years | 60 (4.2%) | 70 (5.0%) |
| 50 to 54 Years | 85 (6.0%) | 138 (9.8%) |
| 55 to 59 Years | 158 (11.1%) | 183 (13.0%) |
| 60 to 64 Years | 93 (6.6%) | 43 (3.1%) |
| 65 to 69 Years | 39 (2.8%) | 129 (9.2%) |
| 70 to 74 Years | 78 (5.5%) | 71 (5.1%) |
| 75 to 79 Years | 29 (2.0%) | 51 (3.6%) |
| 80 to 84 Years | 13 (0.9%) | 14 (1.0%) |
| 85 Years and over | 5 (0.4%) | 20 (1.4%) |
| Total | 1,419 (100.0%) | 1,407 (100.0%) |
Families and Households in Almont
Median Family Size in Almont
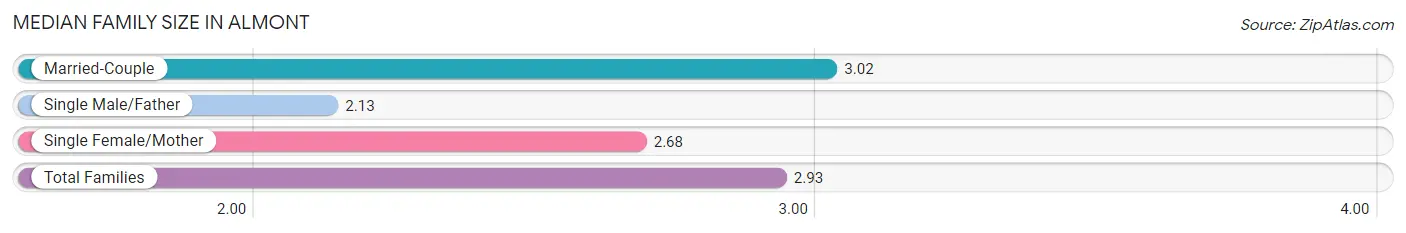
The median family size in Almont is 2.93 persons per family, with married-couple families (674 | 81.5%) accounting for the largest median family size of 3.02 persons per family. On the other hand, single male/father families (46 | 5.6%) represent the smallest median family size with 2.13 persons per family.
| Family Type | # Families | Family Size |
| Married-Couple | 674 (81.5%) | 3.02 |
| Single Male/Father | 46 (5.6%) | 2.13 |
| Single Female/Mother | 107 (12.9%) | 2.68 |
| Total Families | 827 (100.0%) | 2.93 |
Median Household Size in Almont
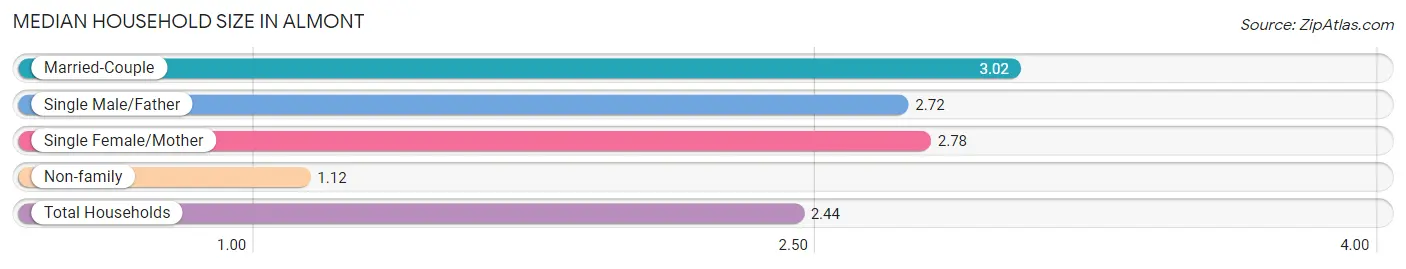
The median household size in Almont is 2.44 persons per household, with married-couple households (674 | 58.3%) accounting for the largest median household size of 3.02 persons per household. non-family households (330 | 28.5%) represent the smallest median household size with 1.12 persons per household.
| Household Type | # Households | Household Size |
| Married-Couple | 674 (58.3%) | 3.02 |
| Single Male/Father | 46 (4.0%) | 2.72 |
| Single Female/Mother | 107 (9.2%) | 2.78 |
| Non-family | 330 (28.5%) | 1.12 |
| Total Households | 1,157 (100.0%) | 2.44 |
Household Size by Marriage Status in Almont
Out of a total of 1,157 households in Almont, 827 (71.5%) are family households, while 330 (28.5%) are nonfamily households. The most numerous type of family households are 2-person households, comprising 400, and the most common type of nonfamily households are 1-person households, comprising 296.
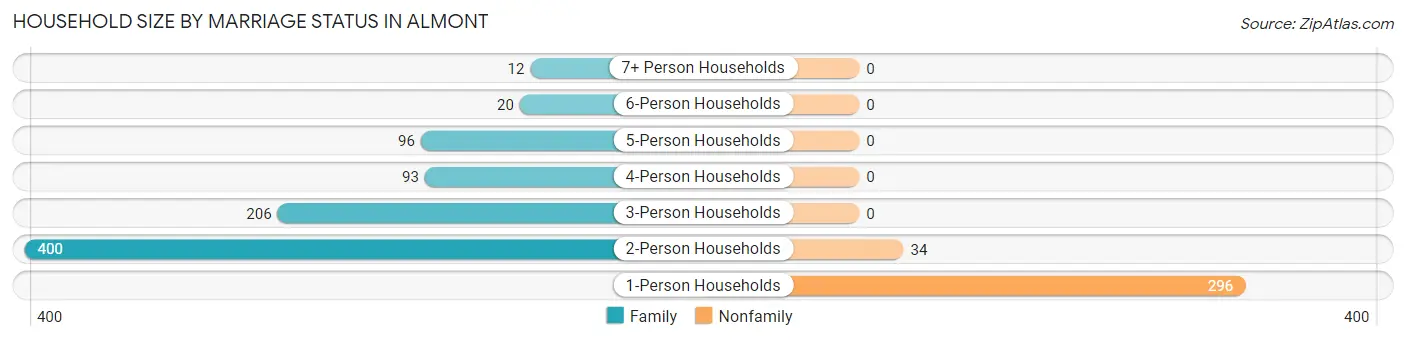
| Household Size | Family Households | Nonfamily Households |
| 1-Person Households | - | 296 (25.6%) |
| 2-Person Households | 400 (34.6%) | 34 (2.9%) |
| 3-Person Households | 206 (17.8%) | 0 (0.0%) |
| 4-Person Households | 93 (8.0%) | 0 (0.0%) |
| 5-Person Households | 96 (8.3%) | 0 (0.0%) |
| 6-Person Households | 20 (1.7%) | 0 (0.0%) |
| 7+ Person Households | 12 (1.0%) | 0 (0.0%) |
| Total | 827 (71.5%) | 330 (28.5%) |
Female Fertility in Almont
Fertility by Age in Almont
Average fertility rate in Almont is 56.0 births per 1,000 women. Women in the age bracket of 35 to 50 years have the highest fertility rate with 85.0 births per 1,000 women. Women in the age bracket of 35 to 50 years acount for 80.0% of all women with births.
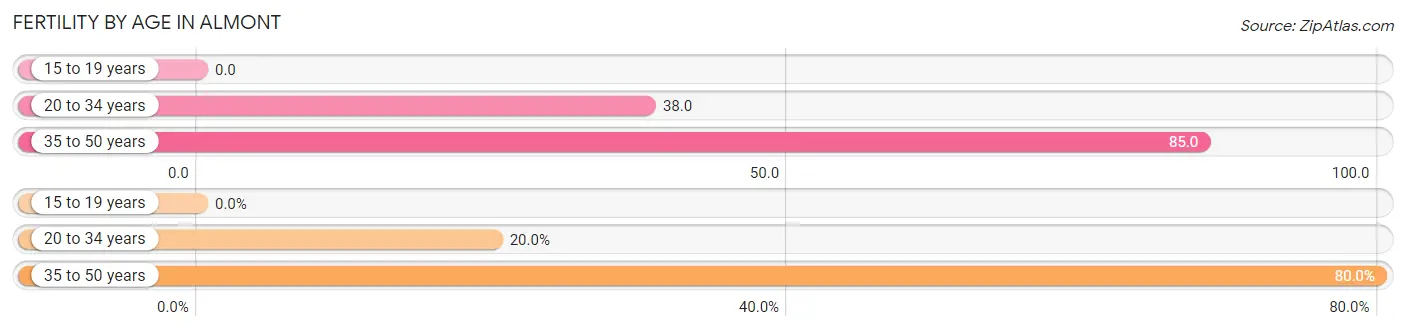
| Age Bracket | Women with Births | Births / 1,000 Women |
| 15 to 19 years | 0 (0.0%) | 0.0 |
| 20 to 34 years | 7 (20.0%) | 38.0 |
| 35 to 50 years | 28 (80.0%) | 85.0 |
| Total | 35 (100.0%) | 56.0 |
Fertility by Age by Marriage Status in Almont
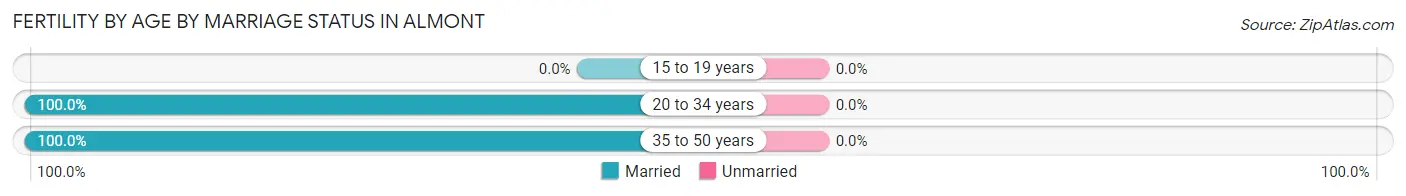
| Age Bracket | Married | Unmarried |
| 15 to 19 years | 0 (0.0%) | 0 (0.0%) |
| 20 to 34 years | 7 (100.0%) | 0 (0.0%) |
| 35 to 50 years | 28 (100.0%) | 0 (0.0%) |
| Total | 35 (100.0%) | 0 (0.0%) |
Fertility by Education in Almont
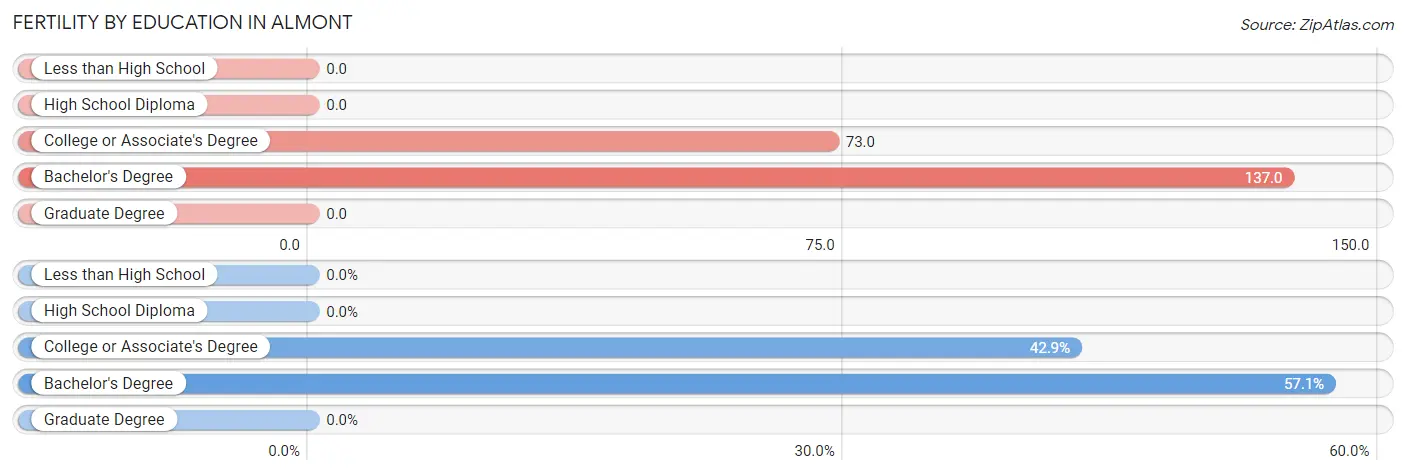
| Educational Attainment | Women with Births | Births / 1,000 Women |
| Less than High School | 0 (0.0%) | 0.0 |
| High School Diploma | 0 (0.0%) | 0.0 |
| College or Associate's Degree | 15 (42.9%) | 73.0 |
| Bachelor's Degree | 20 (57.1%) | 137.0 |
| Graduate Degree | 0 (0.0%) | 0.0 |
| Total | 35 (100.0%) | 56.0 |
Fertility by Education by Marriage Status in Almont
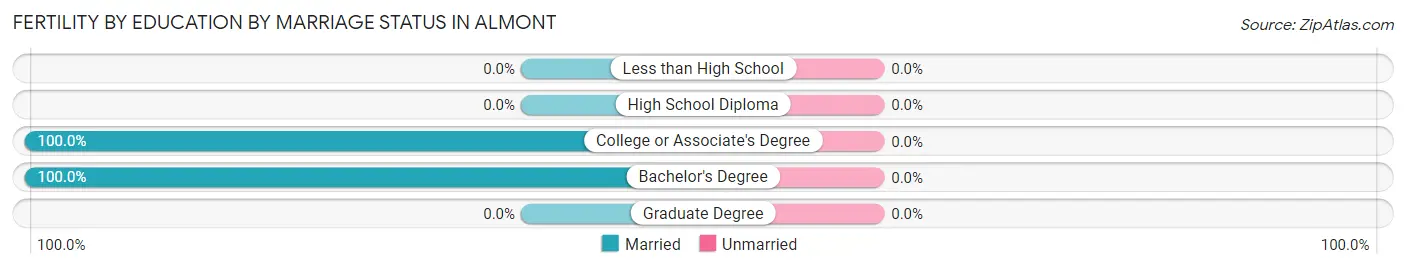
| Educational Attainment | Married | Unmarried |
| Less than High School | 0 (0.0%) | 0 (0.0%) |
| High School Diploma | 0 (0.0%) | 0 (0.0%) |
| College or Associate's Degree | 15 (100.0%) | 0 (0.0%) |
| Bachelor's Degree | 20 (100.0%) | 0 (0.0%) |
| Graduate Degree | 0 (0.0%) | 0 (0.0%) |
| Total | 35 (100.0%) | 0 (0.0%) |
Employment Characteristics in Almont
Employment by Class of Employer in Almont
Among the 1,422 employed individuals in Almont, private company employees (1,084 | 76.2%), not-for-profit organizations (124 | 8.7%), and local government employees (75 | 5.3%) make up the most common classes of employment.
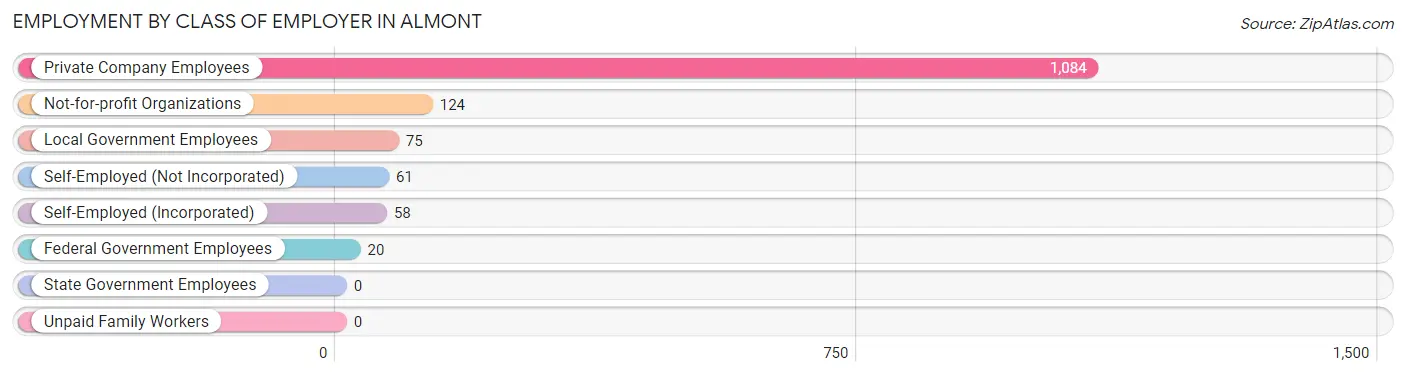
| Employer Class | # Employees | % Employees |
| Private Company Employees | 1,084 | 76.2% |
| Self-Employed (Incorporated) | 58 | 4.1% |
| Self-Employed (Not Incorporated) | 61 | 4.3% |
| Not-for-profit Organizations | 124 | 8.7% |
| Local Government Employees | 75 | 5.3% |
| State Government Employees | 0 | 0.0% |
| Federal Government Employees | 20 | 1.4% |
| Unpaid Family Workers | 0 | 0.0% |
| Total | 1,422 | 100.0% |
Employment Status by Age in Almont
According to the labor force statistics for Almont, out of the total population over 16 years of age (2,377), 66.3% or 1,576 individuals are in the labor force, with 8.6% or 136 of them unemployed. The age group with the highest labor force participation rate is 30 to 34 years, with 94.6% or 191 individuals in the labor force. Within the labor force, the 20 to 24 years age range has the highest percentage of unemployed individuals, with 29.5% or 28 of them being unemployed.
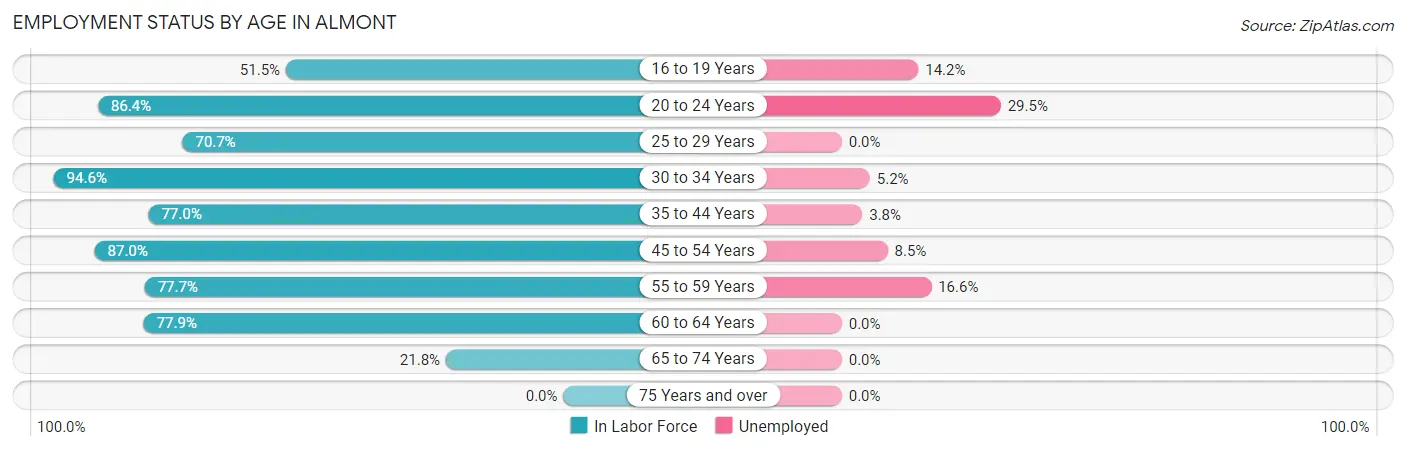
| Age Bracket | In Labor Force | Unemployed |
| 16 to 19 Years | 106 (51.5%) | 15 (14.2%) |
| 20 to 24 Years | 95 (86.4%) | 28 (29.5%) |
| 25 to 29 Years | 118 (70.7%) | 0 (0.0%) |
| 30 to 34 Years | 191 (94.6%) | 10 (5.2%) |
| 35 to 44 Years | 318 (77.0%) | 12 (3.8%) |
| 45 to 54 Years | 307 (87.0%) | 26 (8.5%) |
| 55 to 59 Years | 265 (77.7%) | 44 (16.6%) |
| 60 to 64 Years | 106 (77.9%) | 0 (0.0%) |
| 65 to 74 Years | 69 (21.8%) | 0 (0.0%) |
| 75 Years and over | 0 (0.0%) | 0 (0.0%) |
| Total | 1,576 (66.3%) | 136 (8.6%) |
Employment Status by Educational Attainment in Almont
According to labor force statistics for Almont, 81.0% of individuals (1,306) out of the total population between 25 and 64 years of age (1,612) are in the labor force, with 7.0% or 91 of them being unemployed. The group with the highest labor force participation rate are those with the educational attainment of high school diploma, with 86.6% or 362 individuals in the labor force. Within the labor force, individuals with high school diploma education have the highest percentage of unemployment, with 13.3% or 48 of them being unemployed.
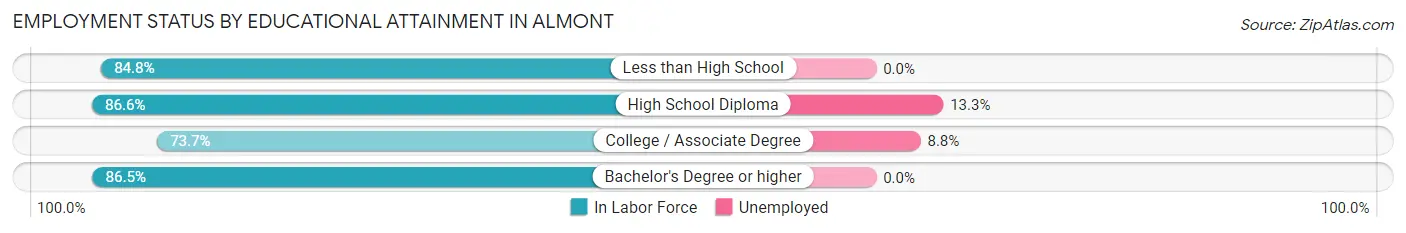
| Educational Attainment | In Labor Force | Unemployed |
| Less than High School | 128 (84.8%) | 0 (0.0%) |
| High School Diploma | 362 (86.6%) | 56 (13.3%) |
| College / Associate Degree | 502 (73.7%) | 60 (8.8%) |
| Bachelor's Degree or higher | 313 (86.5%) | 0 (0.0%) |
| Total | 1,306 (81.0%) | 113 (7.0%) |
Employment Occupations by Sex in Almont
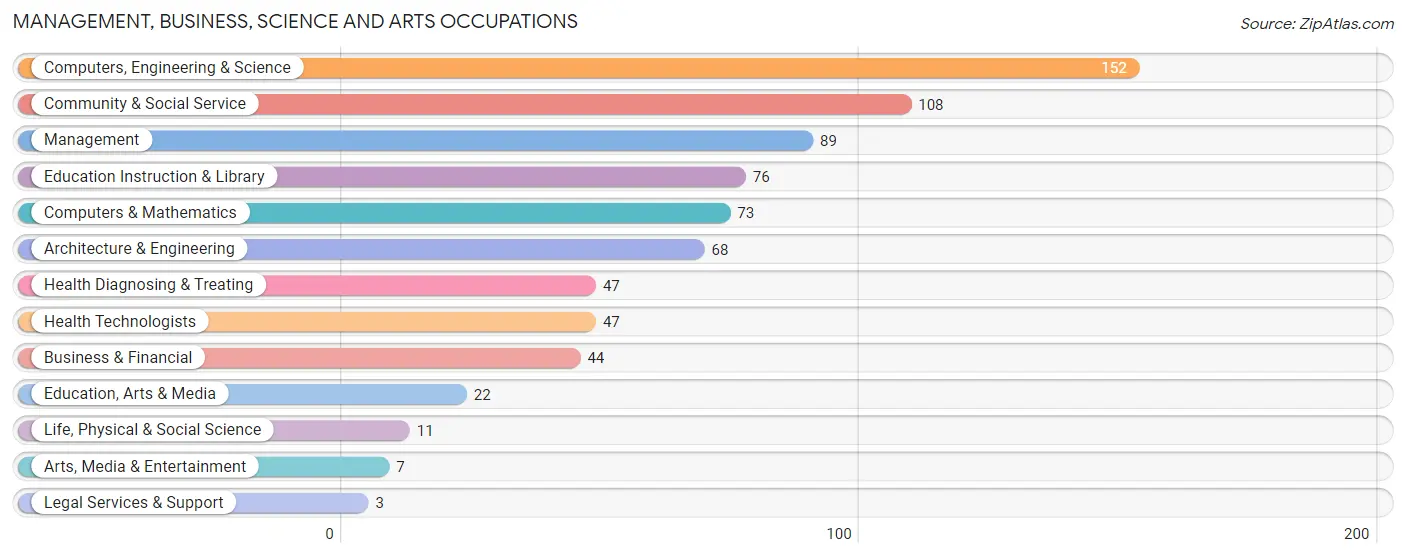
Management, Business, Science and Arts Occupations
The most common Management, Business, Science and Arts occupations in Almont are Computers, Engineering & Science (152 | 10.6%), Community & Social Service (108 | 7.5%), Management (89 | 6.2%), Education Instruction & Library (76 | 5.3%), and Computers & Mathematics (73 | 5.1%).
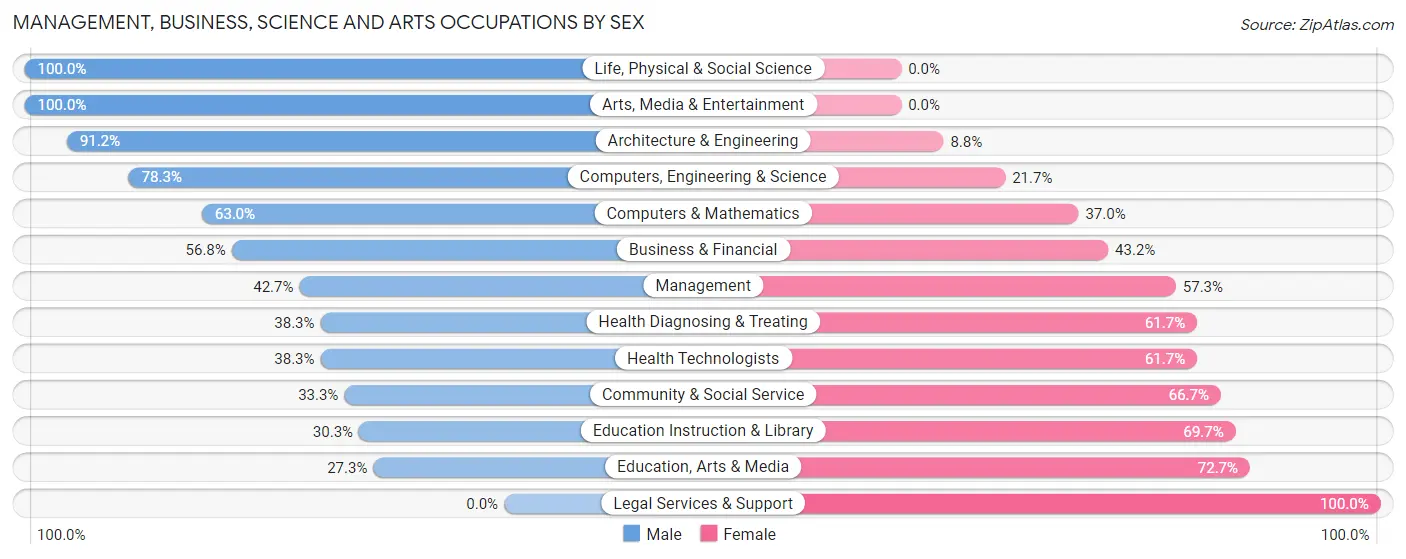
Management, Business, Science and Arts Occupations by Sex
Within the Management, Business, Science and Arts occupations in Almont, the most male-oriented occupations are Life, Physical & Social Science (100.0%), Arts, Media & Entertainment (100.0%), and Architecture & Engineering (91.2%), while the most female-oriented occupations are Legal Services & Support (100.0%), Education, Arts & Media (72.7%), and Education Instruction & Library (69.7%).
| Occupation | Male | Female |
| Management | 38 (42.7%) | 51 (57.3%) |
| Business & Financial | 25 (56.8%) | 19 (43.2%) |
| Computers, Engineering & Science | 119 (78.3%) | 33 (21.7%) |
| Computers & Mathematics | 46 (63.0%) | 27 (37.0%) |
| Architecture & Engineering | 62 (91.2%) | 6 (8.8%) |
| Life, Physical & Social Science | 11 (100.0%) | 0 (0.0%) |
| Community & Social Service | 36 (33.3%) | 72 (66.7%) |
| Education, Arts & Media | 6 (27.3%) | 16 (72.7%) |
| Legal Services & Support | 0 (0.0%) | 3 (100.0%) |
| Education Instruction & Library | 23 (30.3%) | 53 (69.7%) |
| Arts, Media & Entertainment | 7 (100.0%) | 0 (0.0%) |
| Health Diagnosing & Treating | 18 (38.3%) | 29 (61.7%) |
| Health Technologists | 18 (38.3%) | 29 (61.7%) |
| Total (Category) | 236 (53.6%) | 204 (46.4%) |
| Total (Overall) | 821 (57.0%) | 619 (43.0%) |
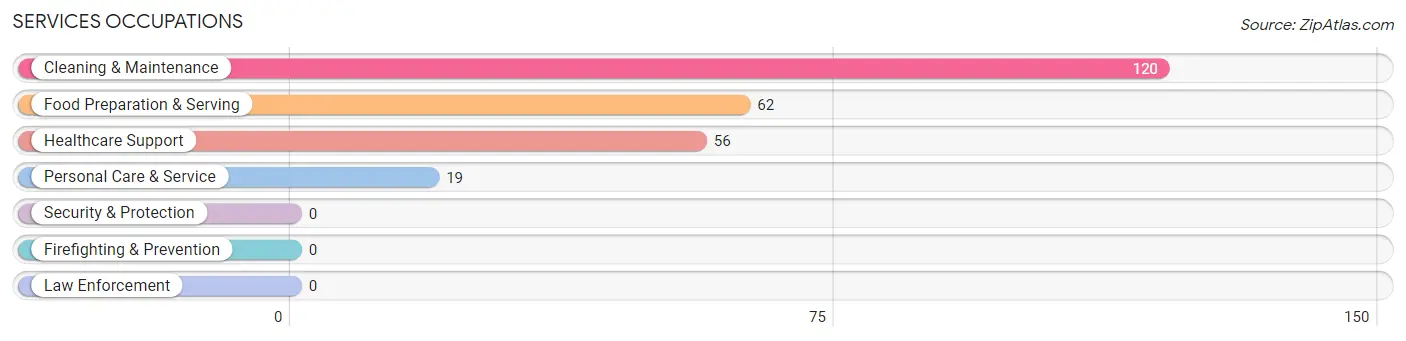
Services Occupations
The most common Services occupations in Almont are Cleaning & Maintenance (120 | 8.3%), Food Preparation & Serving (62 | 4.3%), Healthcare Support (56 | 3.9%), and Personal Care & Service (19 | 1.3%).
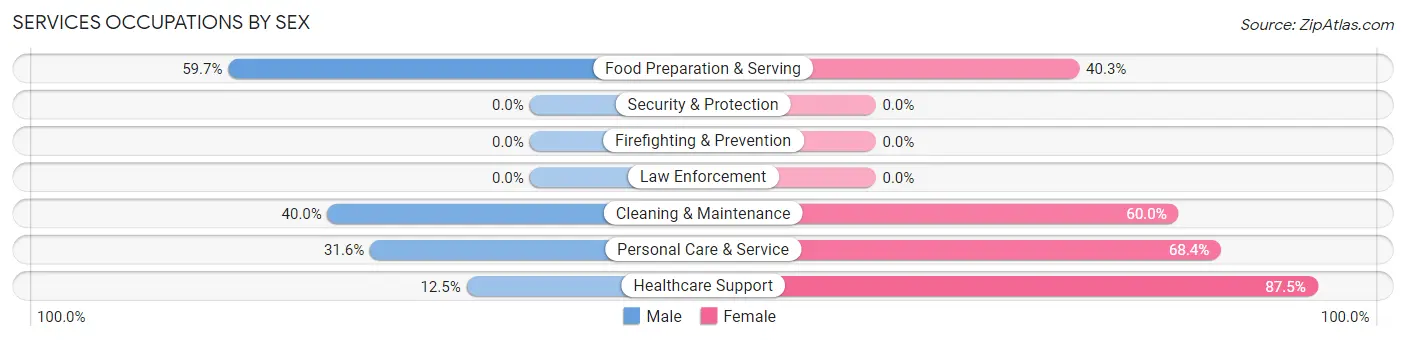
Services Occupations by Sex
Within the Services occupations in Almont, the most male-oriented occupations are Food Preparation & Serving (59.7%), Cleaning & Maintenance (40.0%), and Personal Care & Service (31.6%), while the most female-oriented occupations are Healthcare Support (87.5%), Personal Care & Service (68.4%), and Cleaning & Maintenance (60.0%).
| Occupation | Male | Female |
| Healthcare Support | 7 (12.5%) | 49 (87.5%) |
| Security & Protection | 0 (0.0%) | 0 (0.0%) |
| Firefighting & Prevention | 0 (0.0%) | 0 (0.0%) |
| Law Enforcement | 0 (0.0%) | 0 (0.0%) |
| Food Preparation & Serving | 37 (59.7%) | 25 (40.3%) |
| Cleaning & Maintenance | 48 (40.0%) | 72 (60.0%) |
| Personal Care & Service | 6 (31.6%) | 13 (68.4%) |
| Total (Category) | 98 (38.1%) | 159 (61.9%) |
| Total (Overall) | 821 (57.0%) | 619 (43.0%) |
Sales and Office Occupations
The most common Sales and Office occupations in Almont are Office & Administration (176 | 12.2%), and Sales & Related (93 | 6.5%).

Sales and Office Occupations by Sex

| Occupation | Male | Female |
| Sales & Related | 40 (43.0%) | 53 (57.0%) |
| Office & Administration | 44 (25.0%) | 132 (75.0%) |
| Total (Category) | 84 (31.2%) | 185 (68.8%) |
| Total (Overall) | 821 (57.0%) | 619 (43.0%) |
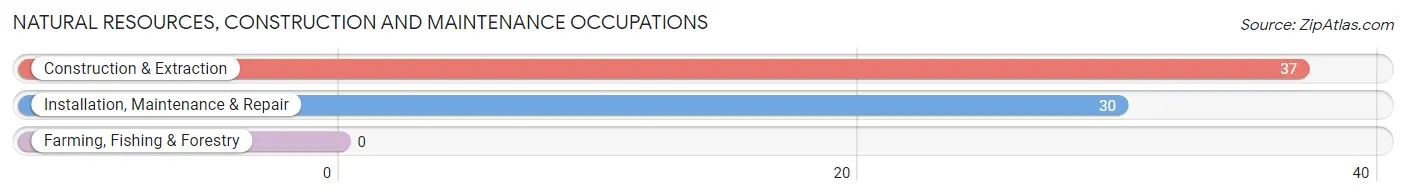
Natural Resources, Construction and Maintenance Occupations
The most common Natural Resources, Construction and Maintenance occupations in Almont are Construction & Extraction (37 | 2.6%), and Installation, Maintenance & Repair (30 | 2.1%).
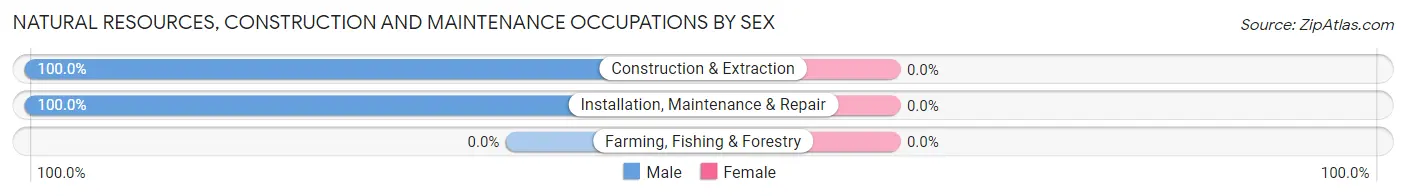
Natural Resources, Construction and Maintenance Occupations by Sex
| Occupation | Male | Female |
| Farming, Fishing & Forestry | 0 (0.0%) | 0 (0.0%) |
| Construction & Extraction | 37 (100.0%) | 0 (0.0%) |
| Installation, Maintenance & Repair | 30 (100.0%) | 0 (0.0%) |
| Total (Category) | 67 (100.0%) | 0 (0.0%) |
| Total (Overall) | 821 (57.0%) | 619 (43.0%) |
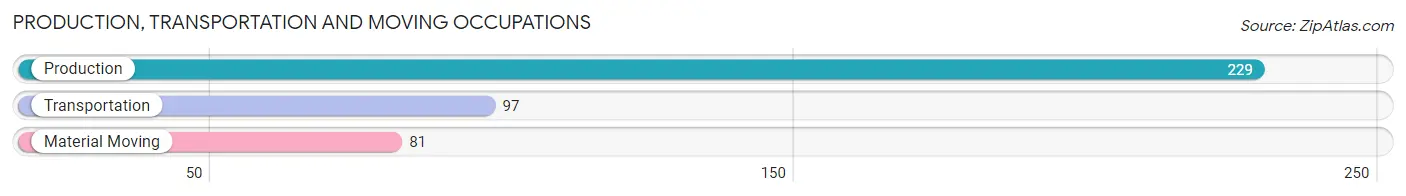
Production, Transportation and Moving Occupations
The most common Production, Transportation and Moving occupations in Almont are Production (229 | 15.9%), Transportation (97 | 6.7%), and Material Moving (81 | 5.6%).
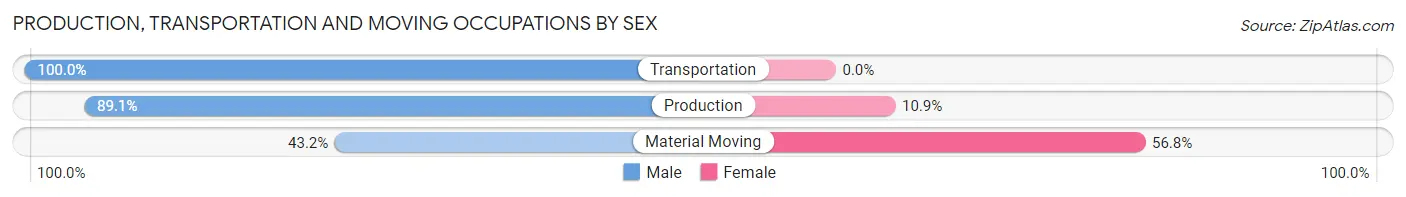
Production, Transportation and Moving Occupations by Sex
| Occupation | Male | Female |
| Production | 204 (89.1%) | 25 (10.9%) |
| Transportation | 97 (100.0%) | 0 (0.0%) |
| Material Moving | 35 (43.2%) | 46 (56.8%) |
| Total (Category) | 336 (82.6%) | 71 (17.4%) |
| Total (Overall) | 821 (57.0%) | 619 (43.0%) |
Employment Industries by Sex in Almont
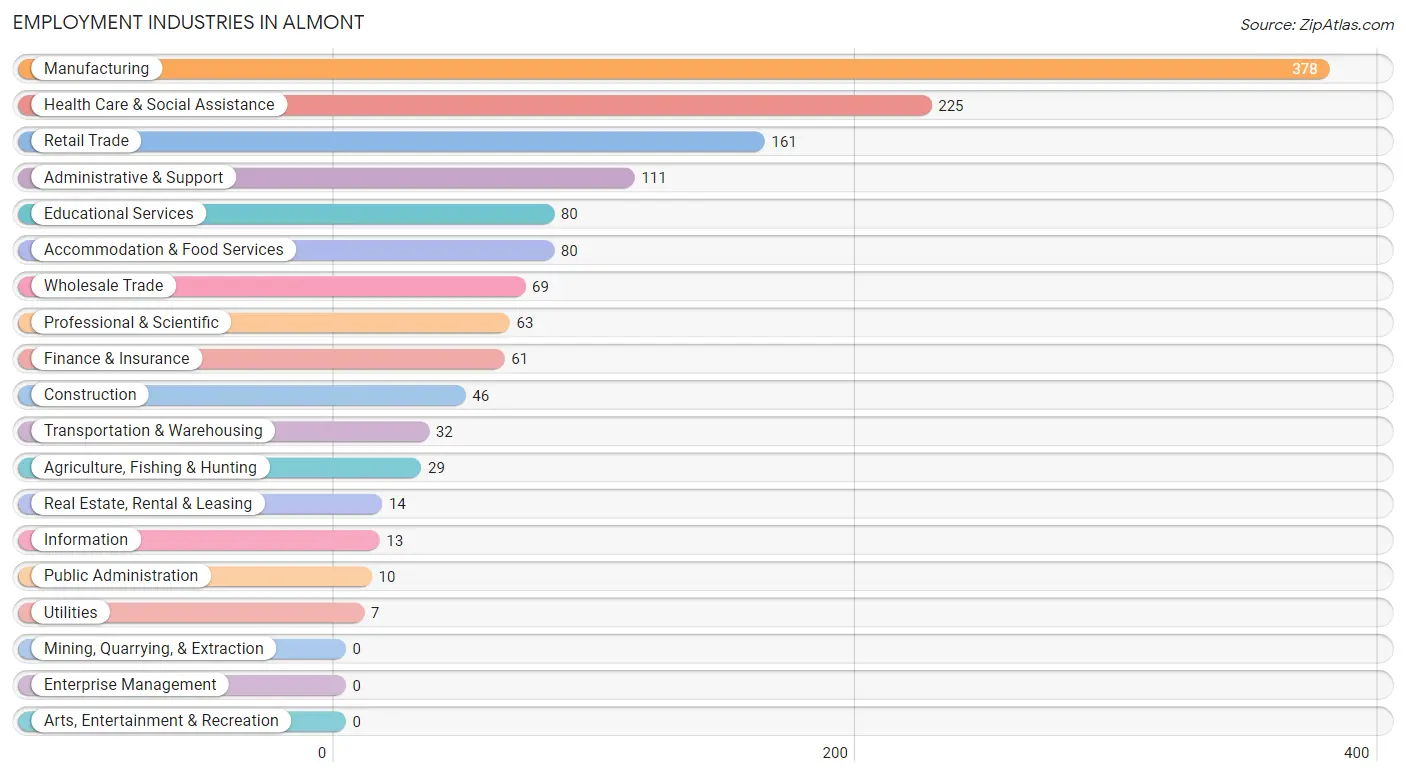
Employment Industries in Almont
The major employment industries in Almont include Manufacturing (378 | 26.3%), Health Care & Social Assistance (225 | 15.6%), Retail Trade (161 | 11.2%), Administrative & Support (111 | 7.7%), and Educational Services (80 | 5.6%).
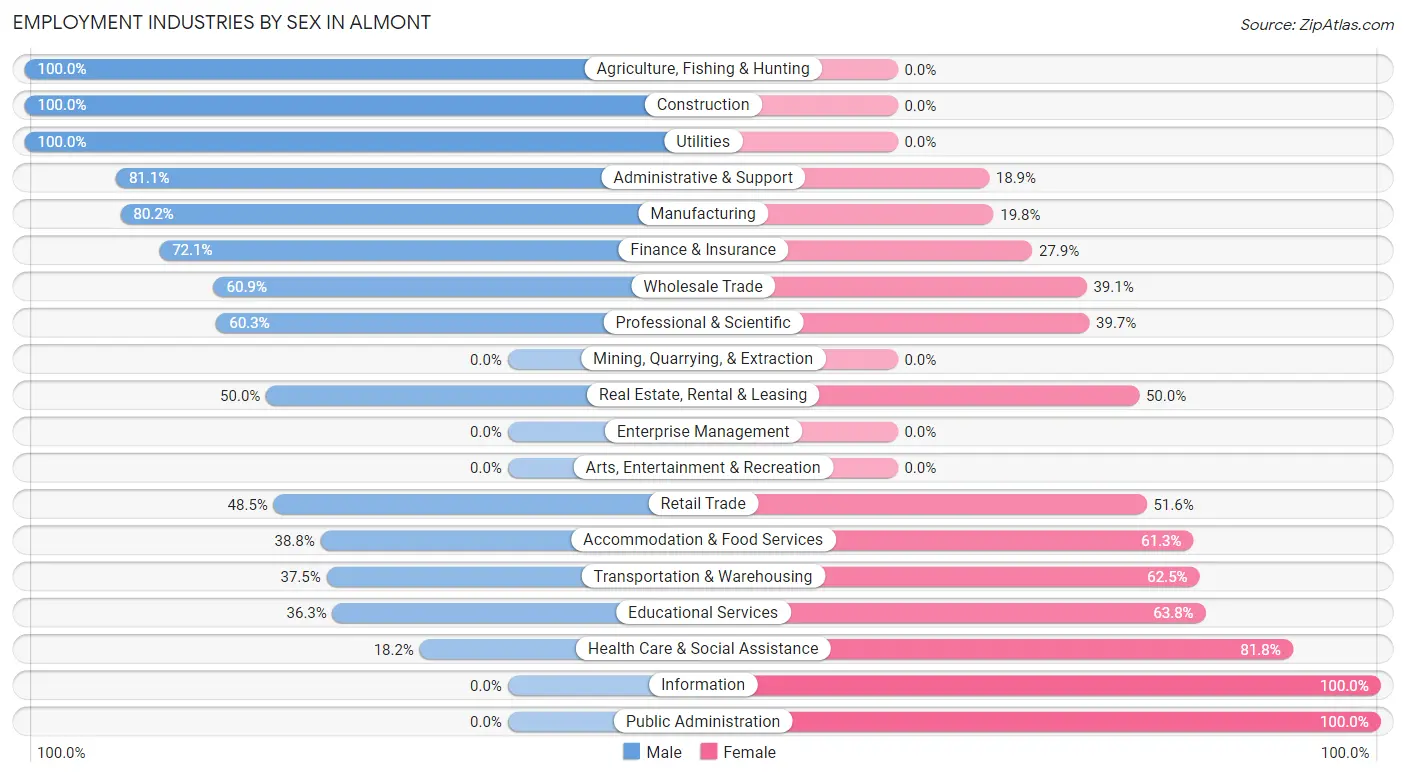
Employment Industries by Sex in Almont
The Almont industries that see more men than women are Agriculture, Fishing & Hunting (100.0%), Construction (100.0%), and Utilities (100.0%), whereas the industries that tend to have a higher number of women are Information (100.0%), Public Administration (100.0%), and Health Care & Social Assistance (81.8%).
| Industry | Male | Female |
| Agriculture, Fishing & Hunting | 29 (100.0%) | 0 (0.0%) |
| Mining, Quarrying, & Extraction | 0 (0.0%) | 0 (0.0%) |
| Construction | 46 (100.0%) | 0 (0.0%) |
| Manufacturing | 303 (80.2%) | 75 (19.8%) |
| Wholesale Trade | 42 (60.9%) | 27 (39.1%) |
| Retail Trade | 78 (48.4%) | 83 (51.5%) |
| Transportation & Warehousing | 12 (37.5%) | 20 (62.5%) |
| Utilities | 7 (100.0%) | 0 (0.0%) |
| Information | 0 (0.0%) | 13 (100.0%) |
| Finance & Insurance | 44 (72.1%) | 17 (27.9%) |
| Real Estate, Rental & Leasing | 7 (50.0%) | 7 (50.0%) |
| Professional & Scientific | 38 (60.3%) | 25 (39.7%) |
| Enterprise Management | 0 (0.0%) | 0 (0.0%) |
| Administrative & Support | 90 (81.1%) | 21 (18.9%) |
| Educational Services | 29 (36.2%) | 51 (63.7%) |
| Health Care & Social Assistance | 41 (18.2%) | 184 (81.8%) |
| Arts, Entertainment & Recreation | 0 (0.0%) | 0 (0.0%) |
| Accommodation & Food Services | 31 (38.8%) | 49 (61.3%) |
| Public Administration | 0 (0.0%) | 10 (100.0%) |
| Total | 821 (57.0%) | 619 (43.0%) |
Education in Almont
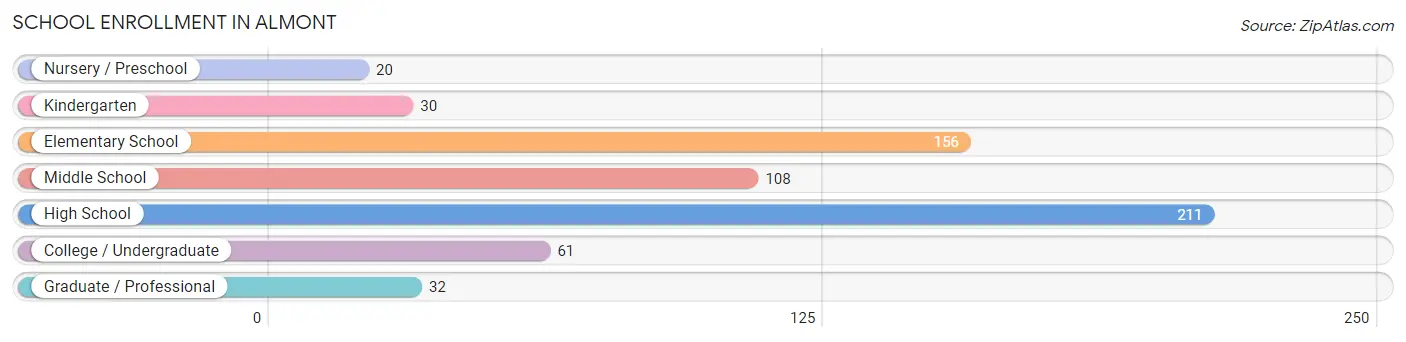
School Enrollment in Almont
The most common levels of schooling among the 618 students in Almont are high school (211 | 34.1%), elementary school (156 | 25.2%), and middle school (108 | 17.5%).
| School Level | # Students | % Students |
| Nursery / Preschool | 20 | 3.2% |
| Kindergarten | 30 | 4.9% |
| Elementary School | 156 | 25.2% |
| Middle School | 108 | 17.5% |
| High School | 211 | 34.1% |
| College / Undergraduate | 61 | 9.9% |
| Graduate / Professional | 32 | 5.2% |
| Total | 618 | 100.0% |
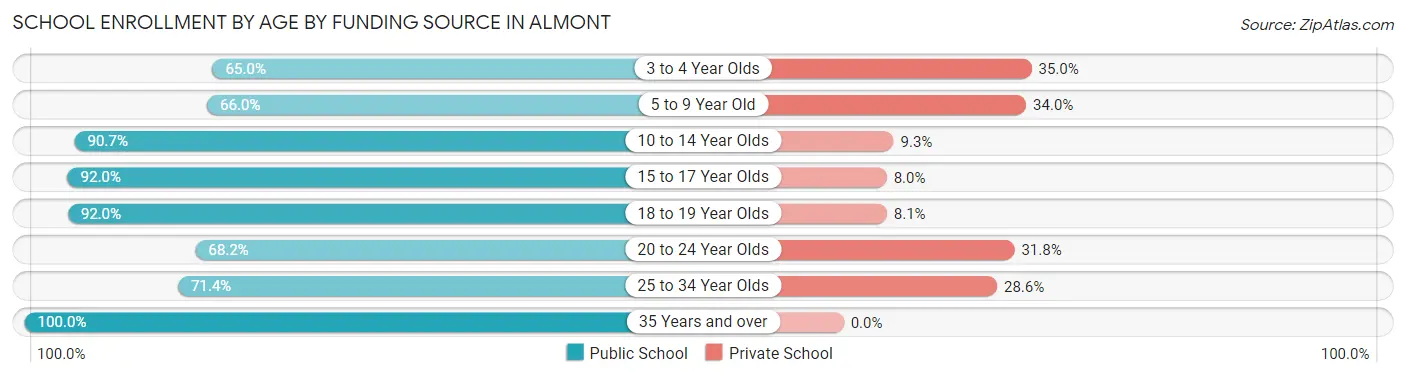
School Enrollment by Age by Funding Source in Almont
Out of a total of 618 students who are enrolled in schools in Almont, 106 (17.2%) attend a private institution, while the remaining 512 (82.8%) are enrolled in public schools. The age group of 3 to 4 year olds has the highest likelihood of being enrolled in private schools, with 7 (35.0% in the age bracket) enrolled. Conversely, the age group of 35 years and over has the lowest likelihood of being enrolled in a private school, with 17 (100.0% in the age bracket) attending a public institution.
| Age Bracket | Public School | Private School |
| 3 to 4 Year Olds | 13 (65.0%) | 7 (35.0%) |
| 5 to 9 Year Old | 101 (66.0%) | 52 (34.0%) |
| 10 to 14 Year Olds | 117 (90.7%) | 12 (9.3%) |
| 15 to 17 Year Olds | 149 (92.0%) | 13 (8.0%) |
| 18 to 19 Year Olds | 80 (91.9%) | 7 (8.1%) |
| 20 to 24 Year Olds | 15 (68.2%) | 7 (31.8%) |
| 25 to 34 Year Olds | 20 (71.4%) | 8 (28.6%) |
| 35 Years and over | 17 (100.0%) | 0 (0.0%) |
| Total | 512 (82.8%) | 106 (17.2%) |
Educational Attainment by Field of Study in Almont
Business (83 | 21.6%), engineering (62 | 16.1%), science & technology (53 | 13.8%), literature & languages (41 | 10.6%), and education (39 | 10.1%) are the most common fields of study among 385 individuals in Almont who have obtained a bachelor's degree or higher.
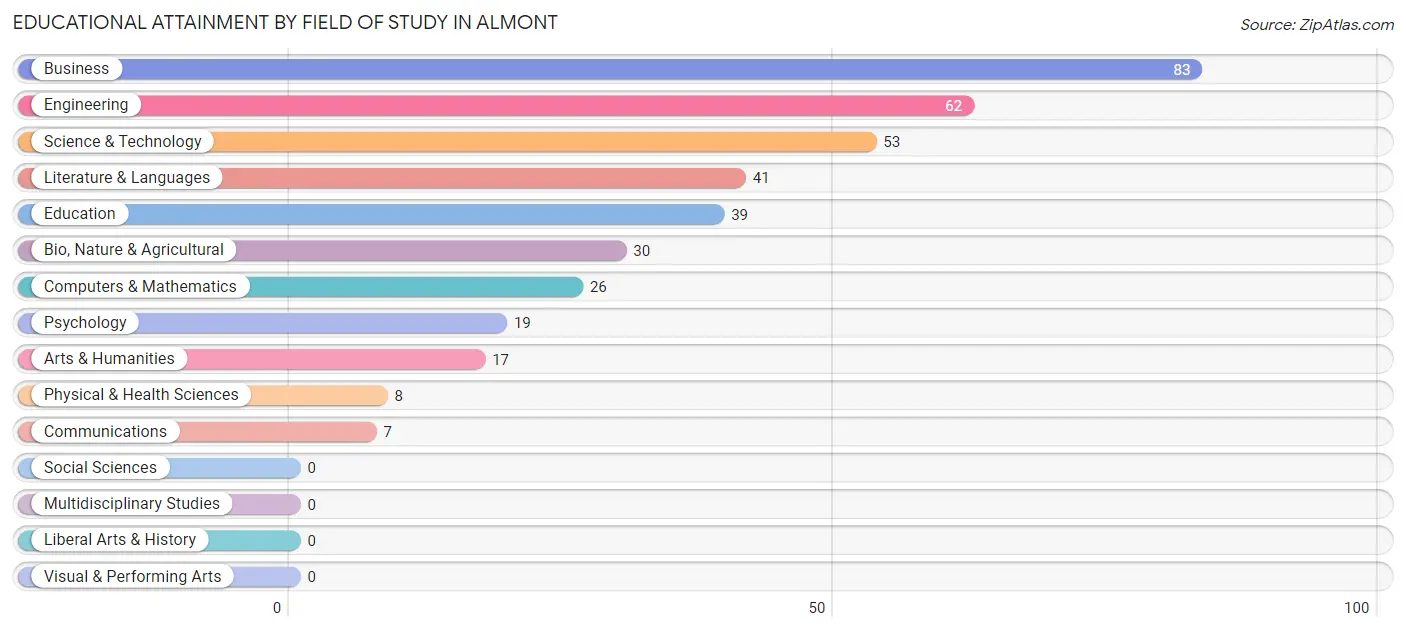
| Field of Study | # Graduates | % Graduates |
| Computers & Mathematics | 26 | 6.8% |
| Bio, Nature & Agricultural | 30 | 7.8% |
| Physical & Health Sciences | 8 | 2.1% |
| Psychology | 19 | 4.9% |
| Social Sciences | 0 | 0.0% |
| Engineering | 62 | 16.1% |
| Multidisciplinary Studies | 0 | 0.0% |
| Science & Technology | 53 | 13.8% |
| Business | 83 | 21.6% |
| Education | 39 | 10.1% |
| Literature & Languages | 41 | 10.6% |
| Liberal Arts & History | 0 | 0.0% |
| Visual & Performing Arts | 0 | 0.0% |
| Communications | 7 | 1.8% |
| Arts & Humanities | 17 | 4.4% |
| Total | 385 | 100.0% |
Transportation & Commute in Almont
Vehicle Availability by Sex in Almont
The most prevalent vehicle ownership categories in Almont are males with 2 vehicles (333, accounting for 40.9%) and females with 2 vehicles (266, making up 54.9%).
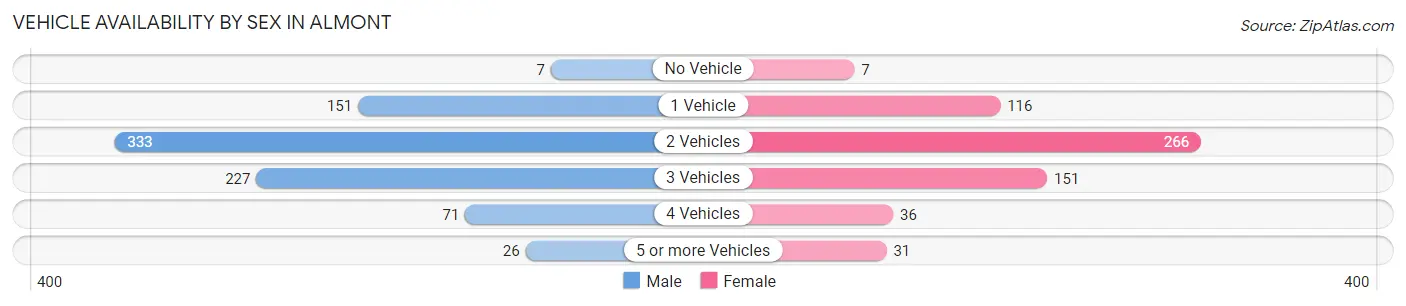
| Vehicles Available | Male | Female |
| No Vehicle | 7 (0.9%) | 7 (1.1%) |
| 1 Vehicle | 151 (18.5%) | 116 (19.1%) |
| 2 Vehicles | 333 (40.9%) | 266 (43.8%) |
| 3 Vehicles | 227 (27.9%) | 151 (24.9%) |
| 4 Vehicles | 71 (8.7%) | 36 (5.9%) |
| 5 or more Vehicles | 26 (3.2%) | 31 (5.1%) |
| Total | 815 (100.0%) | 607 (100.0%) |
Commute Time in Almont
The most frequently occuring commute durations in Almont are 45 to 59 minutes (213 commuters, 17.6%), 15 to 19 minutes (154 commuters, 12.8%), and 30 to 34 minutes (142 commuters, 11.7%).
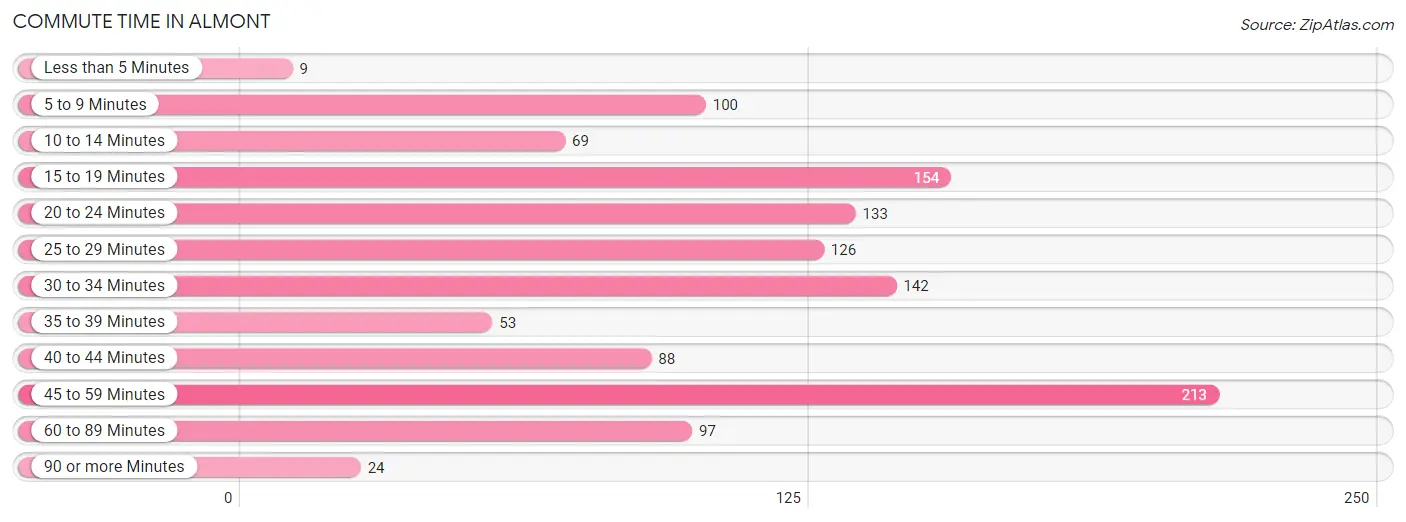
| Commute Time | # Commuters | % Commuters |
| Less than 5 Minutes | 9 | 0.7% |
| 5 to 9 Minutes | 100 | 8.3% |
| 10 to 14 Minutes | 69 | 5.7% |
| 15 to 19 Minutes | 154 | 12.8% |
| 20 to 24 Minutes | 133 | 11.0% |
| 25 to 29 Minutes | 126 | 10.4% |
| 30 to 34 Minutes | 142 | 11.7% |
| 35 to 39 Minutes | 53 | 4.4% |
| 40 to 44 Minutes | 88 | 7.3% |
| 45 to 59 Minutes | 213 | 17.6% |
| 60 to 89 Minutes | 97 | 8.0% |
| 90 or more Minutes | 24 | 2.0% |
Commute Time by Sex in Almont
The most common commute times in Almont are 45 to 59 minutes (162 commuters, 23.6%) for males and 25 to 29 minutes (79 commuters, 15.1%) for females.
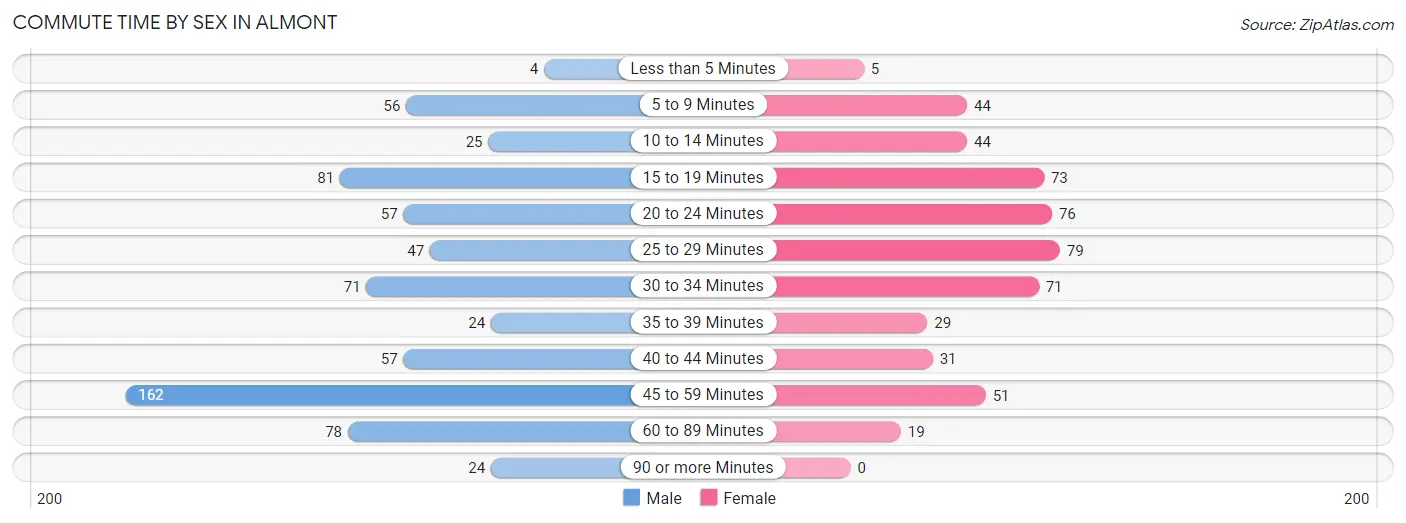
| Commute Time | Male | Female |
| Less than 5 Minutes | 4 (0.6%) | 5 (1.0%) |
| 5 to 9 Minutes | 56 (8.2%) | 44 (8.4%) |
| 10 to 14 Minutes | 25 (3.6%) | 44 (8.4%) |
| 15 to 19 Minutes | 81 (11.8%) | 73 (14.0%) |
| 20 to 24 Minutes | 57 (8.3%) | 76 (14.6%) |
| 25 to 29 Minutes | 47 (6.9%) | 79 (15.1%) |
| 30 to 34 Minutes | 71 (10.3%) | 71 (13.6%) |
| 35 to 39 Minutes | 24 (3.5%) | 29 (5.6%) |
| 40 to 44 Minutes | 57 (8.3%) | 31 (5.9%) |
| 45 to 59 Minutes | 162 (23.6%) | 51 (9.8%) |
| 60 to 89 Minutes | 78 (11.4%) | 19 (3.6%) |
| 90 or more Minutes | 24 (3.5%) | 0 (0.0%) |
Time of Departure to Work by Sex in Almont
The most frequent times of departure to work in Almont are 6:30 AM to 6:59 AM (127, 18.5%) for males and 7:00 AM to 7:29 AM (67, 12.8%) for females.
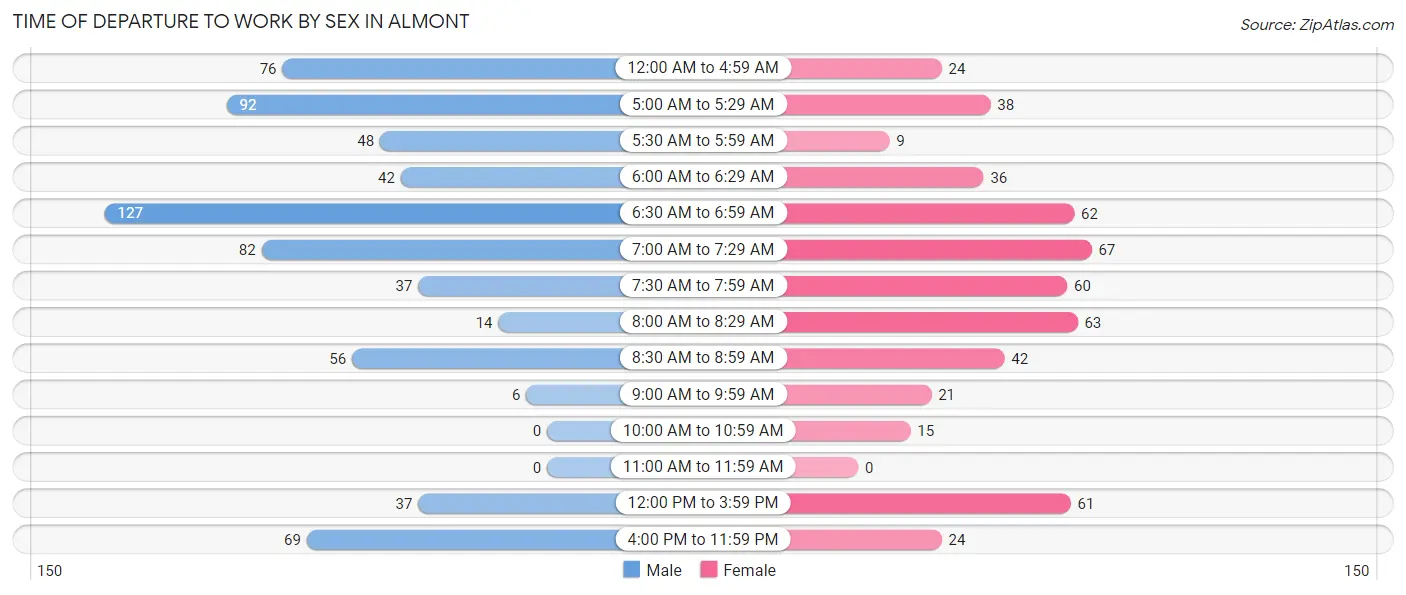
| Time of Departure | Male | Female |
| 12:00 AM to 4:59 AM | 76 (11.1%) | 24 (4.6%) |
| 5:00 AM to 5:29 AM | 92 (13.4%) | 38 (7.3%) |
| 5:30 AM to 5:59 AM | 48 (7.0%) | 9 (1.7%) |
| 6:00 AM to 6:29 AM | 42 (6.1%) | 36 (6.9%) |
| 6:30 AM to 6:59 AM | 127 (18.5%) | 62 (11.9%) |
| 7:00 AM to 7:29 AM | 82 (11.9%) | 67 (12.8%) |
| 7:30 AM to 7:59 AM | 37 (5.4%) | 60 (11.5%) |
| 8:00 AM to 8:29 AM | 14 (2.0%) | 63 (12.1%) |
| 8:30 AM to 8:59 AM | 56 (8.2%) | 42 (8.1%) |
| 9:00 AM to 9:59 AM | 6 (0.9%) | 21 (4.0%) |
| 10:00 AM to 10:59 AM | 0 (0.0%) | 15 (2.9%) |
| 11:00 AM to 11:59 AM | 0 (0.0%) | 0 (0.0%) |
| 12:00 PM to 3:59 PM | 37 (5.4%) | 61 (11.7%) |
| 4:00 PM to 11:59 PM | 69 (10.1%) | 24 (4.6%) |
| Total | 686 (100.0%) | 522 (100.0%) |
Housing Occupancy in Almont
Occupancy by Ownership in Almont
Of the total 1,157 dwellings in Almont, owner-occupied units account for 981 (84.8%), while renter-occupied units make up 176 (15.2%).
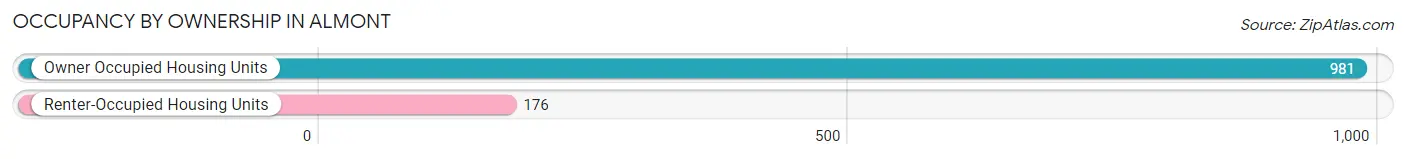
| Occupancy | # Housing Units | % Housing Units |
| Owner Occupied Housing Units | 981 | 84.8% |
| Renter-Occupied Housing Units | 176 | 15.2% |
| Total Occupied Housing Units | 1,157 | 100.0% |
Occupancy by Household Size in Almont
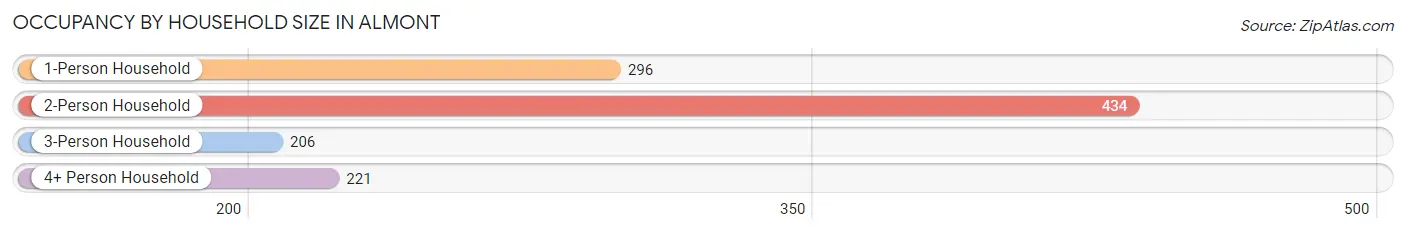
| Household Size | # Housing Units | % Housing Units |
| 1-Person Household | 296 | 25.6% |
| 2-Person Household | 434 | 37.5% |
| 3-Person Household | 206 | 17.8% |
| 4+ Person Household | 221 | 19.1% |
| Total Housing Units | 1,157 | 100.0% |
Occupancy by Ownership by Household Size in Almont
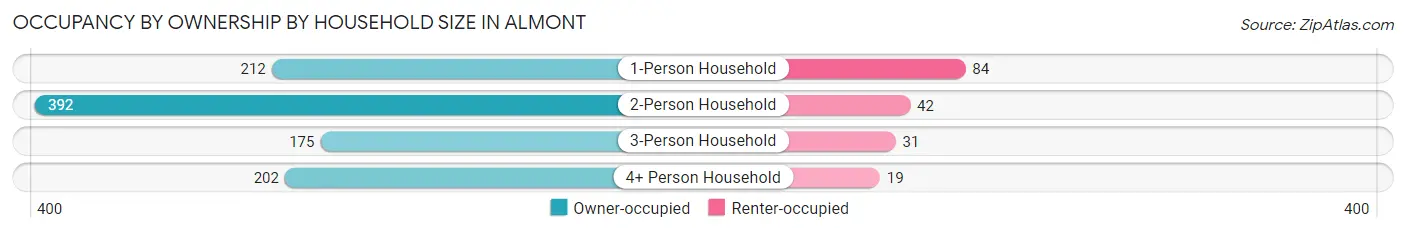
| Household Size | Owner-occupied | Renter-occupied |
| 1-Person Household | 212 (71.6%) | 84 (28.4%) |
| 2-Person Household | 392 (90.3%) | 42 (9.7%) |
| 3-Person Household | 175 (85.0%) | 31 (15.0%) |
| 4+ Person Household | 202 (91.4%) | 19 (8.6%) |
| Total Housing Units | 981 (84.8%) | 176 (15.2%) |
Occupancy by Educational Attainment in Almont
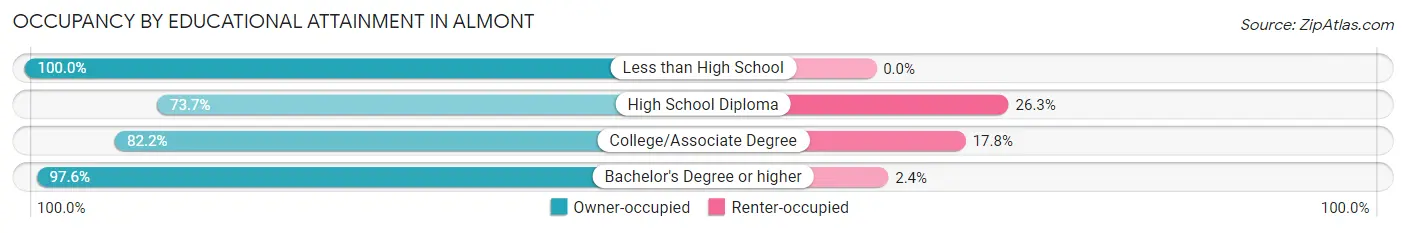
| Household Size | Owner-occupied | Renter-occupied |
| Less than High School | 92 (100.0%) | 0 (0.0%) |
| High School Diploma | 219 (73.7%) | 78 (26.3%) |
| College/Associate Degree | 426 (82.2%) | 92 (17.8%) |
| Bachelor's Degree or higher | 244 (97.6%) | 6 (2.4%) |
Occupancy by Age of Householder in Almont
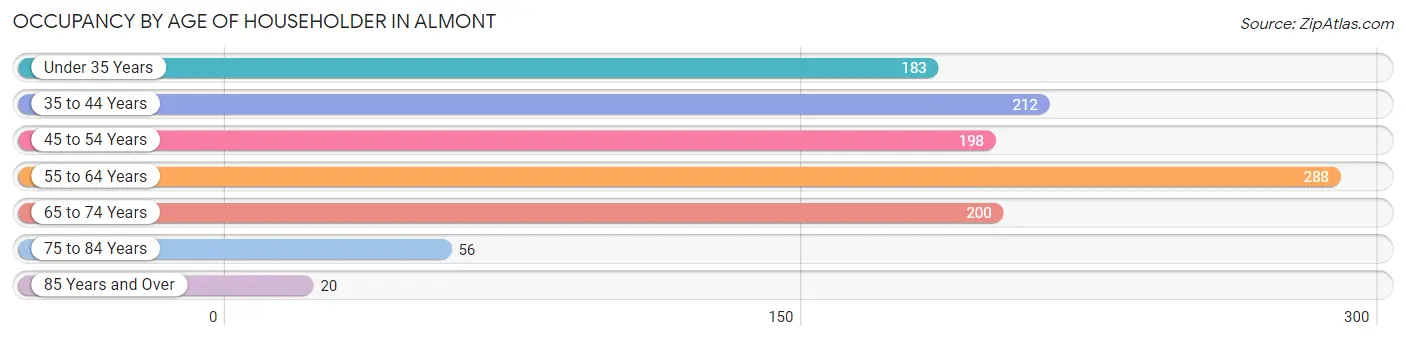
| Age Bracket | # Households | % Households |
| Under 35 Years | 183 | 15.8% |
| 35 to 44 Years | 212 | 18.3% |
| 45 to 54 Years | 198 | 17.1% |
| 55 to 64 Years | 288 | 24.9% |
| 65 to 74 Years | 200 | 17.3% |
| 75 to 84 Years | 56 | 4.8% |
| 85 Years and Over | 20 | 1.7% |
| Total | 1,157 | 100.0% |
Housing Finances in Almont
Median Income by Occupancy in Almont
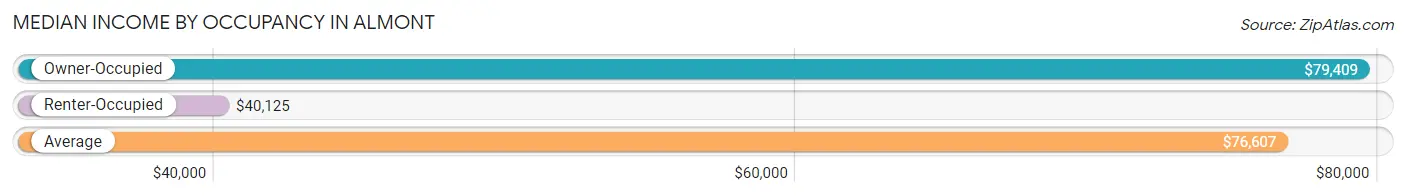
| Occupancy Type | # Households | Median Income |
| Owner-Occupied | 981 (84.8%) | $79,409 |
| Renter-Occupied | 176 (15.2%) | $40,125 |
| Average | 1,157 (100.0%) | $76,607 |
Occupancy by Householder Income Bracket in Almont
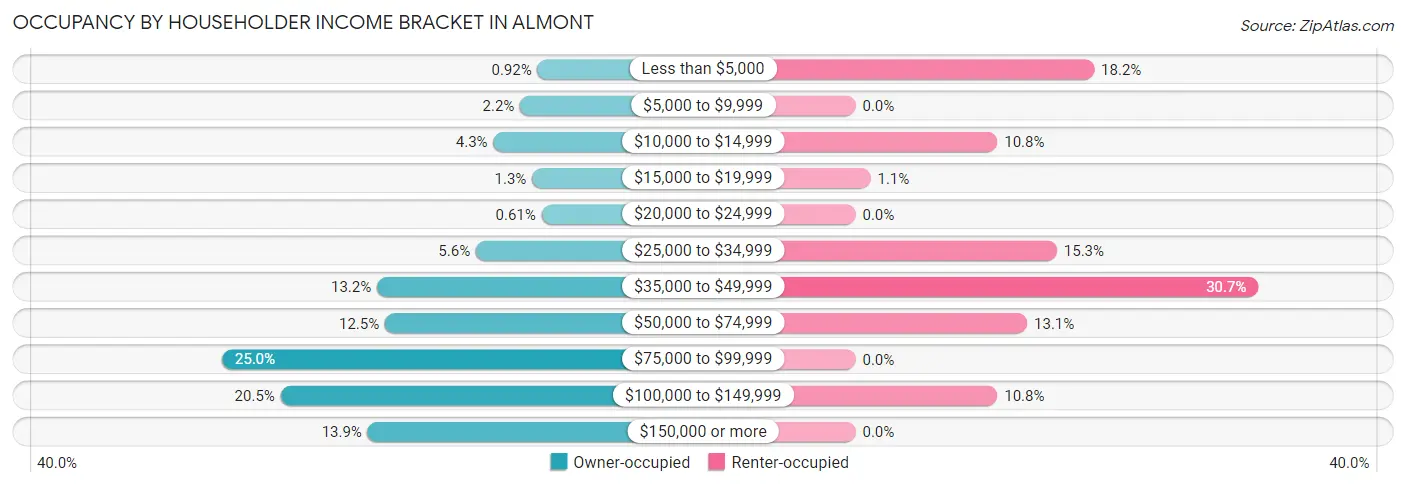
| Income Bracket | Owner-occupied | Renter-occupied |
| Less than $5,000 | 9 (0.9%) | 32 (18.2%) |
| $5,000 to $9,999 | 22 (2.2%) | 0 (0.0%) |
| $10,000 to $14,999 | 42 (4.3%) | 19 (10.8%) |
| $15,000 to $19,999 | 13 (1.3%) | 2 (1.1%) |
| $20,000 to $24,999 | 6 (0.6%) | 0 (0.0%) |
| $25,000 to $34,999 | 55 (5.6%) | 27 (15.3%) |
| $35,000 to $49,999 | 129 (13.2%) | 54 (30.7%) |
| $50,000 to $74,999 | 123 (12.5%) | 23 (13.1%) |
| $75,000 to $99,999 | 245 (25.0%) | 0 (0.0%) |
| $100,000 to $149,999 | 201 (20.5%) | 19 (10.8%) |
| $150,000 or more | 136 (13.9%) | 0 (0.0%) |
| Total | 981 (100.0%) | 176 (100.0%) |
Monthly Housing Cost Tiers in Almont
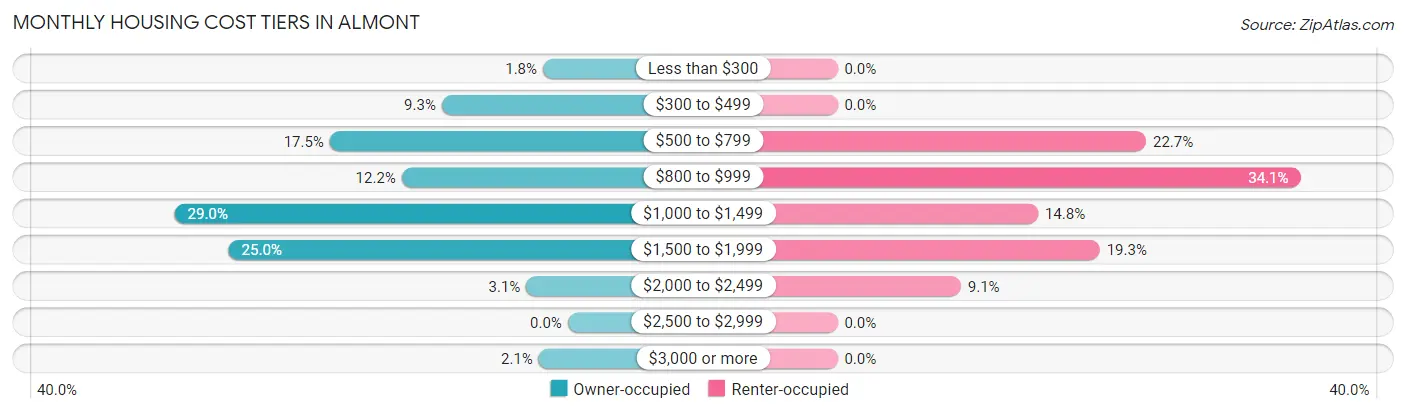
| Monthly Cost | Owner-occupied | Renter-occupied |
| Less than $300 | 18 (1.8%) | 0 (0.0%) |
| $300 to $499 | 91 (9.3%) | 0 (0.0%) |
| $500 to $799 | 172 (17.5%) | 40 (22.7%) |
| $800 to $999 | 120 (12.2%) | 60 (34.1%) |
| $1,000 to $1,499 | 284 (28.9%) | 26 (14.8%) |
| $1,500 to $1,999 | 245 (25.0%) | 34 (19.3%) |
| $2,000 to $2,499 | 30 (3.1%) | 16 (9.1%) |
| $2,500 to $2,999 | 0 (0.0%) | 0 (0.0%) |
| $3,000 or more | 21 (2.1%) | 0 (0.0%) |
| Total | 981 (100.0%) | 176 (100.0%) |
Physical Housing Characteristics in Almont
Housing Structures in Almont
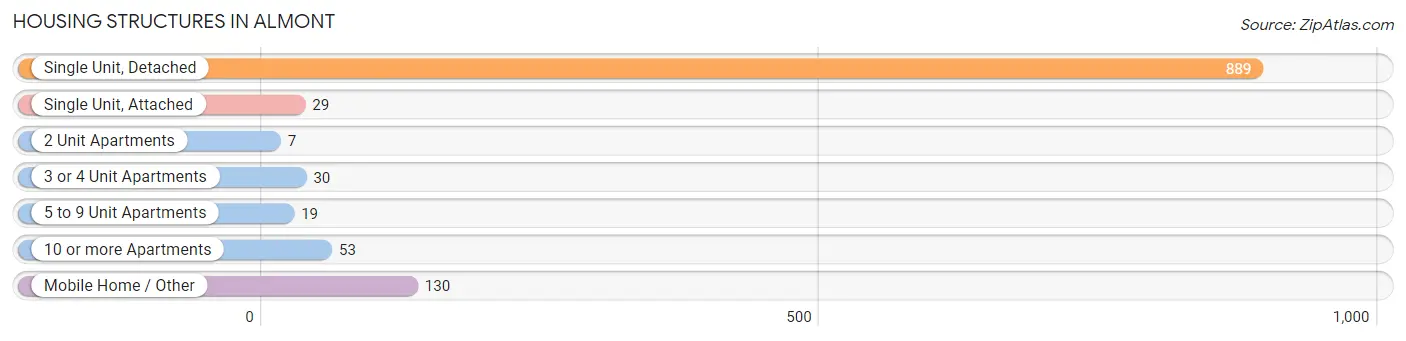
| Structure Type | # Housing Units | % Housing Units |
| Single Unit, Detached | 889 | 76.8% |
| Single Unit, Attached | 29 | 2.5% |
| 2 Unit Apartments | 7 | 0.6% |
| 3 or 4 Unit Apartments | 30 | 2.6% |
| 5 to 9 Unit Apartments | 19 | 1.6% |
| 10 or more Apartments | 53 | 4.6% |
| Mobile Home / Other | 130 | 11.2% |
| Total | 1,157 | 100.0% |
Housing Structures by Occupancy in Almont
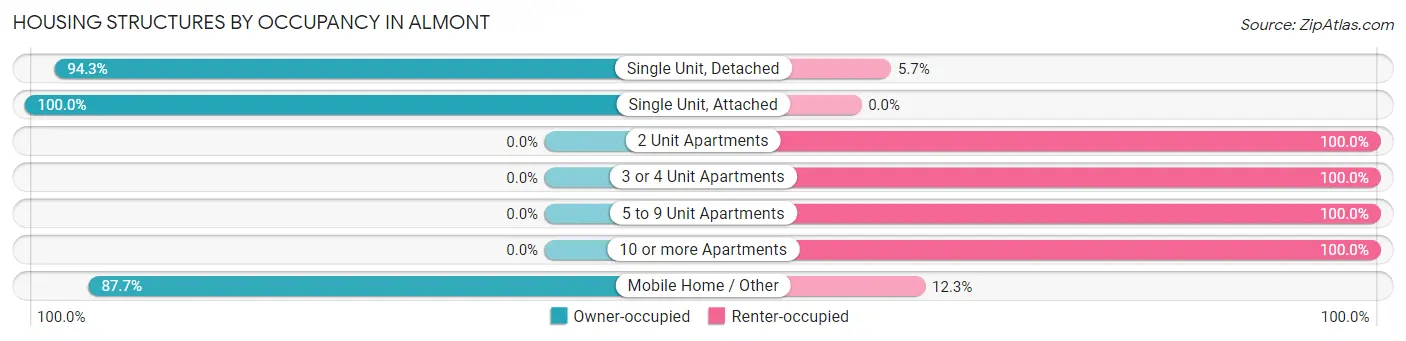
| Structure Type | Owner-occupied | Renter-occupied |
| Single Unit, Detached | 838 (94.3%) | 51 (5.7%) |
| Single Unit, Attached | 29 (100.0%) | 0 (0.0%) |
| 2 Unit Apartments | 0 (0.0%) | 7 (100.0%) |
| 3 or 4 Unit Apartments | 0 (0.0%) | 30 (100.0%) |
| 5 to 9 Unit Apartments | 0 (0.0%) | 19 (100.0%) |
| 10 or more Apartments | 0 (0.0%) | 53 (100.0%) |
| Mobile Home / Other | 114 (87.7%) | 16 (12.3%) |
| Total | 981 (84.8%) | 176 (15.2%) |
Housing Structures by Number of Rooms in Almont
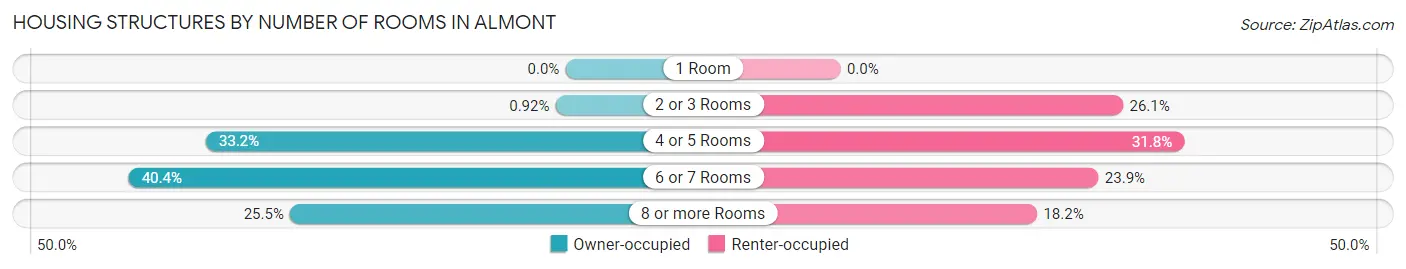
| Number of Rooms | Owner-occupied | Renter-occupied |
| 1 Room | 0 (0.0%) | 0 (0.0%) |
| 2 or 3 Rooms | 9 (0.9%) | 46 (26.1%) |
| 4 or 5 Rooms | 326 (33.2%) | 56 (31.8%) |
| 6 or 7 Rooms | 396 (40.4%) | 42 (23.9%) |
| 8 or more Rooms | 250 (25.5%) | 32 (18.2%) |
| Total | 981 (100.0%) | 176 (100.0%) |
Housing Structure by Heating Type in Almont
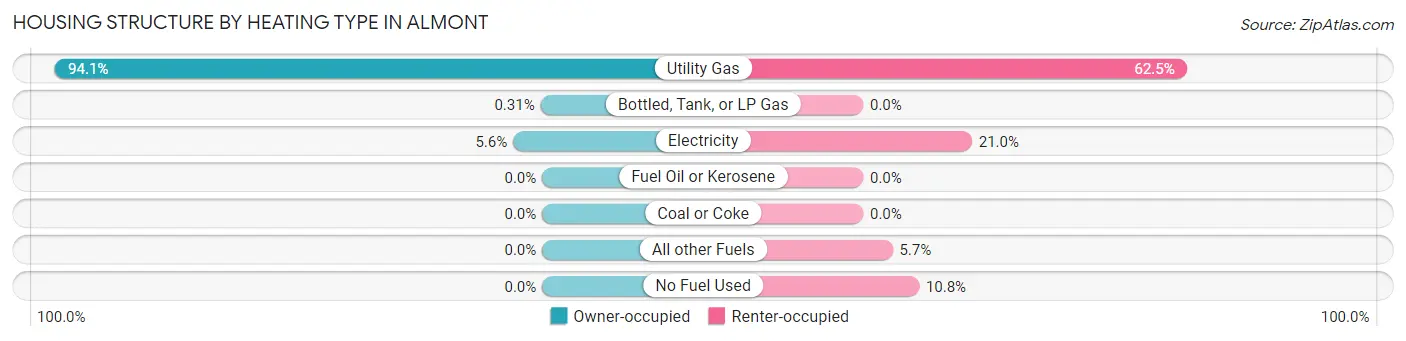
| Heating Type | Owner-occupied | Renter-occupied |
| Utility Gas | 923 (94.1%) | 110 (62.5%) |
| Bottled, Tank, or LP Gas | 3 (0.3%) | 0 (0.0%) |
| Electricity | 55 (5.6%) | 37 (21.0%) |
| Fuel Oil or Kerosene | 0 (0.0%) | 0 (0.0%) |
| Coal or Coke | 0 (0.0%) | 0 (0.0%) |
| All other Fuels | 0 (0.0%) | 10 (5.7%) |
| No Fuel Used | 0 (0.0%) | 19 (10.8%) |
| Total | 981 (100.0%) | 176 (100.0%) |
Household Vehicle Usage in Almont
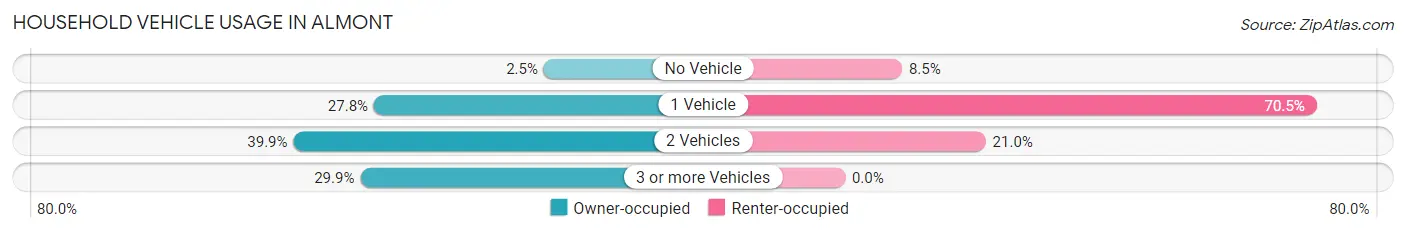
| Vehicles per Household | Owner-occupied | Renter-occupied |
| No Vehicle | 24 (2.5%) | 15 (8.5%) |
| 1 Vehicle | 273 (27.8%) | 124 (70.5%) |
| 2 Vehicles | 391 (39.9%) | 37 (21.0%) |
| 3 or more Vehicles | 293 (29.9%) | 0 (0.0%) |
| Total | 981 (100.0%) | 176 (100.0%) |
Real Estate & Mortgages in Almont
Real Estate and Mortgage Overview in Almont
| Characteristic | Without Mortgage | With Mortgage |
| Housing Units | 378 | 603 |
| Median Property Value | $222,400 | $219,500 |
| Median Household Income | $53,214 | $122 |
| Monthly Housing Costs | $651 | $21 |
| Real Estate Taxes | $3,138 | $75 |
Property Value by Mortgage Status in Almont
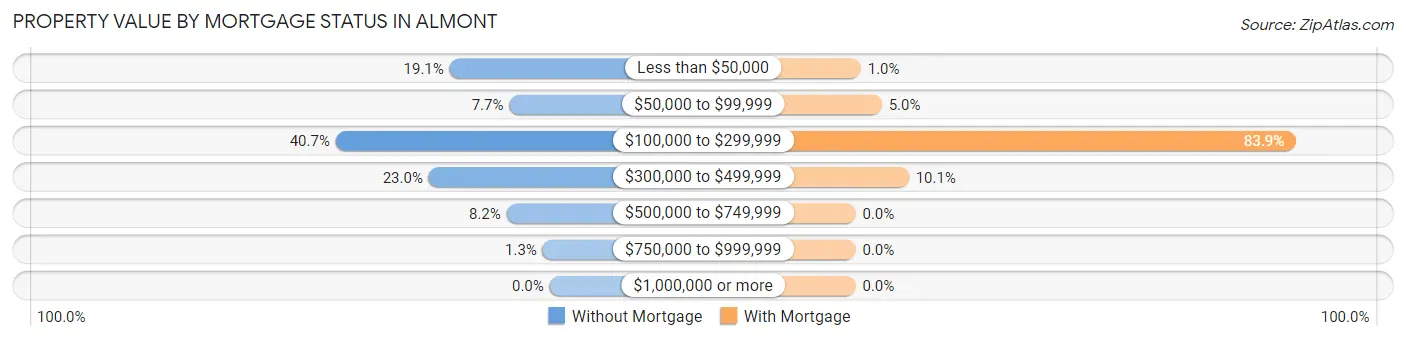
| Property Value | Without Mortgage | With Mortgage |
| Less than $50,000 | 72 (19.1%) | 6 (1.0%) |
| $50,000 to $99,999 | 29 (7.7%) | 30 (5.0%) |
| $100,000 to $299,999 | 154 (40.7%) | 506 (83.9%) |
| $300,000 to $499,999 | 87 (23.0%) | 61 (10.1%) |
| $500,000 to $749,999 | 31 (8.2%) | 0 (0.0%) |
| $750,000 to $999,999 | 5 (1.3%) | 0 (0.0%) |
| $1,000,000 or more | 0 (0.0%) | 0 (0.0%) |
| Total | 378 (100.0%) | 603 (100.0%) |
Household Income by Mortgage Status in Almont
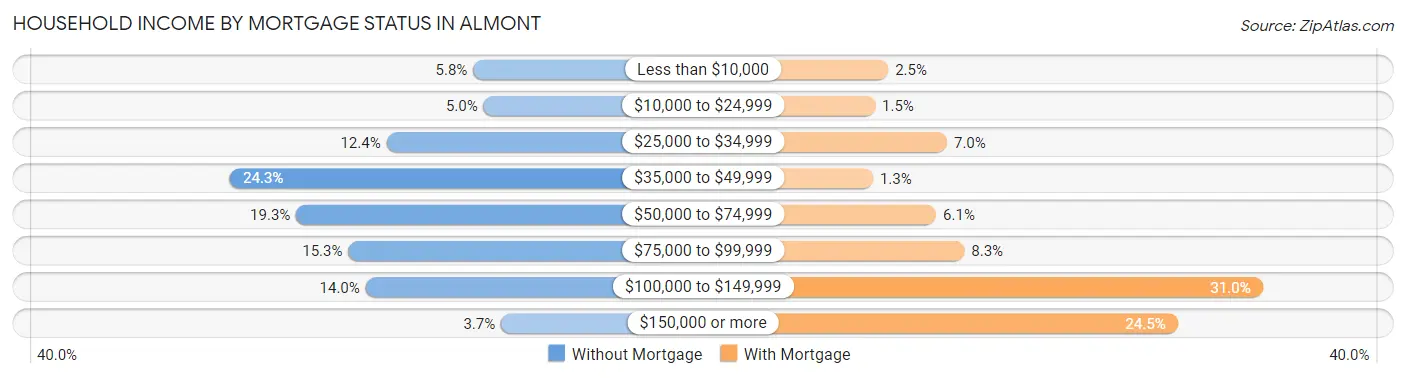
| Household Income | Without Mortgage | With Mortgage |
| Less than $10,000 | 22 (5.8%) | 15 (2.5%) |
| $10,000 to $24,999 | 19 (5.0%) | 9 (1.5%) |
| $25,000 to $34,999 | 47 (12.4%) | 42 (7.0%) |
| $35,000 to $49,999 | 92 (24.3%) | 8 (1.3%) |
| $50,000 to $74,999 | 73 (19.3%) | 37 (6.1%) |
| $75,000 to $99,999 | 58 (15.3%) | 50 (8.3%) |
| $100,000 to $149,999 | 53 (14.0%) | 187 (31.0%) |
| $150,000 or more | 14 (3.7%) | 148 (24.5%) |
| Total | 378 (100.0%) | 603 (100.0%) |
Property Value to Household Income Ratio in Almont
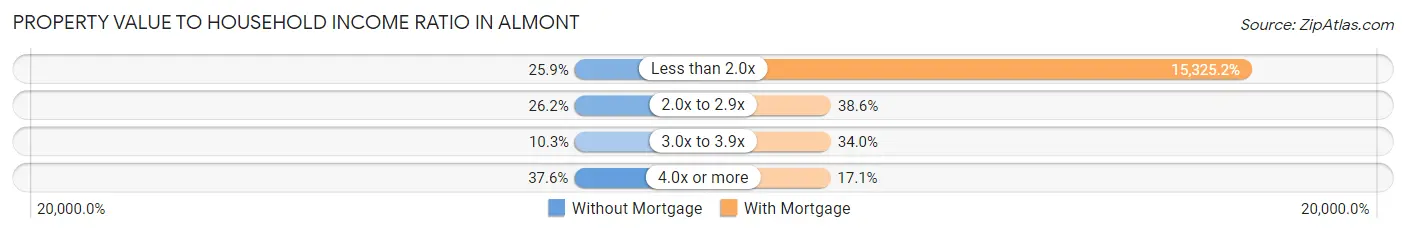
| Value-to-Income Ratio | Without Mortgage | With Mortgage |
| Less than 2.0x | 98 (25.9%) | 92,411 (15,325.2%) |
| 2.0x to 2.9x | 99 (26.2%) | 233 (38.6%) |
| 3.0x to 3.9x | 39 (10.3%) | 205 (34.0%) |
| 4.0x or more | 142 (37.6%) | 103 (17.1%) |
| Total | 378 (100.0%) | 603 (100.0%) |
Real Estate Taxes by Mortgage Status in Almont
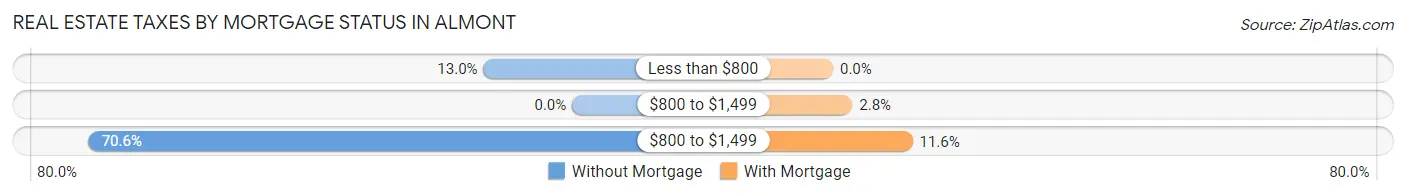
| Property Taxes | Without Mortgage | With Mortgage |
| Less than $800 | 49 (13.0%) | 0 (0.0%) |
| $800 to $1,499 | 0 (0.0%) | 17 (2.8%) |
| $800 to $1,499 | 267 (70.6%) | 70 (11.6%) |
| Total | 378 (100.0%) | 603 (100.0%) |
Health & Disability in Almont
Health Insurance Coverage by Age in Almont
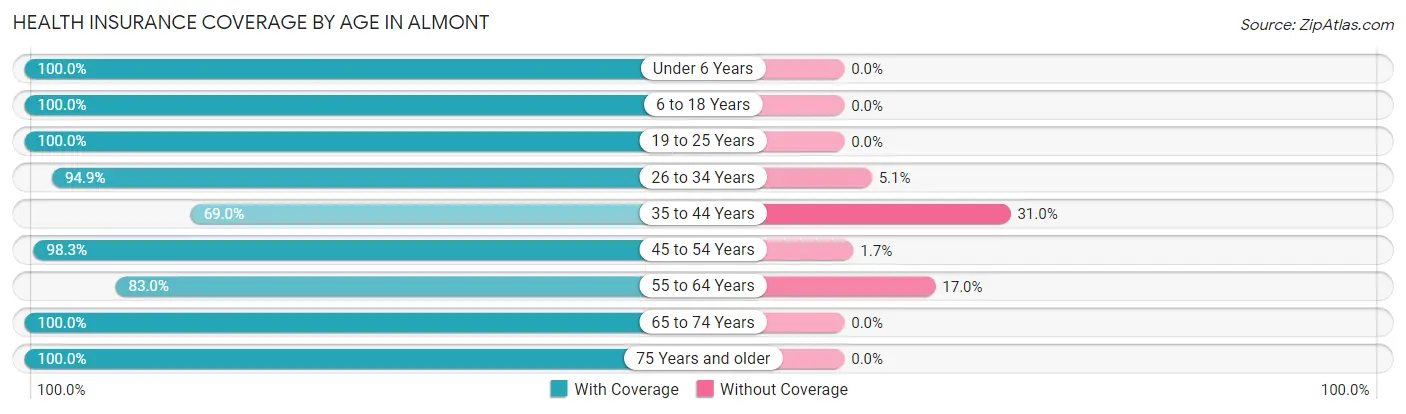
| Age Bracket | With Coverage | Without Coverage |
| Under 6 Years | 95 (100.0%) | 0 (0.0%) |
| 6 to 18 Years | 519 (100.0%) | 0 (0.0%) |
| 19 to 25 Years | 188 (100.0%) | 0 (0.0%) |
| 26 to 34 Years | 315 (94.9%) | 17 (5.1%) |
| 35 to 44 Years | 285 (69.0%) | 128 (31.0%) |
| 45 to 54 Years | 347 (98.3%) | 6 (1.7%) |
| 55 to 64 Years | 396 (83.0%) | 81 (17.0%) |
| 65 to 74 Years | 317 (100.0%) | 0 (0.0%) |
| 75 Years and older | 132 (100.0%) | 0 (0.0%) |
| Total | 2,594 (91.8%) | 232 (8.2%) |
Health Insurance Coverage by Citizenship Status in Almont

| Citizenship Status | With Coverage | Without Coverage |
| Native Born | 95 (100.0%) | 0 (0.0%) |
| Foreign Born, Citizen | 519 (100.0%) | 0 (0.0%) |
| Foreign Born, not a Citizen | 188 (100.0%) | 0 (0.0%) |
Health Insurance Coverage by Household Income in Almont
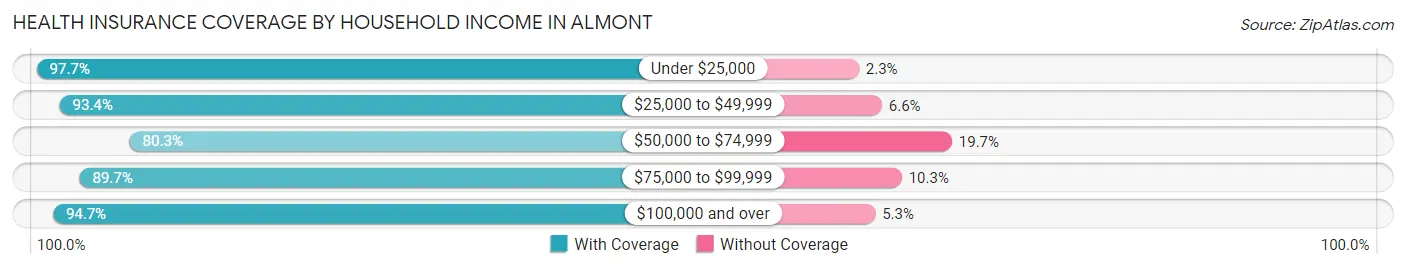
| Household Income | With Coverage | Without Coverage |
| Under $25,000 | 259 (97.7%) | 6 (2.3%) |
| $25,000 to $49,999 | 398 (93.4%) | 28 (6.6%) |
| $50,000 to $74,999 | 261 (80.3%) | 64 (19.7%) |
| $75,000 to $99,999 | 680 (89.7%) | 78 (10.3%) |
| $100,000 and over | 996 (94.7%) | 56 (5.3%) |
Public vs Private Health Insurance Coverage by Age in Almont
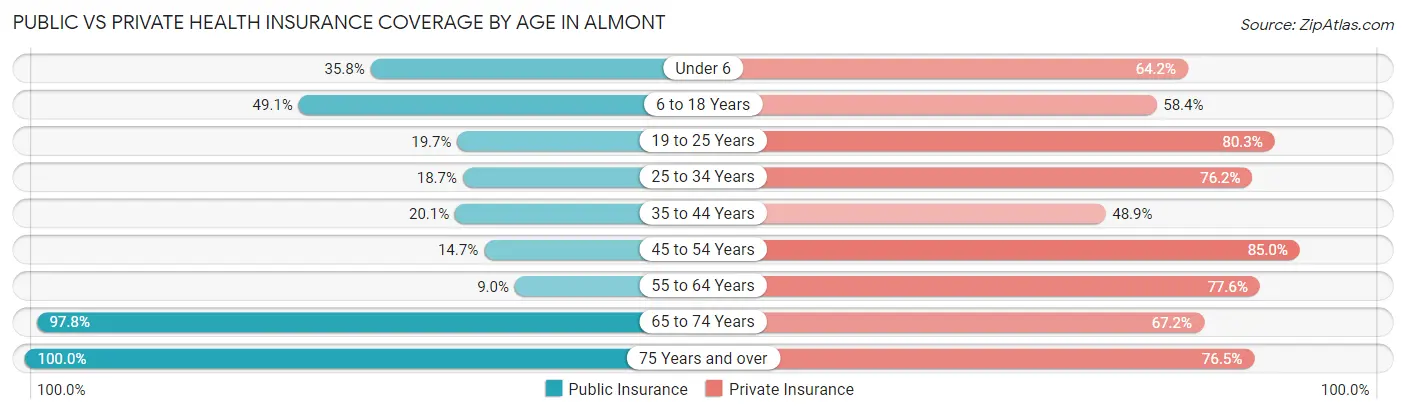
| Age Bracket | Public Insurance | Private Insurance |
| Under 6 | 34 (35.8%) | 61 (64.2%) |
| 6 to 18 Years | 255 (49.1%) | 303 (58.4%) |
| 19 to 25 Years | 37 (19.7%) | 151 (80.3%) |
| 25 to 34 Years | 62 (18.7%) | 253 (76.2%) |
| 35 to 44 Years | 83 (20.1%) | 202 (48.9%) |
| 45 to 54 Years | 52 (14.7%) | 300 (85.0%) |
| 55 to 64 Years | 43 (9.0%) | 370 (77.6%) |
| 65 to 74 Years | 310 (97.8%) | 213 (67.2%) |
| 75 Years and over | 132 (100.0%) | 101 (76.5%) |
| Total | 1,008 (35.7%) | 1,954 (69.1%) |
Disability Status by Sex by Age in Almont
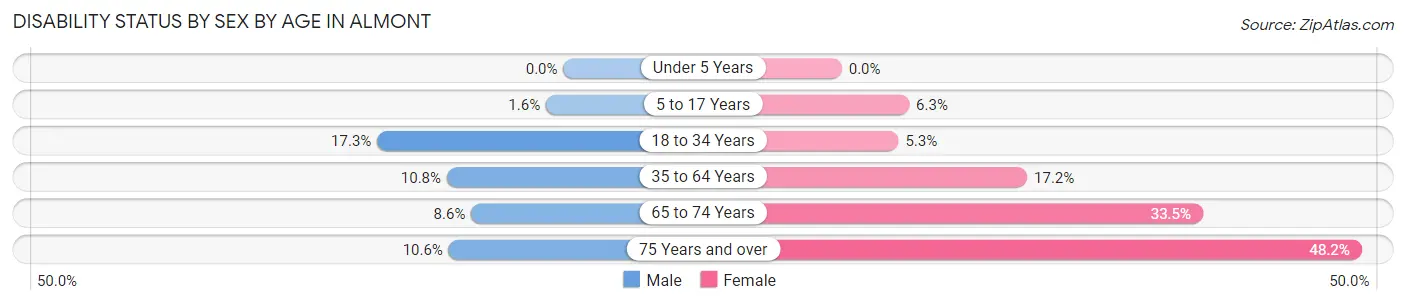
| Age Bracket | Male | Female |
| Under 5 Years | 0 (0.0%) | 0 (0.0%) |
| 5 to 17 Years | 4 (1.6%) | 13 (6.2%) |
| 18 to 34 Years | 66 (17.3%) | 12 (5.3%) |
| 35 to 64 Years | 64 (10.8%) | 112 (17.2%) |
| 65 to 74 Years | 10 (8.6%) | 67 (33.5%) |
| 75 Years and over | 5 (10.6%) | 41 (48.2%) |
Disability Class by Sex by Age in Almont
Disability Class: Hearing Difficulty
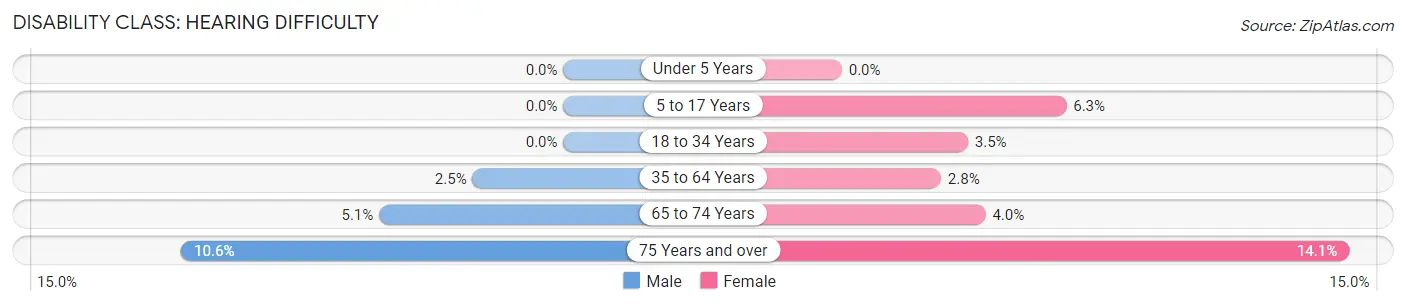
| Age Bracket | Male | Female |
| Under 5 Years | 0 (0.0%) | 0 (0.0%) |
| 5 to 17 Years | 0 (0.0%) | 13 (6.2%) |
| 18 to 34 Years | 0 (0.0%) | 8 (3.5%) |
| 35 to 64 Years | 15 (2.5%) | 18 (2.8%) |
| 65 to 74 Years | 6 (5.1%) | 8 (4.0%) |
| 75 Years and over | 5 (10.6%) | 12 (14.1%) |
Disability Class: Vision Difficulty
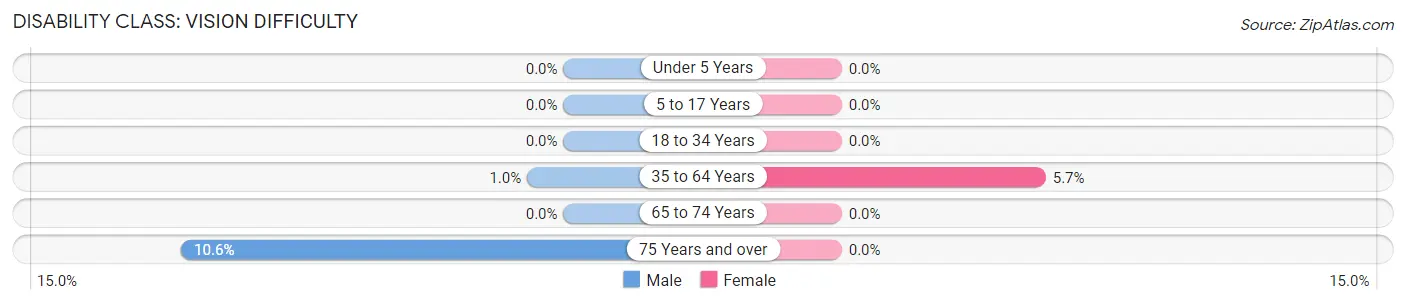
| Age Bracket | Male | Female |
| Under 5 Years | 0 (0.0%) | 0 (0.0%) |
| 5 to 17 Years | 0 (0.0%) | 0 (0.0%) |
| 18 to 34 Years | 0 (0.0%) | 0 (0.0%) |
| 35 to 64 Years | 6 (1.0%) | 37 (5.7%) |
| 65 to 74 Years | 0 (0.0%) | 0 (0.0%) |
| 75 Years and over | 5 (10.6%) | 0 (0.0%) |
Disability Class: Cognitive Difficulty
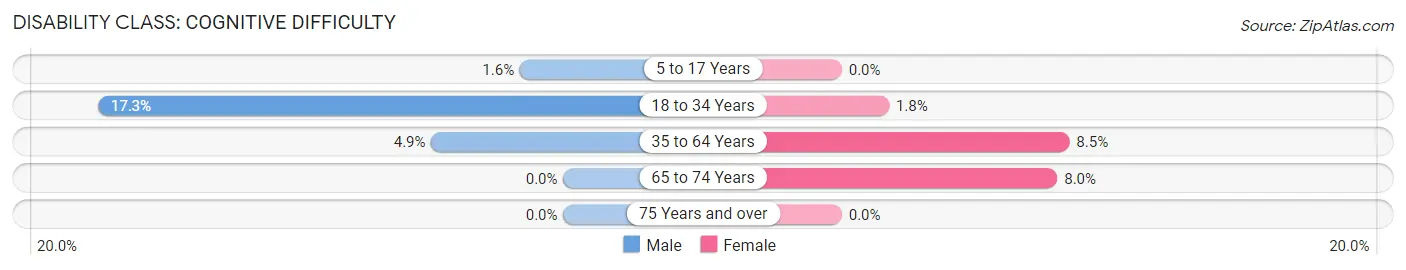
| Age Bracket | Male | Female |
| 5 to 17 Years | 4 (1.6%) | 0 (0.0%) |
| 18 to 34 Years | 66 (17.3%) | 4 (1.8%) |
| 35 to 64 Years | 29 (4.9%) | 55 (8.5%) |
| 65 to 74 Years | 0 (0.0%) | 16 (8.0%) |
| 75 Years and over | 0 (0.0%) | 0 (0.0%) |
Disability Class: Ambulatory Difficulty
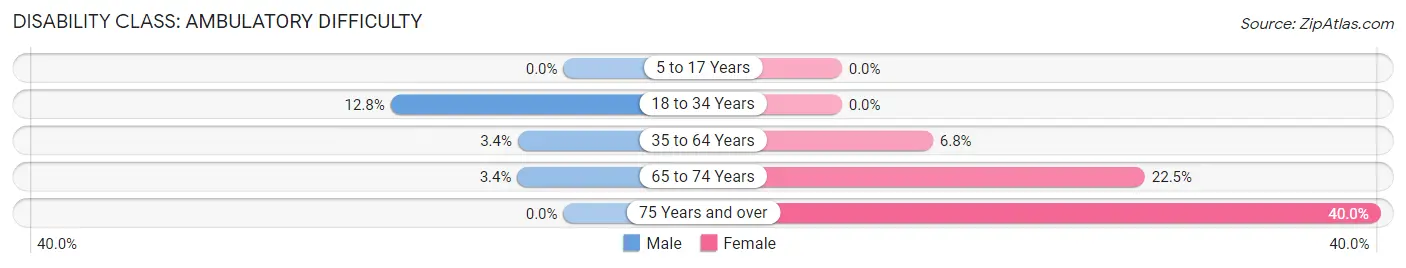
| Age Bracket | Male | Female |
| 5 to 17 Years | 0 (0.0%) | 0 (0.0%) |
| 18 to 34 Years | 49 (12.8%) | 0 (0.0%) |
| 35 to 64 Years | 20 (3.4%) | 44 (6.8%) |
| 65 to 74 Years | 4 (3.4%) | 45 (22.5%) |
| 75 Years and over | 0 (0.0%) | 34 (40.0%) |
Disability Class: Self-Care Difficulty
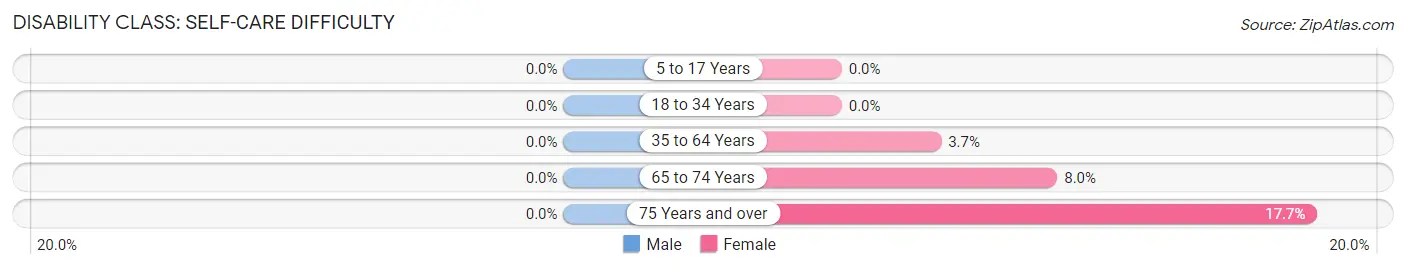
| Age Bracket | Male | Female |
| 5 to 17 Years | 0 (0.0%) | 0 (0.0%) |
| 18 to 34 Years | 0 (0.0%) | 0 (0.0%) |
| 35 to 64 Years | 0 (0.0%) | 24 (3.7%) |
| 65 to 74 Years | 0 (0.0%) | 16 (8.0%) |
| 75 Years and over | 0 (0.0%) | 15 (17.6%) |
Technology Access in Almont
Computing Device Access in Almont
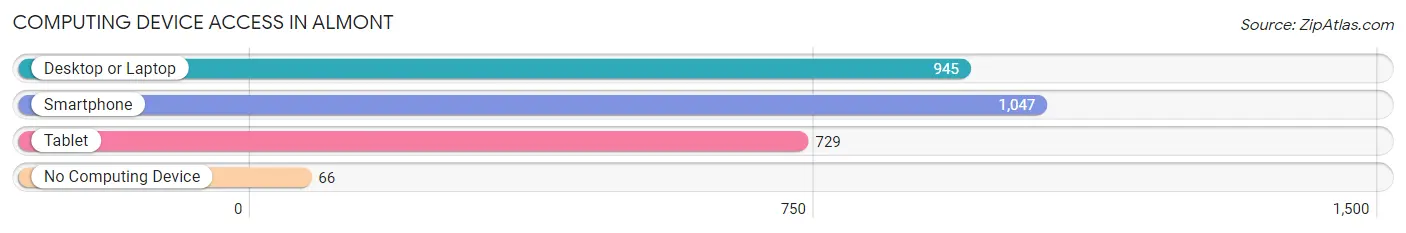
| Device Type | # Households | % Households |
| Desktop or Laptop | 945 | 81.7% |
| Smartphone | 1,047 | 90.5% |
| Tablet | 729 | 63.0% |
| No Computing Device | 66 | 5.7% |
| Total | 1,157 | 100.0% |
Internet Access in Almont
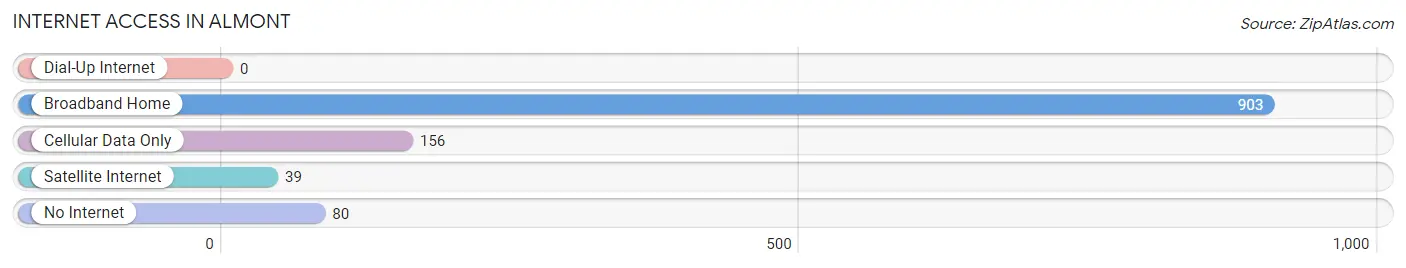
| Internet Type | # Households | % Households |
| Dial-Up Internet | 0 | 0.0% |
| Broadband Home | 903 | 78.0% |
| Cellular Data Only | 156 | 13.5% |
| Satellite Internet | 39 | 3.4% |
| No Internet | 80 | 6.9% |
| Total | 1,157 | 100.0% |
Almont Summary
Almont, Michigan is a small village located in Lapeer County, Michigan. It is situated on the banks of the North Branch of the Flint River, approximately 25 miles north of Detroit. The village has a population of 1,717 people, according to the 2010 census.
History
Almont was first settled in 1837 by a group of settlers from New York. The village was originally known as "Almont Center" and was named after the Almont family, who were among the first settlers. The village was incorporated in 1867.
In the late 19th century, Almont was a thriving agricultural community. The village was home to several mills, including a grist mill, a saw mill, and a woolen mill. The village also had a blacksmith shop, a general store, and a post office.
In the early 20th century, Almont began to experience a decline in population as many of its residents moved away to larger cities. The village was also affected by the Great Depression, which caused many businesses to close.
Geography
Almont is located in the southeastern corner of Lapeer County, Michigan. The village is situated on the banks of the North Branch of the Flint River, approximately 25 miles north of Detroit. The village is surrounded by farmland and is located near the towns of Imlay City and Dryden.
The village has a total area of 1.2 square miles, all of which is land. The terrain is mostly flat, with some rolling hills. The village is located in a humid continental climate zone, with hot summers and cold winters.
Economy
Almont's economy is largely based on agriculture. The village is home to several farms, which produce a variety of crops, including corn, soybeans, wheat, and hay. The village also has several small businesses, including a grocery store, a hardware store, and a restaurant.
The village is also home to several manufacturing companies, including a plastics manufacturer and a metal fabrication company. The village is also home to a number of small businesses, including a bakery, a florist, and a furniture store.
Demographics
According to the 2010 census, Almont has a population of 1,717 people. The village has a median household income of $45,000 and a median home value of $125,000. The village is predominantly white, with a small percentage of African American and Hispanic residents.
The village has a high school graduation rate of 95%, and a college attendance rate of 40%. The village also has a low unemployment rate of 4.2%.
Conclusion
Almont, Michigan is a small village located in Lapeer County, Michigan. It is situated on the banks of the North Branch of the Flint River, approximately 25 miles north of Detroit. The village has a population of 1,717 people, according to the 2010 census. The village has a predominantly white population, with a small percentage of African American and Hispanic residents. The village has a median household income of $45,000 and a median home value of $125,000. The village is home to several farms, which produce a variety of crops, as well as several small businesses. The village also has a high school graduation rate of 95%, and a college attendance rate of 40%. Almont is a small, rural village with a strong sense of community and a rich history.
Common Questions
What is Per Capita Income in Almont?
Per Capita income in Almont is $34,857.
What is the Median Family Income in Almont?
Median Family Income in Almont is $84,856.
What is the Median Household income in Almont?
Median Household Income in Almont is $76,607.
What is Income or Wage Gap in Almont?
Income or Wage Gap in Almont is 46.5%.
Women in Almont earn 53.5 cents for every dollar earned by a man.
What is Inequality or Gini Index in Almont?
Inequality or Gini Index in Almont is 0.39.
What is the Total Population of Almont?
Total Population of Almont is 2,826.
What is the Total Male Population of Almont?
Total Male Population of Almont is 1,419.
What is the Total Female Population of Almont?
Total Female Population of Almont is 1,407.
What is the Ratio of Males per 100 Females in Almont?
There are 100.85 Males per 100 Females in Almont.
What is the Ratio of Females per 100 Males in Almont?
There are 99.15 Females per 100 Males in Almont.
What is the Median Population Age in Almont?
Median Population Age in Almont is 42.6 Years.
What is the Average Family Size in Almont
Average Family Size in Almont is 2.9 People.
What is the Average Household Size in Almont
Average Household Size in Almont is 2.4 People.
How Large is the Labor Force in Almont?
There are 1,576 People in the Labor Forcein in Almont.
What is the Percentage of People in the Labor Force in Almont?
66.3% of People are in the Labor Force in Almont.
What is the Unemployment Rate in Almont?
Unemployment Rate in Almont is 8.6%.