Auburn Hills, MI Map & Demographics
Auburn Hills Map
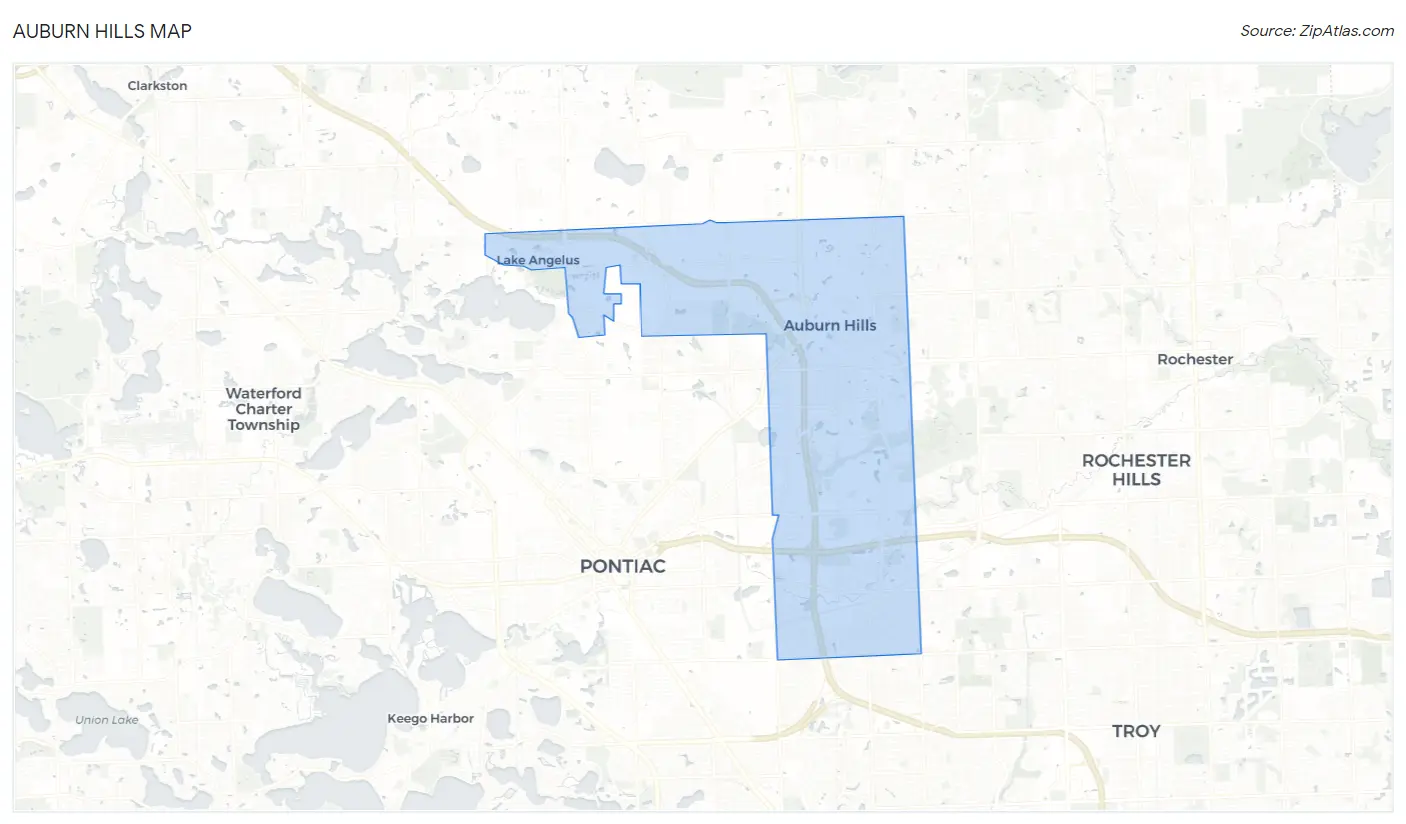
Auburn Hills Overview
$44,309
PER CAPITA INCOME
$99,800
AVG FAMILY INCOME
$77,724
AVG HOUSEHOLD INCOME
44.7%
WAGE / INCOME GAP [ % ]
55.3¢/ $1
WAGE / INCOME GAP [ $ ]
0.42
INEQUALITY / GINI INDEX
24,593
TOTAL POPULATION
12,420
MALE POPULATION
12,173
FEMALE POPULATION
102.03
MALES / 100 FEMALES
98.01
FEMALES / 100 MALES
35.2
MEDIAN AGE
2.9
AVG FAMILY SIZE
2.1
AVG HOUSEHOLD SIZE
14,876
LABOR FORCE [ PEOPLE ]
69.1%
PERCENT IN LABOR FORCE
5.1%
UNEMPLOYMENT RATE
Auburn Hills Zip Codes
Auburn Hills Area Codes
Income in Auburn Hills
Income Overview in Auburn Hills
Per Capita Income in Auburn Hills is $44,309, while median incomes of families and households are $99,800 and $77,724 respectively.
| Characteristic | Number | Measure |
| Per Capita Income | 24,593 | $44,309 |
| Median Family Income | 5,374 | $99,800 |
| Mean Family Income | 5,374 | $120,178 |
| Median Household Income | 11,181 | $77,724 |
| Mean Household Income | 11,181 | $95,438 |
| Income Deficit | 5,374 | $0 |
| Wage / Income Gap (%) | 24,593 | 44.69% |
| Wage / Income Gap ($) | 24,593 | 55.31¢ per $1 |
| Gini / Inequality Index | 24,593 | 0.42 |
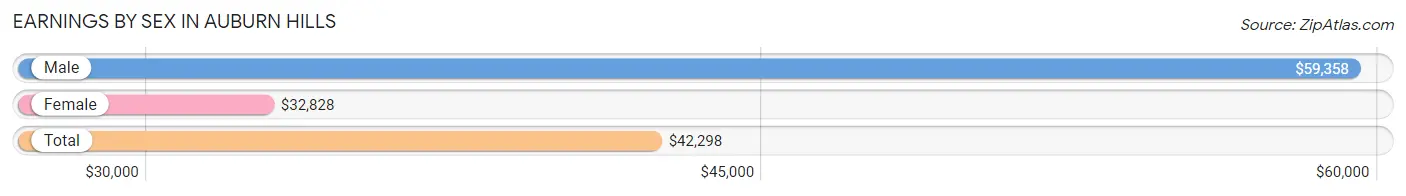
Earnings by Sex in Auburn Hills
Average Earnings in Auburn Hills are $42,298, $59,358 for men and $32,828 for women, a difference of 44.7%.
| Sex | Number | Average Earnings |
| Male | 8,565 (54.7%) | $59,358 |
| Female | 7,087 (45.3%) | $32,828 |
| Total | 15,652 (100.0%) | $42,298 |
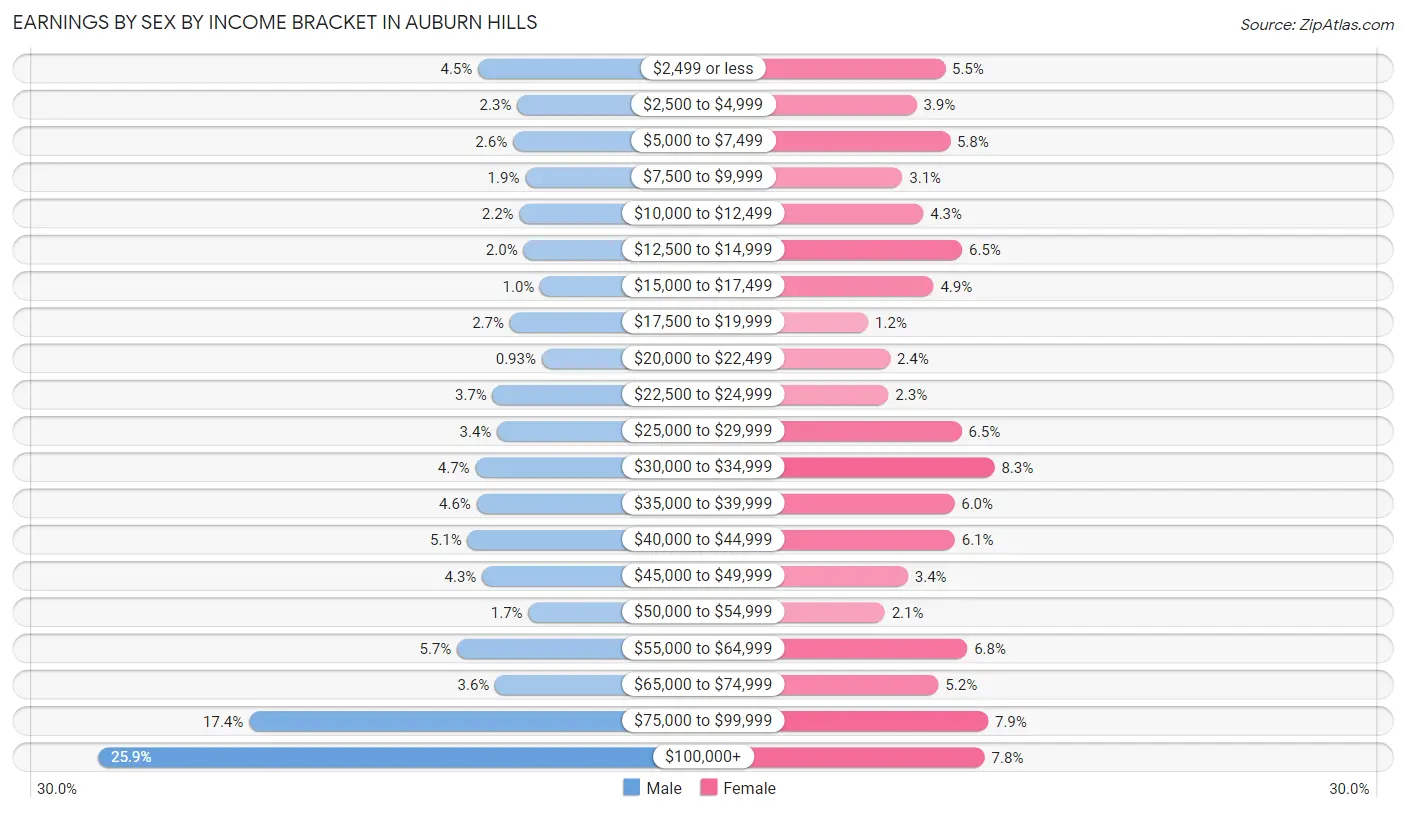
Earnings by Sex by Income Bracket in Auburn Hills
The most common earnings brackets in Auburn Hills are $100,000+ for men (2,216 | 25.9%) and $30,000 to $34,999 for women (588 | 8.3%).
| Income | Male | Female |
| $2,499 or less | 386 (4.5%) | 391 (5.5%) |
| $2,500 to $4,999 | 198 (2.3%) | 278 (3.9%) |
| $5,000 to $7,499 | 218 (2.5%) | 411 (5.8%) |
| $7,500 to $9,999 | 159 (1.9%) | 221 (3.1%) |
| $10,000 to $12,499 | 188 (2.2%) | 305 (4.3%) |
| $12,500 to $14,999 | 168 (2.0%) | 459 (6.5%) |
| $15,000 to $17,499 | 87 (1.0%) | 345 (4.9%) |
| $17,500 to $19,999 | 234 (2.7%) | 85 (1.2%) |
| $20,000 to $22,499 | 80 (0.9%) | 172 (2.4%) |
| $22,500 to $24,999 | 316 (3.7%) | 166 (2.3%) |
| $25,000 to $29,999 | 295 (3.4%) | 457 (6.5%) |
| $30,000 to $34,999 | 399 (4.7%) | 588 (8.3%) |
| $35,000 to $39,999 | 393 (4.6%) | 428 (6.0%) |
| $40,000 to $44,999 | 437 (5.1%) | 430 (6.1%) |
| $45,000 to $49,999 | 367 (4.3%) | 243 (3.4%) |
| $50,000 to $54,999 | 144 (1.7%) | 151 (2.1%) |
| $55,000 to $64,999 | 487 (5.7%) | 480 (6.8%) |
| $65,000 to $74,999 | 304 (3.5%) | 365 (5.1%) |
| $75,000 to $99,999 | 1,489 (17.4%) | 563 (7.9%) |
| $100,000+ | 2,216 (25.9%) | 549 (7.7%) |
| Total | 8,565 (100.0%) | 7,087 (100.0%) |
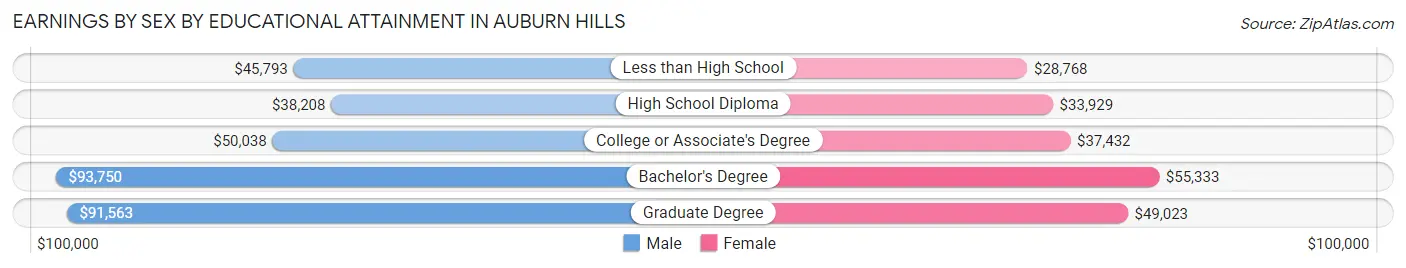
Earnings by Sex by Educational Attainment in Auburn Hills
Average earnings in Auburn Hills are $75,616 for men and $39,387 for women, a difference of 47.9%. Men with an educational attainment of bachelor's degree enjoy the highest average annual earnings of $93,750, while those with high school diploma education earn the least with $38,208. Women with an educational attainment of bachelor's degree earn the most with the average annual earnings of $55,333, while those with less than high school education have the smallest earnings of $28,768.
| Educational Attainment | Male Income | Female Income |
| Less than High School | $45,793 | $28,768 |
| High School Diploma | $38,208 | $33,929 |
| College or Associate's Degree | $50,038 | $37,432 |
| Bachelor's Degree | $93,750 | $55,333 |
| Graduate Degree | $91,563 | $49,023 |
| Total | $75,616 | $39,387 |
Family Income in Auburn Hills
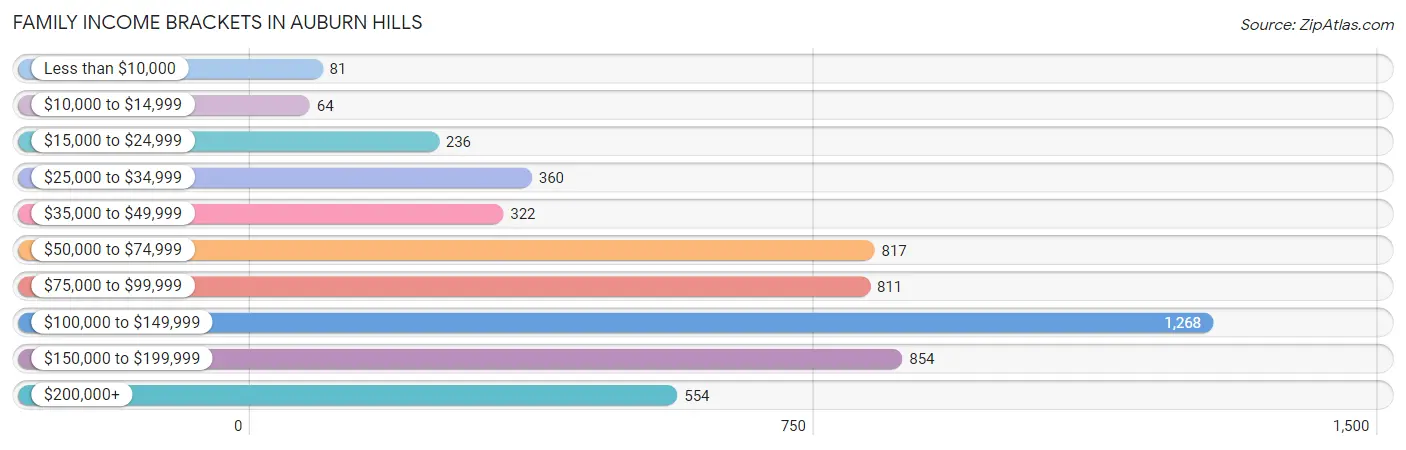
Family Income Brackets in Auburn Hills
According to the Auburn Hills family income data, there are 1,268 families falling into the $100,000 to $149,999 income range, which is the most common income bracket and makes up 23.6% of all families. Conversely, the $10,000 to $14,999 income bracket is the least frequent group with only 64 families (1.2%) belonging to this category.
| Income Bracket | # Families | % Families |
| Less than $10,000 | 81 | 1.5% |
| $10,000 to $14,999 | 64 | 1.2% |
| $15,000 to $24,999 | 236 | 4.4% |
| $25,000 to $34,999 | 360 | 6.7% |
| $35,000 to $49,999 | 322 | 6.0% |
| $50,000 to $74,999 | 817 | 15.2% |
| $75,000 to $99,999 | 811 | 15.1% |
| $100,000 to $149,999 | 1,268 | 23.6% |
| $150,000 to $199,999 | 854 | 15.9% |
| $200,000+ | 554 | 10.3% |
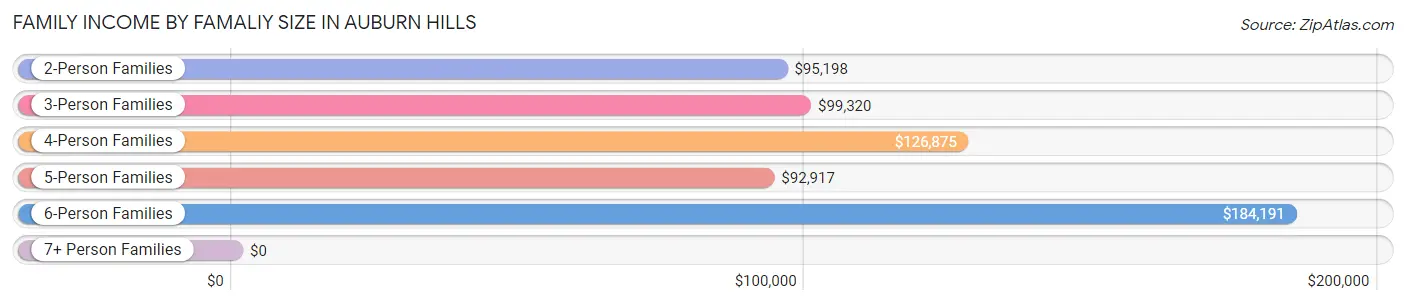
Family Income by Famaliy Size in Auburn Hills
6-person families (125 | 2.3%) account for the highest median family income in Auburn Hills with $184,191 per family, while 2-person families (2,928 | 54.5%) have the highest median income of $47,599 per family member.
| Income Bracket | # Families | Median Income |
| 2-Person Families | 2,928 (54.5%) | $95,198 |
| 3-Person Families | 1,353 (25.2%) | $99,320 |
| 4-Person Families | 705 (13.1%) | $126,875 |
| 5-Person Families | 208 (3.9%) | $92,917 |
| 6-Person Families | 125 (2.3%) | $184,191 |
| 7+ Person Families | 55 (1.0%) | $0 |
| Total | 5,374 (100.0%) | $99,800 |
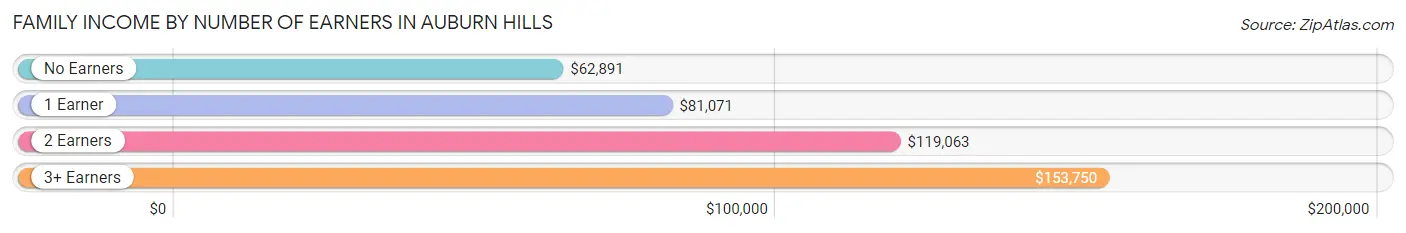
Family Income by Number of Earners in Auburn Hills
The median family income in Auburn Hills is $99,800, with families comprising 3+ earners (547) having the highest median family income of $153,750, while families with no earners (656) have the lowest median family income of $62,891, accounting for 10.2% and 12.2% of families, respectively.
| Number of Earners | # Families | Median Income |
| No Earners | 656 (12.2%) | $62,891 |
| 1 Earner | 1,712 (31.9%) | $81,071 |
| 2 Earners | 2,459 (45.8%) | $119,063 |
| 3+ Earners | 547 (10.2%) | $153,750 |
| Total | 5,374 (100.0%) | $99,800 |
Household Income in Auburn Hills
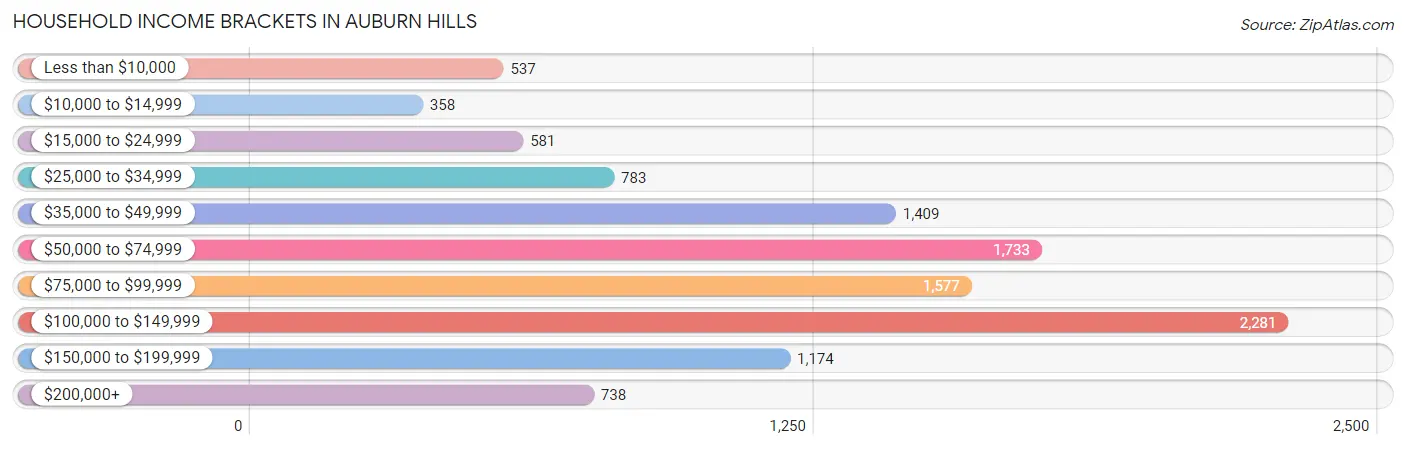
Household Income Brackets in Auburn Hills
With 2,281 households falling in the category, the $100,000 to $149,999 income range is the most frequent in Auburn Hills, accounting for 20.4% of all households. In contrast, only 358 households (3.2%) fall into the $10,000 to $14,999 income bracket, making it the least populous group.
| Income Bracket | # Households | % Households |
| Less than $10,000 | 537 | 4.8% |
| $10,000 to $14,999 | 358 | 3.2% |
| $15,000 to $24,999 | 581 | 5.2% |
| $25,000 to $34,999 | 783 | 7.0% |
| $35,000 to $49,999 | 1,409 | 12.6% |
| $50,000 to $74,999 | 1,733 | 15.5% |
| $75,000 to $99,999 | 1,577 | 14.1% |
| $100,000 to $149,999 | 2,281 | 20.4% |
| $150,000 to $199,999 | 1,174 | 10.5% |
| $200,000+ | 738 | 6.6% |
Household Income by Householder Age in Auburn Hills
The median household income in Auburn Hills is $77,724, with the highest median household income of $103,277 found in the 45 to 64 years age bracket for the primary householder. A total of 3,210 households (28.7%) fall into this category. Meanwhile, the 65+ years age bracket for the primary householder has the lowest median household income of $48,490, with 2,547 households (22.8%) in this group.
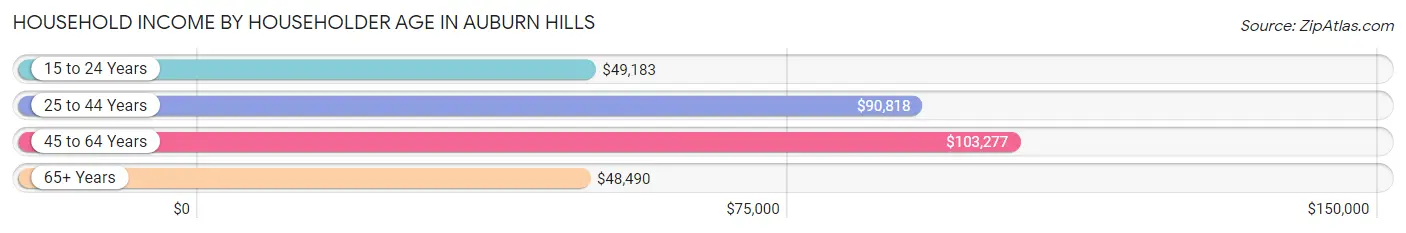
| Income Bracket | # Households | Median Income |
| 15 to 24 Years | 750 (6.7%) | $49,183 |
| 25 to 44 Years | 4,674 (41.8%) | $90,818 |
| 45 to 64 Years | 3,210 (28.7%) | $103,277 |
| 65+ Years | 2,547 (22.8%) | $48,490 |
| Total | 11,181 (100.0%) | $77,724 |
Poverty in Auburn Hills
Income Below Poverty by Sex and Age in Auburn Hills
With 10.3% poverty level for males and 12.8% for females among the residents of Auburn Hills, 15 year old males and 15 year old females are the most vulnerable to poverty, with 46 males (38.3%) and 39 females (61.9%) in their respective age groups living below the poverty level.
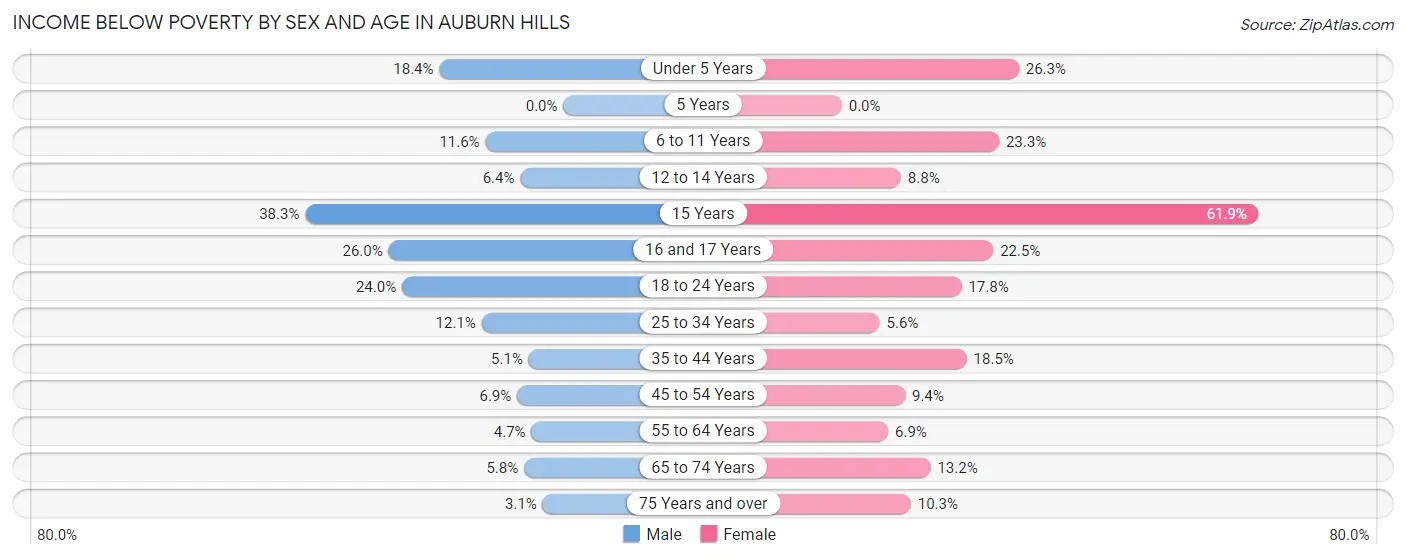
| Age Bracket | Male | Female |
| Under 5 Years | 79 (18.4%) | 169 (26.3%) |
| 5 Years | 0 (0.0%) | 0 (0.0%) |
| 6 to 11 Years | 50 (11.6%) | 109 (23.3%) |
| 12 to 14 Years | 28 (6.4%) | 28 (8.8%) |
| 15 Years | 46 (38.3%) | 39 (61.9%) |
| 16 and 17 Years | 27 (26.0%) | 69 (22.5%) |
| 18 to 24 Years | 335 (24.0%) | 247 (17.8%) |
| 25 to 34 Years | 349 (12.1%) | 128 (5.6%) |
| 35 to 44 Years | 101 (5.1%) | 224 (18.5%) |
| 45 to 54 Years | 83 (6.9%) | 136 (9.4%) |
| 55 to 64 Years | 61 (4.7%) | 106 (6.9%) |
| 65 to 74 Years | 60 (5.8%) | 158 (13.2%) |
| 75 Years and over | 20 (3.1%) | 78 (10.2%) |
| Total | 1,239 (10.3%) | 1,491 (12.8%) |
Income Above Poverty by Sex and Age in Auburn Hills
According to the poverty statistics in Auburn Hills, males aged 5 years and females aged 5 years are the age groups that are most secure financially, with 100.0% of males and 100.0% of females in these age groups living above the poverty line.
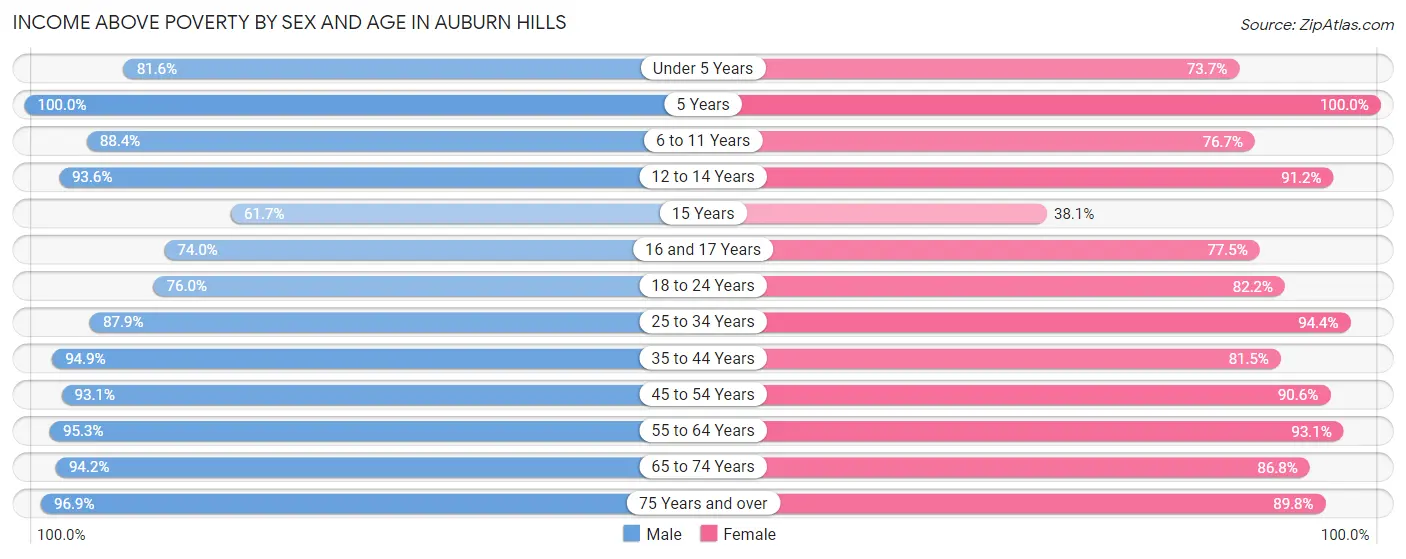
| Age Bracket | Male | Female |
| Under 5 Years | 350 (81.6%) | 474 (73.7%) |
| 5 Years | 112 (100.0%) | 42 (100.0%) |
| 6 to 11 Years | 382 (88.4%) | 358 (76.7%) |
| 12 to 14 Years | 410 (93.6%) | 291 (91.2%) |
| 15 Years | 74 (61.7%) | 24 (38.1%) |
| 16 and 17 Years | 77 (74.0%) | 238 (77.5%) |
| 18 to 24 Years | 1,063 (76.0%) | 1,143 (82.2%) |
| 25 to 34 Years | 2,525 (87.9%) | 2,153 (94.4%) |
| 35 to 44 Years | 1,864 (94.9%) | 984 (81.5%) |
| 45 to 54 Years | 1,126 (93.1%) | 1,312 (90.6%) |
| 55 to 64 Years | 1,227 (95.3%) | 1,435 (93.1%) |
| 65 to 74 Years | 969 (94.2%) | 1,042 (86.8%) |
| 75 Years and over | 632 (96.9%) | 683 (89.7%) |
| Total | 10,811 (89.7%) | 10,179 (87.2%) |
Income Below Poverty Among Married-Couple Families in Auburn Hills
The poverty statistics for married-couple families in Auburn Hills show that 3.2% or 125 of the total 3,868 families live below the poverty line. Families with 5 or more children have the highest poverty rate of 29.1%, comprising of 16 families. On the other hand, families with no children have the lowest poverty rate of 1.5%, which includes 36 families.
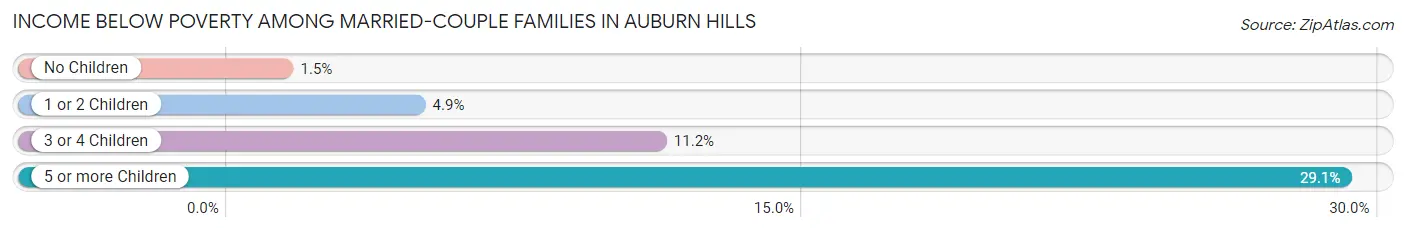
| Children | Above Poverty | Below Poverty |
| No Children | 2,448 (98.6%) | 36 (1.5%) |
| 1 or 2 Children | 1,145 (95.1%) | 59 (4.9%) |
| 3 or 4 Children | 111 (88.8%) | 14 (11.2%) |
| 5 or more Children | 39 (70.9%) | 16 (29.1%) |
| Total | 3,743 (96.8%) | 125 (3.2%) |
Income Below Poverty Among Single-Parent Households in Auburn Hills
According to the poverty data in Auburn Hills, 3.7% or 15 single-father households and 19.6% or 216 single-mother households are living below the poverty line. Among single-father households, those with no children have the highest poverty rate, with 15 households (5.1%) experiencing poverty. Likewise, among single-mother households, those with 5 or more children have the highest poverty rate, with 10 households (100.0%) falling below the poverty line.
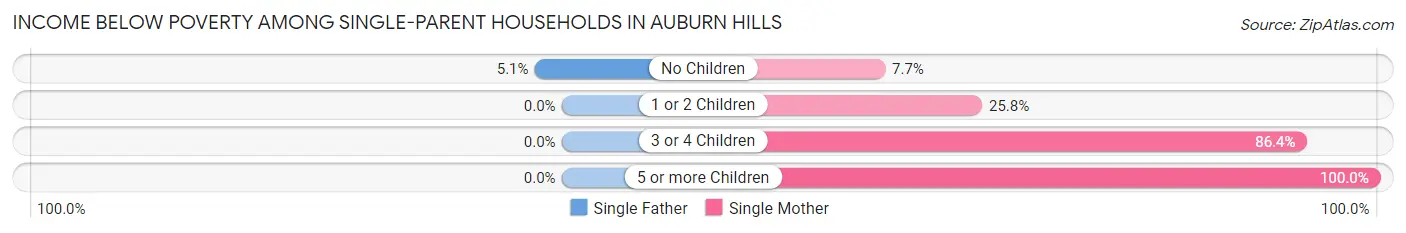
| Children | Single Father | Single Mother |
| No Children | 15 (5.1%) | 38 (7.7%) |
| 1 or 2 Children | 0 (0.0%) | 149 (25.8%) |
| 3 or 4 Children | 0 (0.0%) | 19 (86.4%) |
| 5 or more Children | 0 (0.0%) | 10 (100.0%) |
| Total | 15 (3.7%) | 216 (19.6%) |
Income Below Poverty Among Married-Couple vs Single-Parent Households in Auburn Hills
The poverty data for Auburn Hills shows that 125 of the married-couple family households (3.2%) and 231 of the single-parent households (15.3%) are living below the poverty level. Within the married-couple family households, those with 5 or more children have the highest poverty rate, with 16 households (29.1%) falling below the poverty line. Among the single-parent households, those with 5 or more children have the highest poverty rate, with 10 household (100.0%) living below poverty.
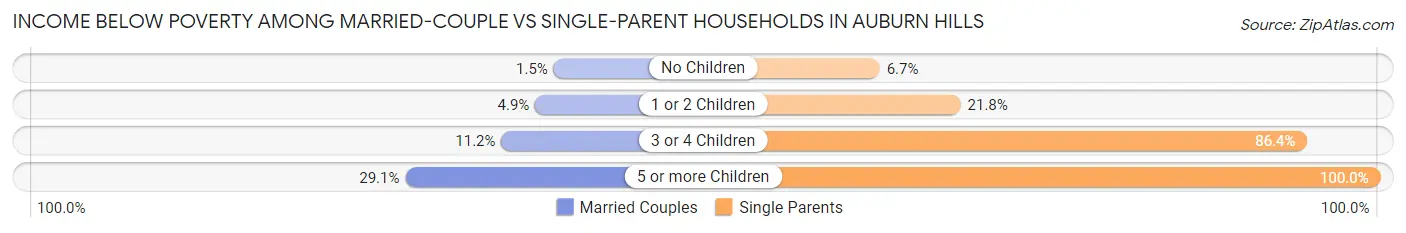
| Children | Married-Couple Families | Single-Parent Households |
| No Children | 36 (1.5%) | 53 (6.7%) |
| 1 or 2 Children | 59 (4.9%) | 149 (21.8%) |
| 3 or 4 Children | 14 (11.2%) | 19 (86.4%) |
| 5 or more Children | 16 (29.1%) | 10 (100.0%) |
| Total | 125 (3.2%) | 231 (15.3%) |
Race in Auburn Hills
The most populous races in Auburn Hills are White / Caucasian (14,267 | 58.0%), Asian (3,891 | 15.8%), and Black / African American (3,427 | 13.9%).
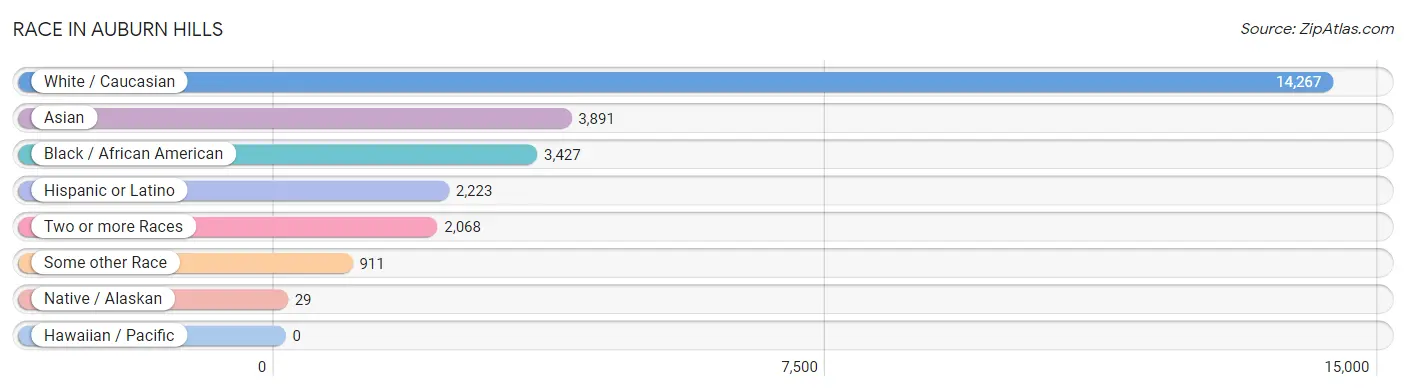
| Race | # Population | % Population |
| Asian | 3,891 | 15.8% |
| Black / African American | 3,427 | 13.9% |
| Hawaiian / Pacific | 0 | 0.0% |
| Hispanic or Latino | 2,223 | 9.0% |
| Native / Alaskan | 29 | 0.1% |
| White / Caucasian | 14,267 | 58.0% |
| Two or more Races | 2,068 | 8.4% |
| Some other Race | 911 | 3.7% |
| Total | 24,593 | 100.0% |
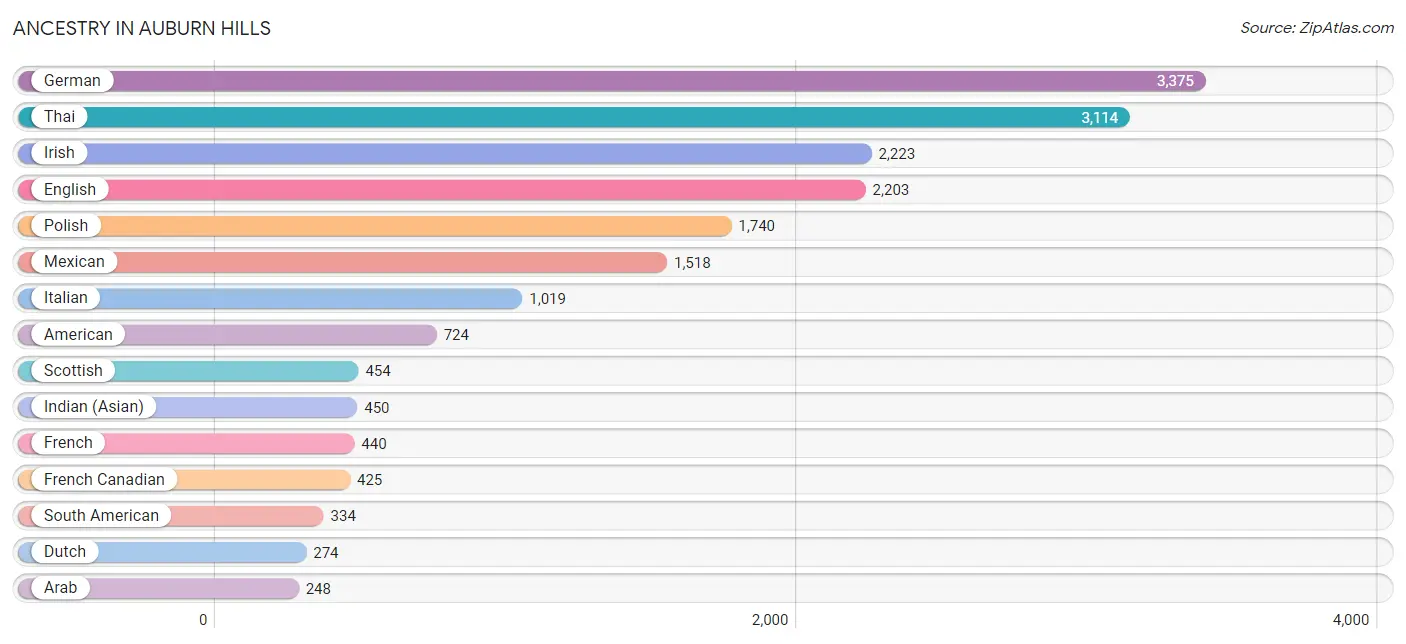
Ancestry in Auburn Hills
The most populous ancestries reported in Auburn Hills are German (3,375 | 13.7%), Thai (3,114 | 12.7%), Irish (2,223 | 9.0%), English (2,203 | 9.0%), and Polish (1,740 | 7.1%), together accounting for 51.5% of all Auburn Hills residents.
| Ancestry | # Population | % Population |
| African | 98 | 0.4% |
| Albanian | 156 | 0.6% |
| American | 724 | 2.9% |
| Arab | 248 | 1.0% |
| Argentinean | 14 | 0.1% |
| Armenian | 4 | 0.0% |
| Assyrian / Chaldean / Syriac | 125 | 0.5% |
| Austrian | 12 | 0.1% |
| Belgian | 62 | 0.3% |
| Bhutanese | 61 | 0.3% |
| Blackfeet | 12 | 0.1% |
| Brazilian | 2 | 0.0% |
| British | 55 | 0.2% |
| Burmese | 101 | 0.4% |
| Canadian | 71 | 0.3% |
| Central American Indian | 8 | 0.0% |
| Cherokee | 17 | 0.1% |
| Chippewa | 34 | 0.1% |
| Choctaw | 18 | 0.1% |
| Colombian | 198 | 0.8% |
| Croatian | 31 | 0.1% |
| Cuban | 49 | 0.2% |
| Czech | 53 | 0.2% |
| Czechoslovakian | 15 | 0.1% |
| Danish | 31 | 0.1% |
| Delaware | 10 | 0.0% |
| Dutch | 274 | 1.1% |
| Eastern European | 49 | 0.2% |
| Ecuadorian | 80 | 0.3% |
| English | 2,203 | 9.0% |
| Ethiopian | 4 | 0.0% |
| European | 230 | 0.9% |
| Filipino | 13 | 0.1% |
| Finnish | 139 | 0.6% |
| French | 440 | 1.8% |
| French Canadian | 425 | 1.7% |
| German | 3,375 | 13.7% |
| Greek | 61 | 0.3% |
| Hmong | 1 | 0.0% |
| Hungarian | 162 | 0.7% |
| Icelander | 31 | 0.1% |
| Indian (Asian) | 450 | 1.8% |
| Iraqi | 20 | 0.1% |
| Irish | 2,223 | 9.0% |
| Italian | 1,019 | 4.1% |
| Jamaican | 29 | 0.1% |
| Japanese | 52 | 0.2% |
| Korean | 143 | 0.6% |
| Lebanese | 48 | 0.2% |
| Lithuanian | 6 | 0.0% |
| Macedonian | 22 | 0.1% |
| Maltese | 14 | 0.1% |
| Mexican | 1,518 | 6.2% |
| Mexican American Indian | 30 | 0.1% |
| Nigerian | 7 | 0.0% |
| Northern European | 21 | 0.1% |
| Norwegian | 142 | 0.6% |
| Palestinian | 11 | 0.0% |
| Peruvian | 9 | 0.0% |
| Polish | 1,740 | 7.1% |
| Puerto Rican | 238 | 1.0% |
| Romanian | 185 | 0.7% |
| Russian | 217 | 0.9% |
| Scandinavian | 47 | 0.2% |
| Scotch-Irish | 125 | 0.5% |
| Scottish | 454 | 1.8% |
| Serbian | 11 | 0.0% |
| Slovak | 130 | 0.5% |
| Slovene | 41 | 0.2% |
| South American | 334 | 1.4% |
| Spaniard | 29 | 0.1% |
| Spanish | 20 | 0.1% |
| Sri Lankan | 9 | 0.0% |
| Subsaharan African | 137 | 0.6% |
| Swedish | 208 | 0.9% |
| Swiss | 20 | 0.1% |
| Syrian | 25 | 0.1% |
| Thai | 3,114 | 12.7% |
| Turkish | 19 | 0.1% |
| Ukrainian | 102 | 0.4% |
| Venezuelan | 33 | 0.1% |
| Welsh | 174 | 0.7% |
| West Indian | 21 | 0.1% |
| Yugoslavian | 24 | 0.1% | View All 84 Rows |
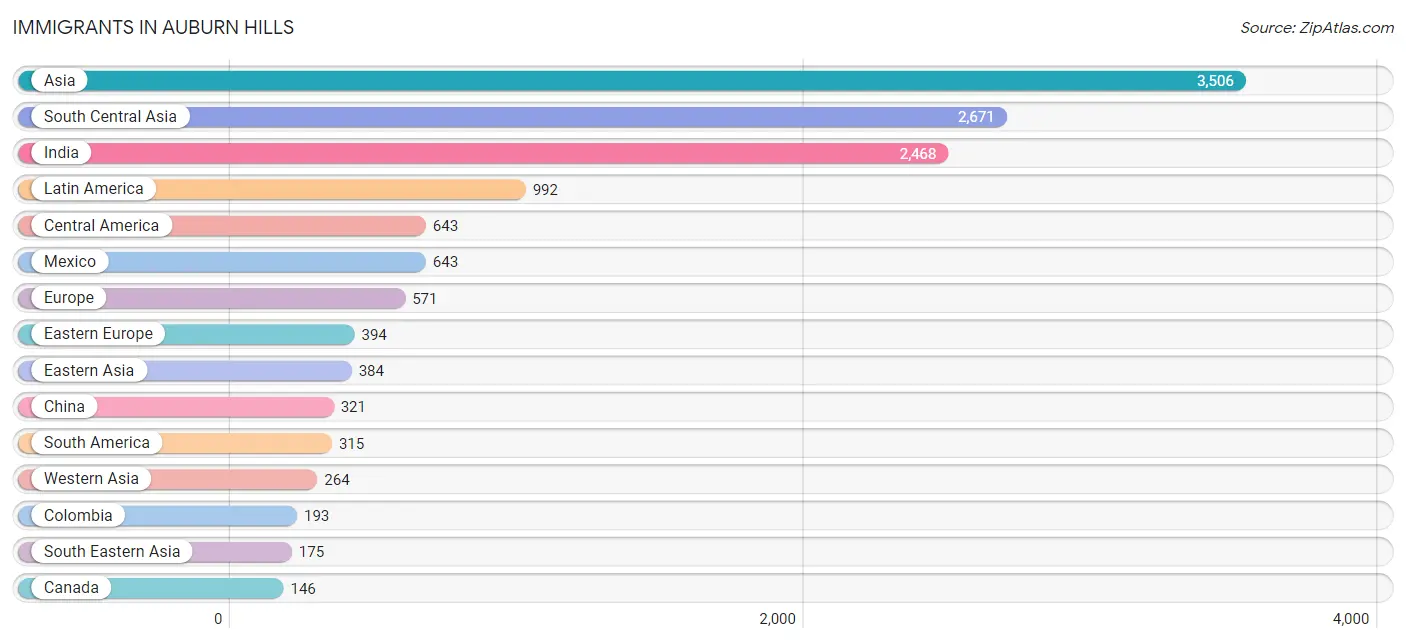
Immigrants in Auburn Hills
The most numerous immigrant groups reported in Auburn Hills came from Asia (3,506 | 14.3%), South Central Asia (2,671 | 10.9%), India (2,468 | 10.0%), Latin America (992 | 4.0%), and Central America (643 | 2.6%), together accounting for 41.8% of all Auburn Hills residents.
| Immigration Origin | # Population | % Population |
| Africa | 4 | 0.0% |
| Albania | 17 | 0.1% |
| Argentina | 11 | 0.0% |
| Asia | 3,506 | 14.3% |
| Brazil | 13 | 0.1% |
| Cambodia | 22 | 0.1% |
| Canada | 146 | 0.6% |
| Caribbean | 34 | 0.1% |
| Central America | 643 | 2.6% |
| China | 321 | 1.3% |
| Colombia | 193 | 0.8% |
| Cuba | 21 | 0.1% |
| Eastern Africa | 4 | 0.0% |
| Eastern Asia | 384 | 1.6% |
| Eastern Europe | 394 | 1.6% |
| Ecuador | 68 | 0.3% |
| Ethiopia | 4 | 0.0% |
| Europe | 571 | 2.3% |
| Germany | 33 | 0.1% |
| Greece | 46 | 0.2% |
| Hungary | 32 | 0.1% |
| India | 2,468 | 10.0% |
| Iraq | 98 | 0.4% |
| Israel | 20 | 0.1% |
| Italy | 55 | 0.2% |
| Japan | 1 | 0.0% |
| Korea | 62 | 0.3% |
| Latin America | 992 | 4.0% |
| Mexico | 643 | 2.6% |
| North Macedonia | 11 | 0.0% |
| Northern Europe | 43 | 0.2% |
| Oceania | 5 | 0.0% |
| Pakistan | 96 | 0.4% |
| Philippines | 110 | 0.4% |
| Poland | 126 | 0.5% |
| Romania | 61 | 0.3% |
| Russia | 5 | 0.0% |
| Saudi Arabia | 14 | 0.1% |
| Serbia | 30 | 0.1% |
| Singapore | 34 | 0.1% |
| South America | 315 | 1.3% |
| South Central Asia | 2,671 | 10.9% |
| South Eastern Asia | 175 | 0.7% |
| Southern Europe | 101 | 0.4% |
| Syria | 45 | 0.2% |
| Taiwan | 25 | 0.1% |
| Trinidad and Tobago | 13 | 0.1% |
| Uzbekistan | 107 | 0.4% |
| Venezuela | 30 | 0.1% |
| Vietnam | 9 | 0.0% |
| Western Asia | 264 | 1.1% |
| Western Europe | 33 | 0.1% | View All 52 Rows |
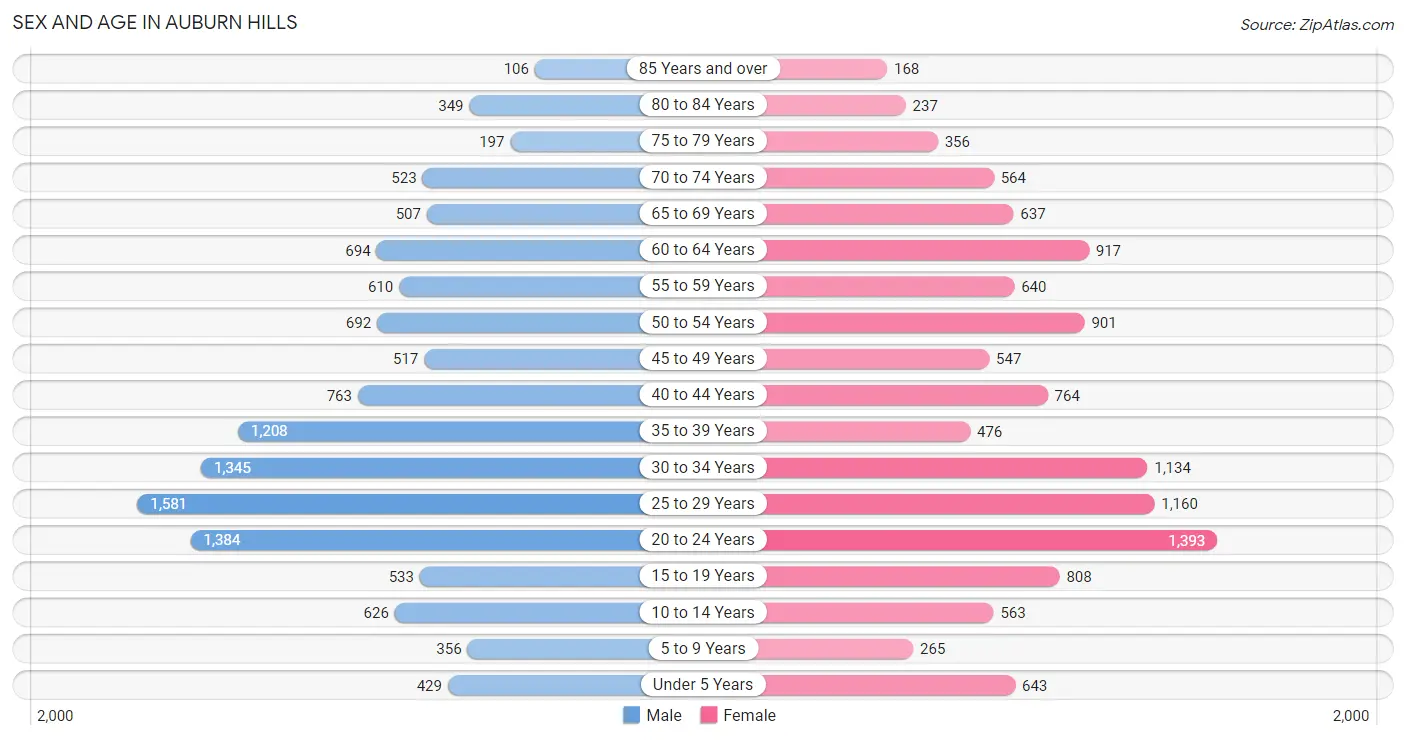
Sex and Age in Auburn Hills
Sex and Age in Auburn Hills
The most populous age groups in Auburn Hills are 25 to 29 Years (1,581 | 12.7%) for men and 20 to 24 Years (1,393 | 11.4%) for women.
| Age Bracket | Male | Female |
| Under 5 Years | 429 (3.5%) | 643 (5.3%) |
| 5 to 9 Years | 356 (2.9%) | 265 (2.2%) |
| 10 to 14 Years | 626 (5.0%) | 563 (4.6%) |
| 15 to 19 Years | 533 (4.3%) | 808 (6.6%) |
| 20 to 24 Years | 1,384 (11.1%) | 1,393 (11.4%) |
| 25 to 29 Years | 1,581 (12.7%) | 1,160 (9.5%) |
| 30 to 34 Years | 1,345 (10.8%) | 1,134 (9.3%) |
| 35 to 39 Years | 1,208 (9.7%) | 476 (3.9%) |
| 40 to 44 Years | 763 (6.1%) | 764 (6.3%) |
| 45 to 49 Years | 517 (4.2%) | 547 (4.5%) |
| 50 to 54 Years | 692 (5.6%) | 901 (7.4%) |
| 55 to 59 Years | 610 (4.9%) | 640 (5.3%) |
| 60 to 64 Years | 694 (5.6%) | 917 (7.5%) |
| 65 to 69 Years | 507 (4.1%) | 637 (5.2%) |
| 70 to 74 Years | 523 (4.2%) | 564 (4.6%) |
| 75 to 79 Years | 197 (1.6%) | 356 (2.9%) |
| 80 to 84 Years | 349 (2.8%) | 237 (1.9%) |
| 85 Years and over | 106 (0.9%) | 168 (1.4%) |
| Total | 12,420 (100.0%) | 12,173 (100.0%) |
Families and Households in Auburn Hills
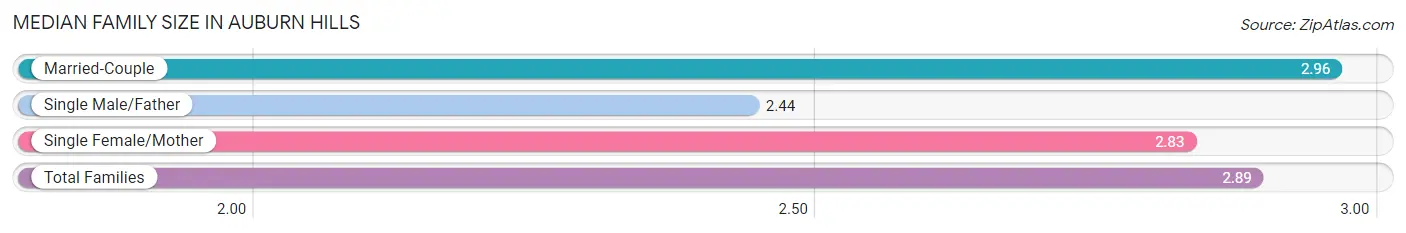
Median Family Size in Auburn Hills
The median family size in Auburn Hills is 2.89 persons per family, with married-couple families (3,868 | 72.0%) accounting for the largest median family size of 2.96 persons per family. On the other hand, single male/father families (403 | 7.5%) represent the smallest median family size with 2.44 persons per family.
| Family Type | # Families | Family Size |
| Married-Couple | 3,868 (72.0%) | 2.96 |
| Single Male/Father | 403 (7.5%) | 2.44 |
| Single Female/Mother | 1,103 (20.5%) | 2.83 |
| Total Families | 5,374 (100.0%) | 2.89 |
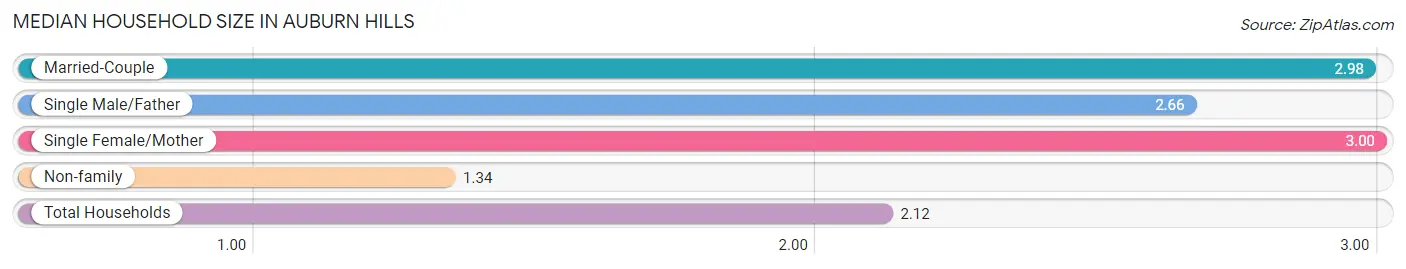
Median Household Size in Auburn Hills
The median household size in Auburn Hills is 2.12 persons per household, with single female/mother households (1,103 | 9.9%) accounting for the largest median household size of 3 persons per household. non-family households (5,807 | 51.9%) represent the smallest median household size with 1.34 persons per household.
| Household Type | # Households | Household Size |
| Married-Couple | 3,868 (34.6%) | 2.98 |
| Single Male/Father | 403 (3.6%) | 2.66 |
| Single Female/Mother | 1,103 (9.9%) | 3.00 |
| Non-family | 5,807 (51.9%) | 1.34 |
| Total Households | 11,181 (100.0%) | 2.12 |
Household Size by Marriage Status in Auburn Hills
Out of a total of 11,181 households in Auburn Hills, 5,374 (48.1%) are family households, while 5,807 (51.9%) are nonfamily households. The most numerous type of family households are 2-person households, comprising 2,798, and the most common type of nonfamily households are 1-person households, comprising 4,243.
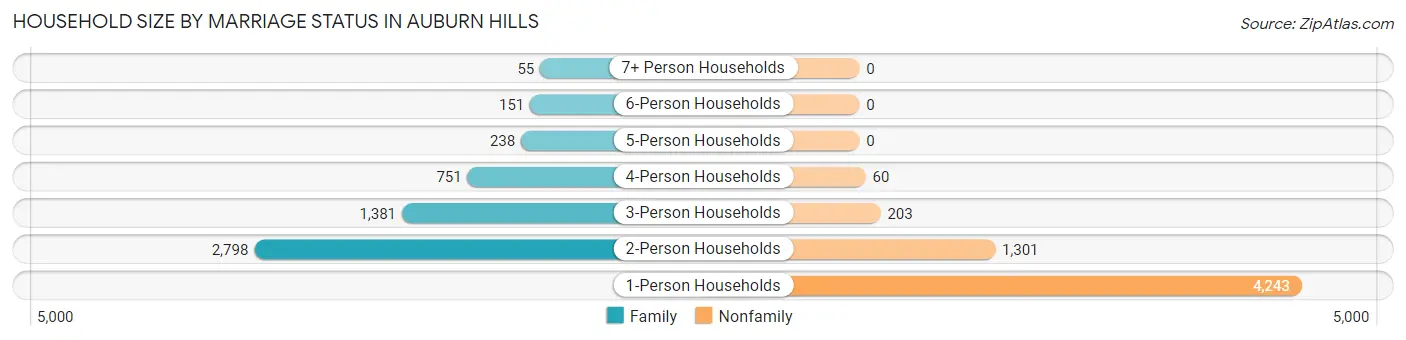
| Household Size | Family Households | Nonfamily Households |
| 1-Person Households | - | 4,243 (38.0%) |
| 2-Person Households | 2,798 (25.0%) | 1,301 (11.6%) |
| 3-Person Households | 1,381 (12.3%) | 203 (1.8%) |
| 4-Person Households | 751 (6.7%) | 60 (0.5%) |
| 5-Person Households | 238 (2.1%) | 0 (0.0%) |
| 6-Person Households | 151 (1.3%) | 0 (0.0%) |
| 7+ Person Households | 55 (0.5%) | 0 (0.0%) |
| Total | 5,374 (48.1%) | 5,807 (51.9%) |
Female Fertility in Auburn Hills
Fertility by Age in Auburn Hills
Average fertility rate in Auburn Hills is 34.0 births per 1,000 women. Women in the age bracket of 20 to 34 years have the highest fertility rate with 46.0 births per 1,000 women. Women in the age bracket of 20 to 34 years acount for 76.1% of all women with births.
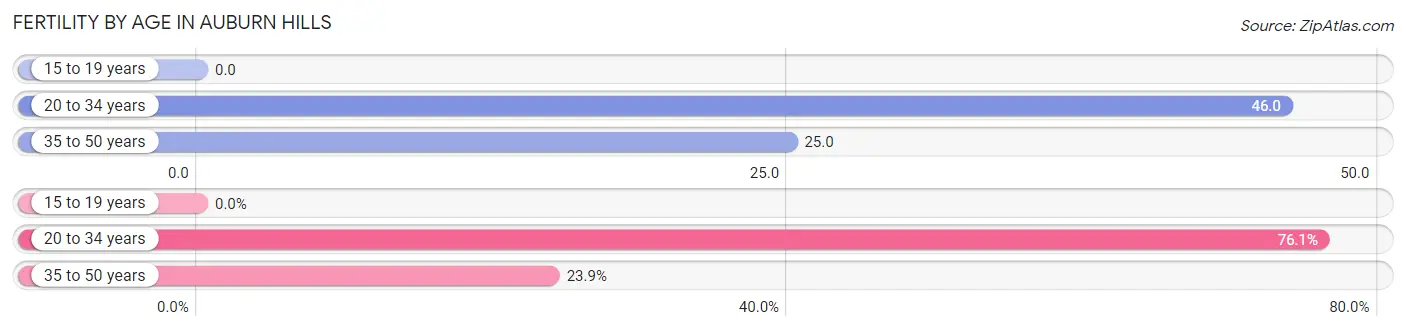
| Age Bracket | Women with Births | Births / 1,000 Women |
| 15 to 19 years | 0 (0.0%) | 0.0 |
| 20 to 34 years | 169 (76.1%) | 46.0 |
| 35 to 50 years | 53 (23.9%) | 25.0 |
| Total | 222 (100.0%) | 34.0 |
Fertility by Age by Marriage Status in Auburn Hills
92.3% of women with births (222) in Auburn Hills are married. The highest percentage of unmarried women with births falls into 20 to 34 years age bracket with 10.1% of them unmarried at the time of birth, while the lowest percentage of unmarried women with births belong to 35 to 50 years age bracket with 0.0% of them unmarried.
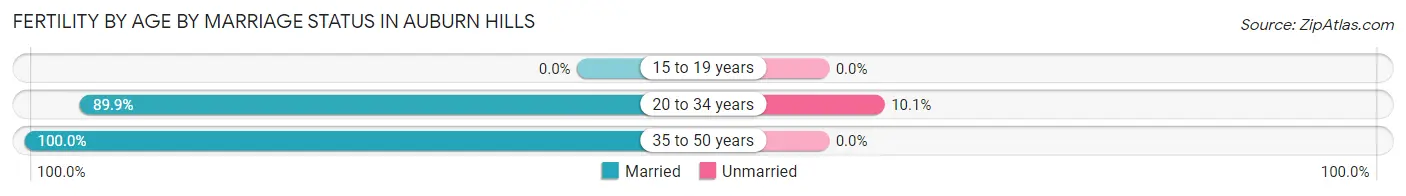
| Age Bracket | Married | Unmarried |
| 15 to 19 years | 0 (0.0%) | 0 (0.0%) |
| 20 to 34 years | 152 (89.9%) | 17 (10.1%) |
| 35 to 50 years | 53 (100.0%) | 0 (0.0%) |
| Total | 205 (92.3%) | 17 (7.7%) |
Fertility by Education in Auburn Hills
Average fertility rate in Auburn Hills is 34.0 births per 1,000 women. Women with the education attainment of graduate degree have the highest fertility rate of 91.0 births per 1,000 women, while women with the education attainment of high school diploma have the lowest fertility at 9.0 births per 1,000 women. Women with the education attainment of graduate degree represent 50.0% of all women with births.
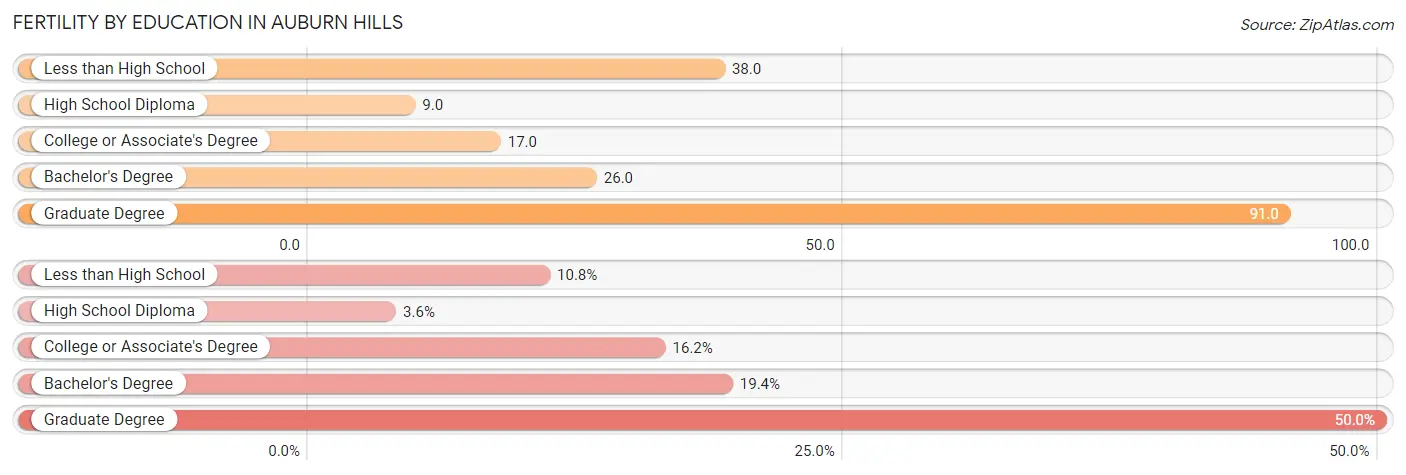
| Educational Attainment | Women with Births | Births / 1,000 Women |
| Less than High School | 24 (10.8%) | 38.0 |
| High School Diploma | 8 (3.6%) | 9.0 |
| College or Associate's Degree | 36 (16.2%) | 17.0 |
| Bachelor's Degree | 43 (19.4%) | 26.0 |
| Graduate Degree | 111 (50.0%) | 91.0 |
| Total | 222 (100.0%) | 34.0 |
Fertility by Education by Marriage Status in Auburn Hills
7.7% of women with births in Auburn Hills are unmarried. Women with the educational attainment of less than high school are most likely to be married with 100.0% of them married at childbirth, while women with the educational attainment of college or associate's degree are least likely to be married with 47.2% of them unmarried at childbirth.
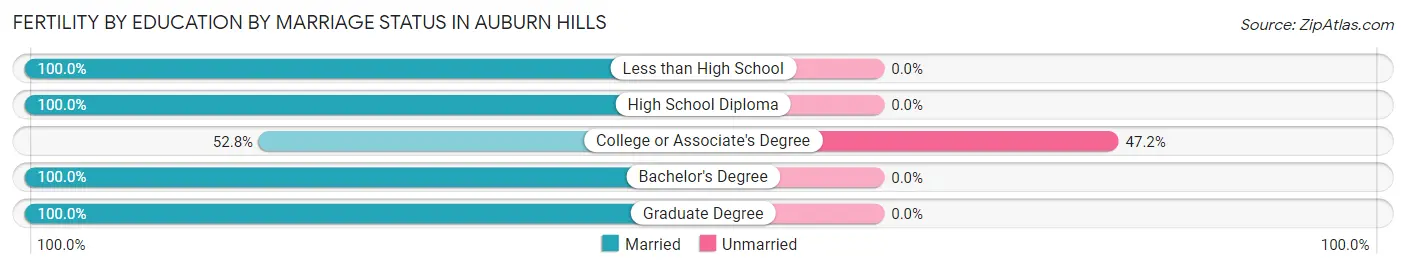
| Educational Attainment | Married | Unmarried |
| Less than High School | 24 (100.0%) | 0 (0.0%) |
| High School Diploma | 8 (100.0%) | 0 (0.0%) |
| College or Associate's Degree | 19 (52.8%) | 17 (47.2%) |
| Bachelor's Degree | 43 (100.0%) | 0 (0.0%) |
| Graduate Degree | 111 (100.0%) | 0 (0.0%) |
| Total | 205 (92.3%) | 17 (7.7%) |
Employment Characteristics in Auburn Hills
Employment by Class of Employer in Auburn Hills
Among the 13,922 employed individuals in Auburn Hills, private company employees (11,343 | 81.5%), not-for-profit organizations (842 | 6.0%), and local government employees (575 | 4.1%) make up the most common classes of employment.
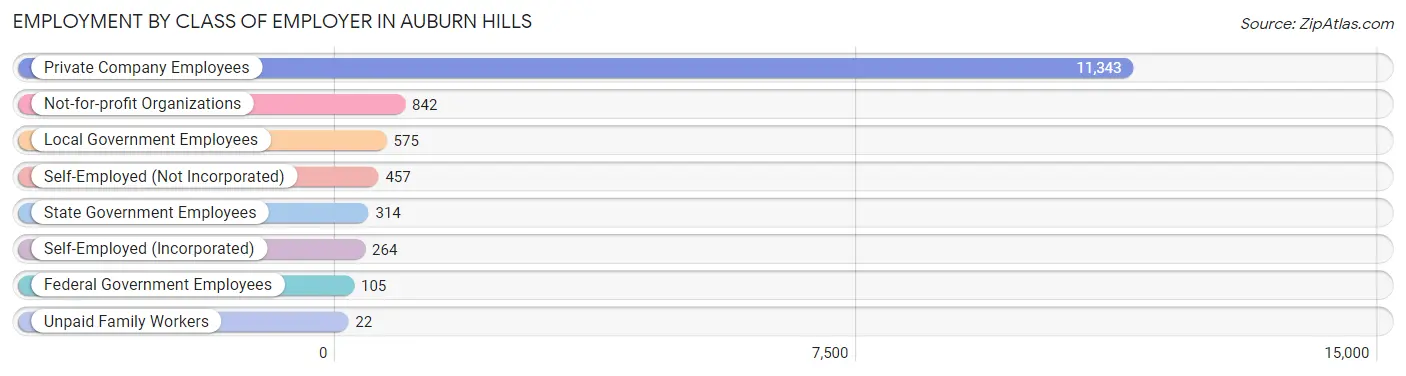
| Employer Class | # Employees | % Employees |
| Private Company Employees | 11,343 | 81.5% |
| Self-Employed (Incorporated) | 264 | 1.9% |
| Self-Employed (Not Incorporated) | 457 | 3.3% |
| Not-for-profit Organizations | 842 | 6.0% |
| Local Government Employees | 575 | 4.1% |
| State Government Employees | 314 | 2.3% |
| Federal Government Employees | 105 | 0.7% |
| Unpaid Family Workers | 22 | 0.2% |
| Total | 13,922 | 100.0% |
Employment Status by Age in Auburn Hills
According to the labor force statistics for Auburn Hills, out of the total population over 16 years of age (21,528), 69.1% or 14,876 individuals are in the labor force, with 5.1% or 759 of them unemployed. The age group with the highest labor force participation rate is 35 to 44 years, with 88.8% or 2,851 individuals in the labor force. Within the labor force, the 16 to 19 years age range has the highest percentage of unemployed individuals, with 15.7% or 74 of them being unemployed.
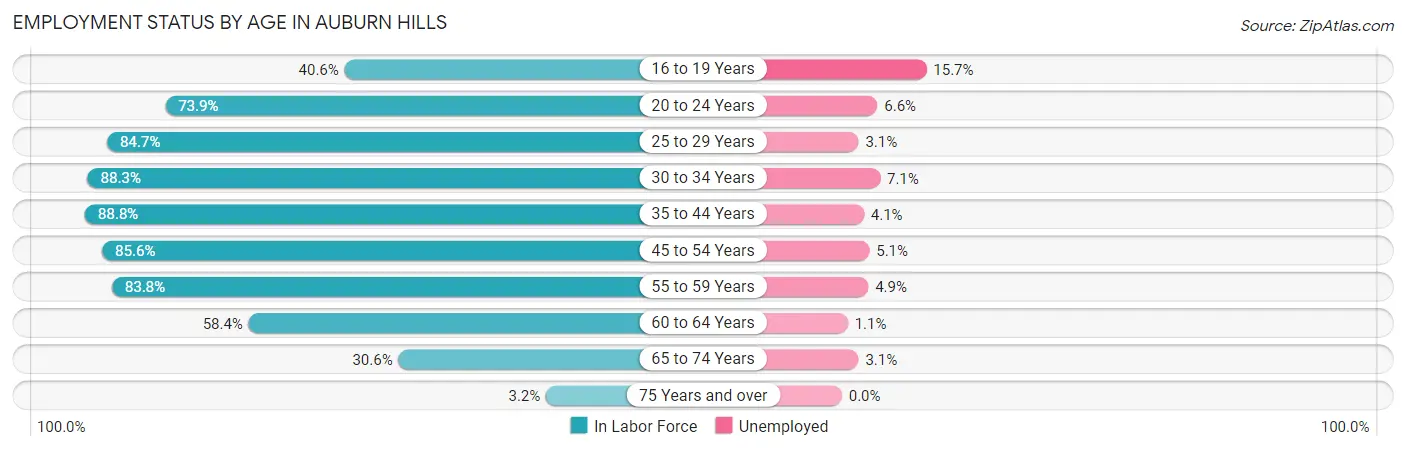
| Age Bracket | In Labor Force | Unemployed |
| 16 to 19 Years | 470 (40.6%) | 74 (15.7%) |
| 20 to 24 Years | 2,052 (73.9%) | 135 (6.6%) |
| 25 to 29 Years | 2,322 (84.7%) | 72 (3.1%) |
| 30 to 34 Years | 2,189 (88.3%) | 155 (7.1%) |
| 35 to 44 Years | 2,851 (88.8%) | 117 (4.1%) |
| 45 to 54 Years | 2,274 (85.6%) | 116 (5.1%) |
| 55 to 59 Years | 1,048 (83.8%) | 51 (4.9%) |
| 60 to 64 Years | 941 (58.4%) | 10 (1.1%) |
| 65 to 74 Years | 683 (30.6%) | 21 (3.1%) |
| 75 Years and over | 45 (3.2%) | 0 (0.0%) |
| Total | 14,876 (69.1%) | 759 (5.1%) |
Employment Status by Educational Attainment in Auburn Hills
According to labor force statistics for Auburn Hills, 83.3% of individuals (11,620) out of the total population between 25 and 64 years of age (13,949) are in the labor force, with 4.5% or 523 of them being unemployed. The group with the highest labor force participation rate are those with the educational attainment of bachelor's degree or higher, with 87.9% or 6,388 individuals in the labor force. Within the labor force, individuals with less than high school education have the highest percentage of unemployment, with 11.4% or 46 of them being unemployed.
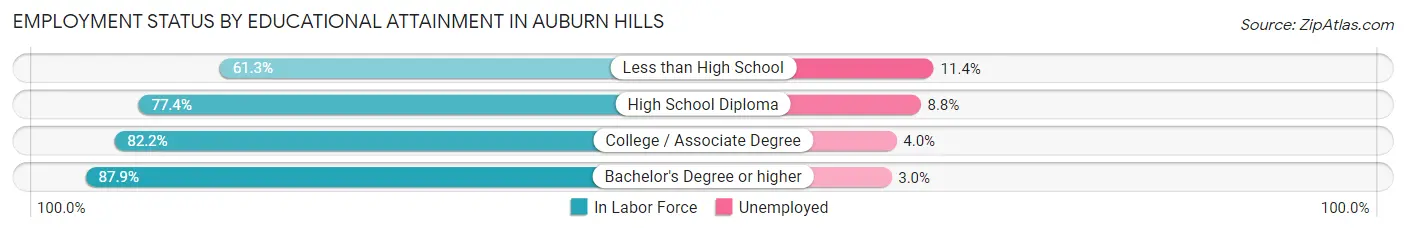
| Educational Attainment | In Labor Force | Unemployed |
| Less than High School | 405 (61.3%) | 75 (11.4%) |
| High School Diploma | 1,877 (77.4%) | 213 (8.8%) |
| College / Associate Degree | 2,956 (82.2%) | 144 (4.0%) |
| Bachelor's Degree or higher | 6,388 (87.9%) | 218 (3.0%) |
| Total | 11,620 (83.3%) | 628 (4.5%) |
Employment Occupations by Sex in Auburn Hills
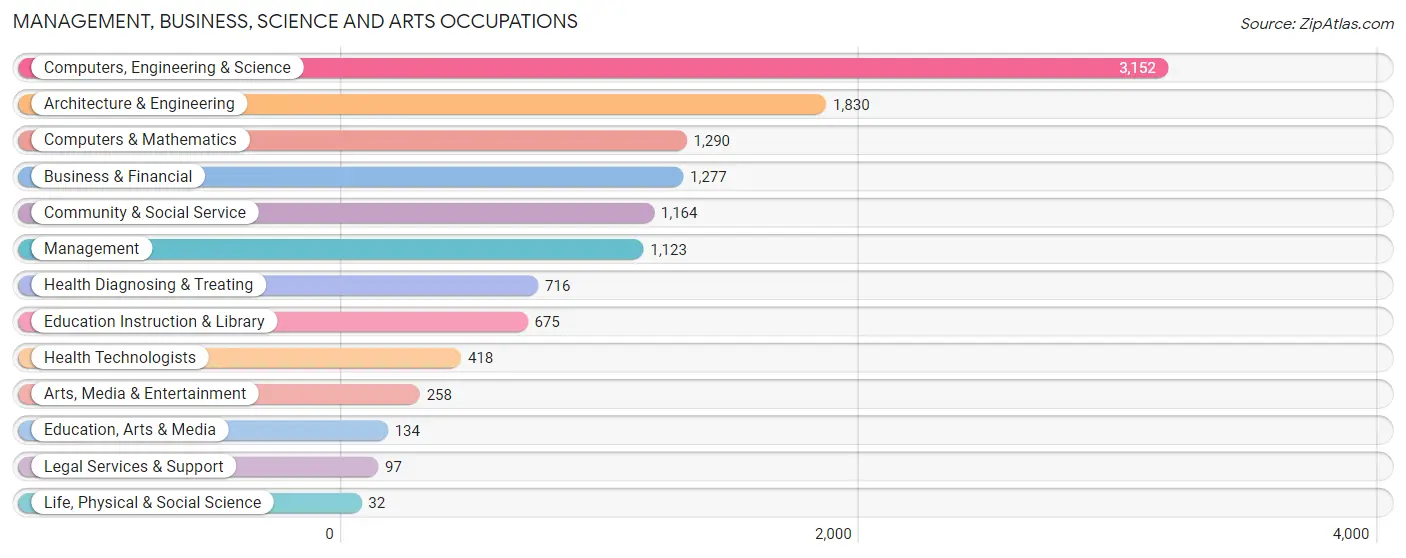
Management, Business, Science and Arts Occupations
The most common Management, Business, Science and Arts occupations in Auburn Hills are Computers, Engineering & Science (3,152 | 22.3%), Architecture & Engineering (1,830 | 13.0%), Computers & Mathematics (1,290 | 9.1%), Business & Financial (1,277 | 9.0%), and Community & Social Service (1,164 | 8.2%).
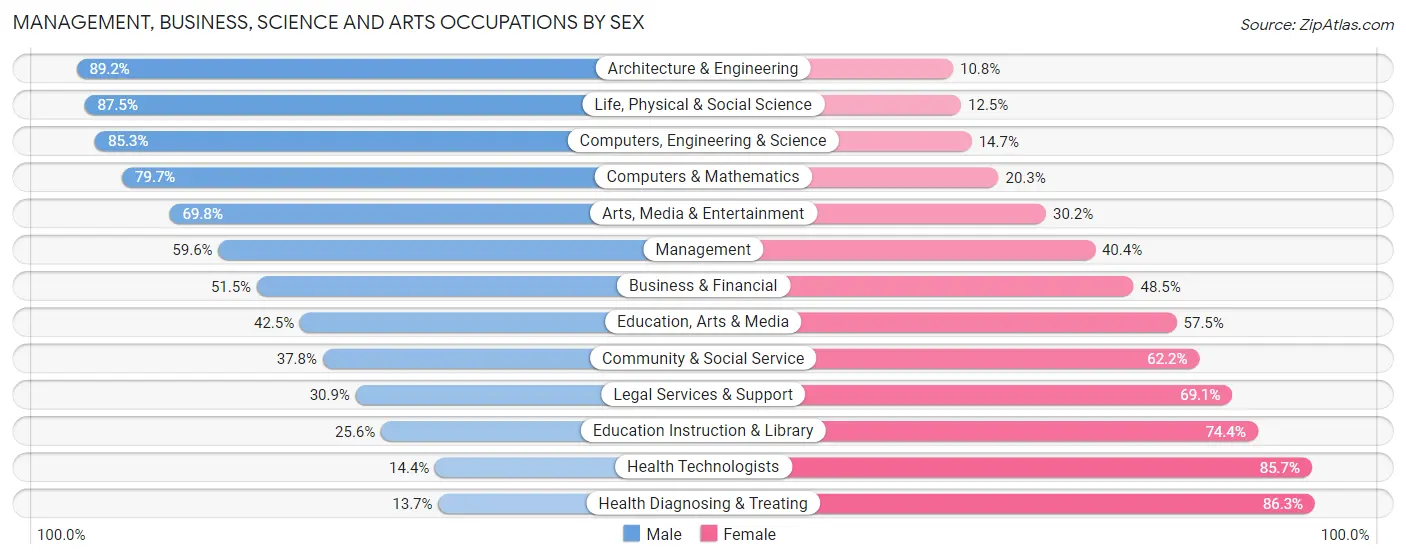
Management, Business, Science and Arts Occupations by Sex
Within the Management, Business, Science and Arts occupations in Auburn Hills, the most male-oriented occupations are Architecture & Engineering (89.2%), Life, Physical & Social Science (87.5%), and Computers, Engineering & Science (85.3%), while the most female-oriented occupations are Health Diagnosing & Treating (86.3%), Health Technologists (85.7%), and Education Instruction & Library (74.4%).
| Occupation | Male | Female |
| Management | 669 (59.6%) | 454 (40.4%) |
| Business & Financial | 658 (51.5%) | 619 (48.5%) |
| Computers, Engineering & Science | 2,688 (85.3%) | 464 (14.7%) |
| Computers & Mathematics | 1,028 (79.7%) | 262 (20.3%) |
| Architecture & Engineering | 1,632 (89.2%) | 198 (10.8%) |
| Life, Physical & Social Science | 28 (87.5%) | 4 (12.5%) |
| Community & Social Service | 440 (37.8%) | 724 (62.2%) |
| Education, Arts & Media | 57 (42.5%) | 77 (57.5%) |
| Legal Services & Support | 30 (30.9%) | 67 (69.1%) |
| Education Instruction & Library | 173 (25.6%) | 502 (74.4%) |
| Arts, Media & Entertainment | 180 (69.8%) | 78 (30.2%) |
| Health Diagnosing & Treating | 98 (13.7%) | 618 (86.3%) |
| Health Technologists | 60 (14.3%) | 358 (85.7%) |
| Total (Category) | 4,553 (61.3%) | 2,879 (38.7%) |
| Total (Overall) | 7,821 (55.4%) | 6,301 (44.6%) |
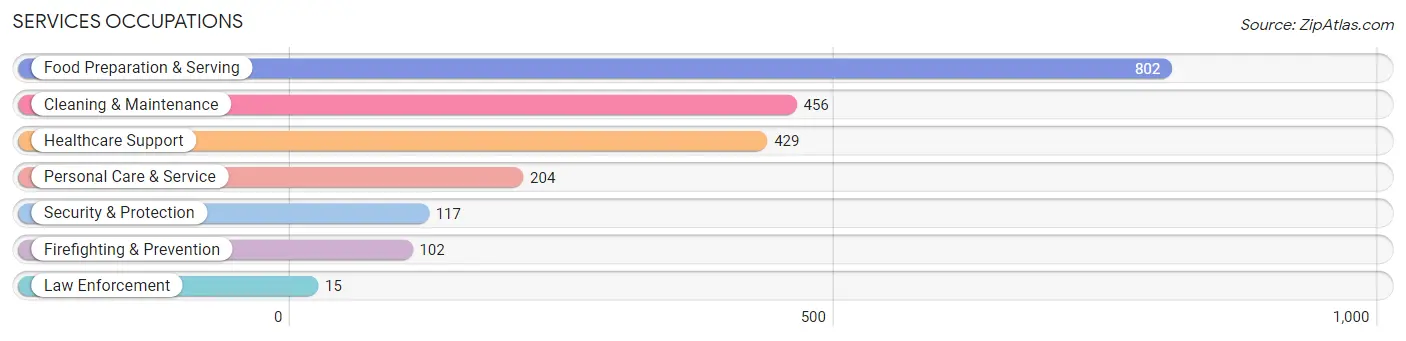
Services Occupations
The most common Services occupations in Auburn Hills are Food Preparation & Serving (802 | 5.7%), Cleaning & Maintenance (456 | 3.2%), Healthcare Support (429 | 3.0%), Personal Care & Service (204 | 1.4%), and Security & Protection (117 | 0.8%).
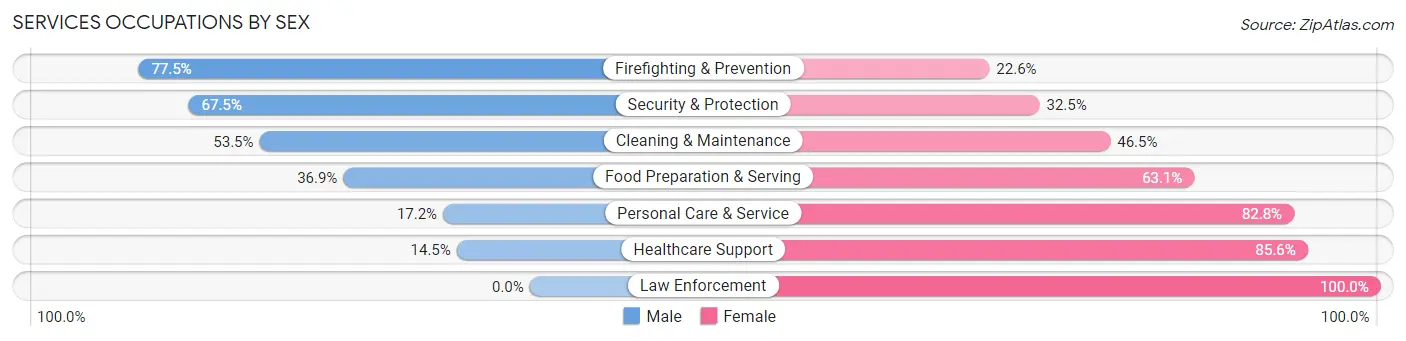
Services Occupations by Sex
Within the Services occupations in Auburn Hills, the most male-oriented occupations are Firefighting & Prevention (77.4%), Security & Protection (67.5%), and Cleaning & Maintenance (53.5%), while the most female-oriented occupations are Law Enforcement (100.0%), Healthcare Support (85.6%), and Personal Care & Service (82.8%).
| Occupation | Male | Female |
| Healthcare Support | 62 (14.4%) | 367 (85.6%) |
| Security & Protection | 79 (67.5%) | 38 (32.5%) |
| Firefighting & Prevention | 79 (77.4%) | 23 (22.6%) |
| Law Enforcement | 0 (0.0%) | 15 (100.0%) |
| Food Preparation & Serving | 296 (36.9%) | 506 (63.1%) |
| Cleaning & Maintenance | 244 (53.5%) | 212 (46.5%) |
| Personal Care & Service | 35 (17.2%) | 169 (82.8%) |
| Total (Category) | 716 (35.7%) | 1,292 (64.3%) |
| Total (Overall) | 7,821 (55.4%) | 6,301 (44.6%) |
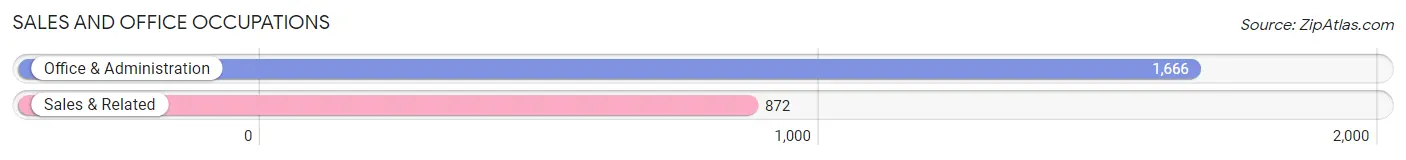
Sales and Office Occupations
The most common Sales and Office occupations in Auburn Hills are Office & Administration (1,666 | 11.8%), and Sales & Related (872 | 6.2%).
Sales and Office Occupations by Sex
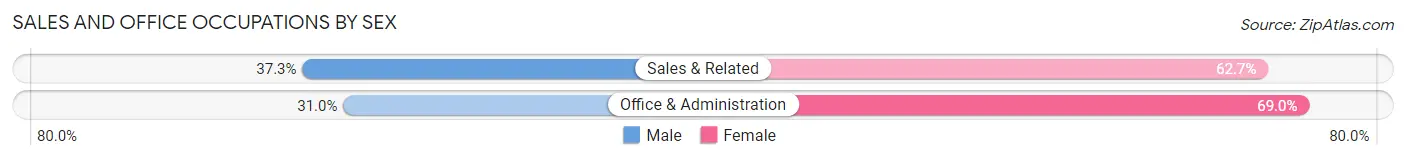
| Occupation | Male | Female |
| Sales & Related | 325 (37.3%) | 547 (62.7%) |
| Office & Administration | 516 (31.0%) | 1,150 (69.0%) |
| Total (Category) | 841 (33.1%) | 1,697 (66.9%) |
| Total (Overall) | 7,821 (55.4%) | 6,301 (44.6%) |
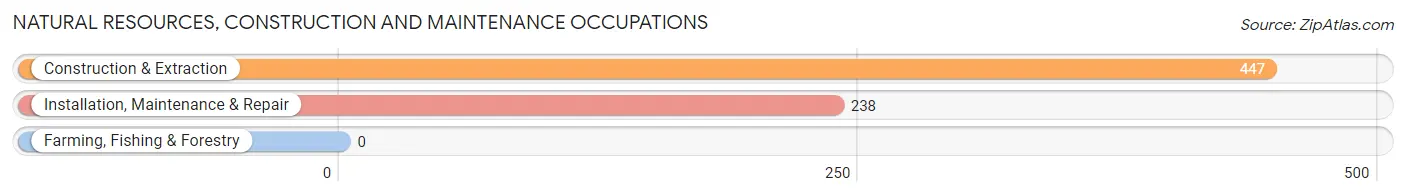
Natural Resources, Construction and Maintenance Occupations
The most common Natural Resources, Construction and Maintenance occupations in Auburn Hills are Construction & Extraction (447 | 3.2%), and Installation, Maintenance & Repair (238 | 1.7%).
Natural Resources, Construction and Maintenance Occupations by Sex
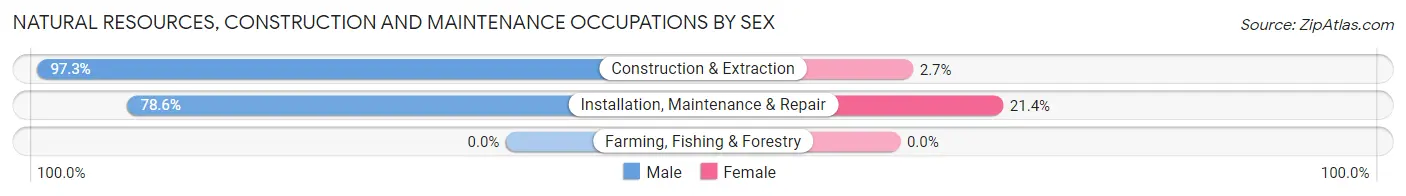
| Occupation | Male | Female |
| Farming, Fishing & Forestry | 0 (0.0%) | 0 (0.0%) |
| Construction & Extraction | 435 (97.3%) | 12 (2.7%) |
| Installation, Maintenance & Repair | 187 (78.6%) | 51 (21.4%) |
| Total (Category) | 622 (90.8%) | 63 (9.2%) |
| Total (Overall) | 7,821 (55.4%) | 6,301 (44.6%) |
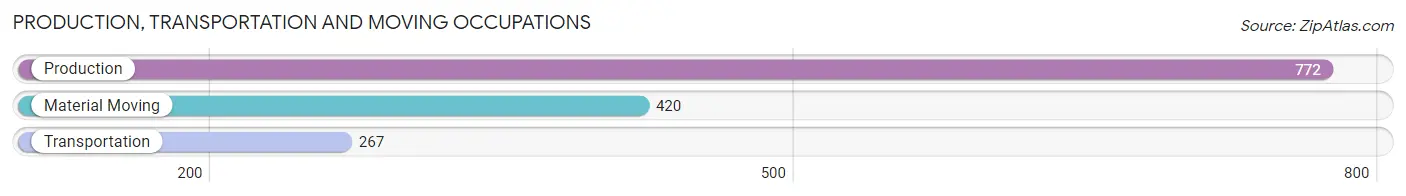
Production, Transportation and Moving Occupations
The most common Production, Transportation and Moving occupations in Auburn Hills are Production (772 | 5.5%), Material Moving (420 | 3.0%), and Transportation (267 | 1.9%).
Production, Transportation and Moving Occupations by Sex
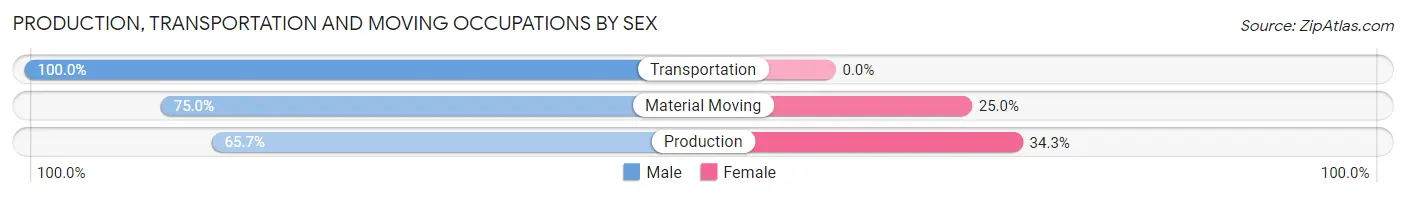
| Occupation | Male | Female |
| Production | 507 (65.7%) | 265 (34.3%) |
| Transportation | 267 (100.0%) | 0 (0.0%) |
| Material Moving | 315 (75.0%) | 105 (25.0%) |
| Total (Category) | 1,089 (74.6%) | 370 (25.4%) |
| Total (Overall) | 7,821 (55.4%) | 6,301 (44.6%) |
Employment Industries by Sex in Auburn Hills
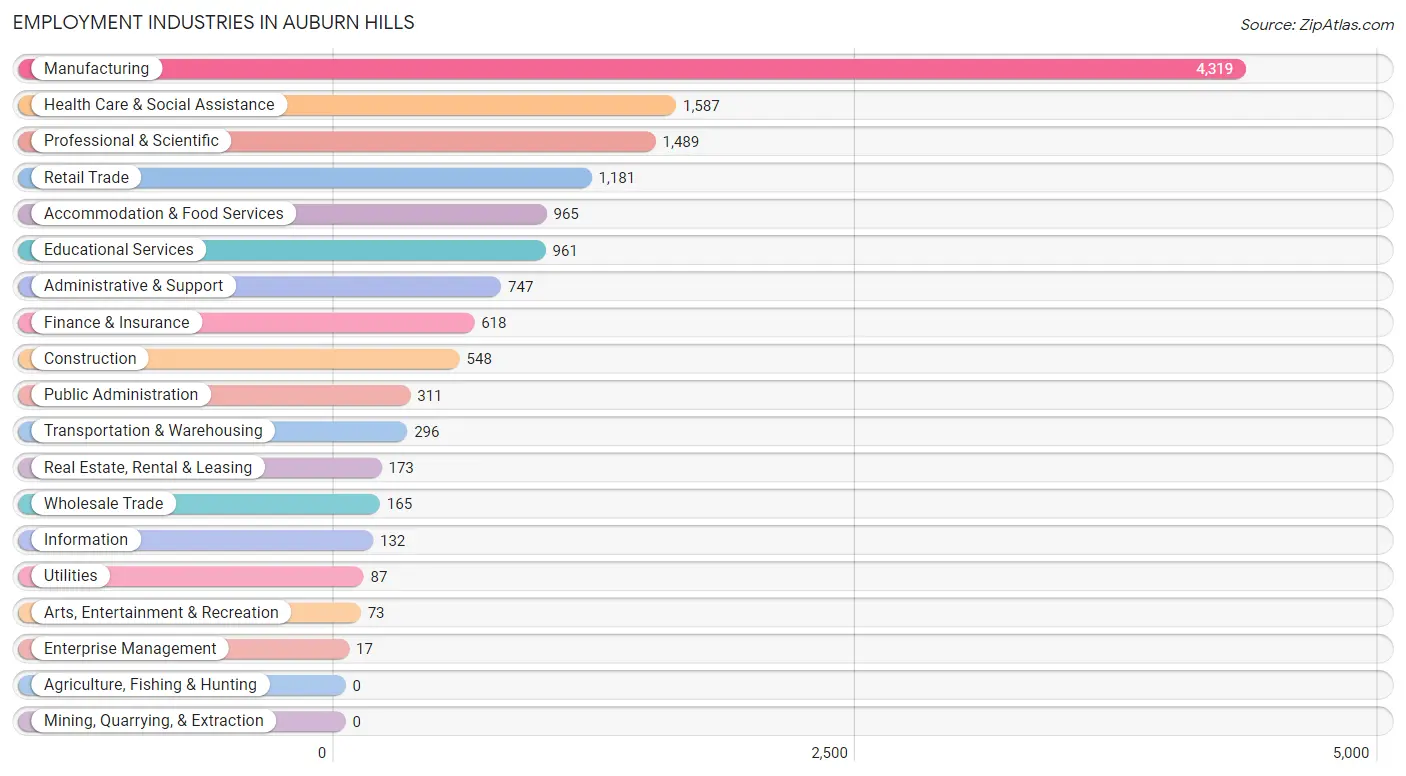
Employment Industries in Auburn Hills
The major employment industries in Auburn Hills include Manufacturing (4,319 | 30.6%), Health Care & Social Assistance (1,587 | 11.2%), Professional & Scientific (1,489 | 10.5%), Retail Trade (1,181 | 8.4%), and Accommodation & Food Services (965 | 6.8%).
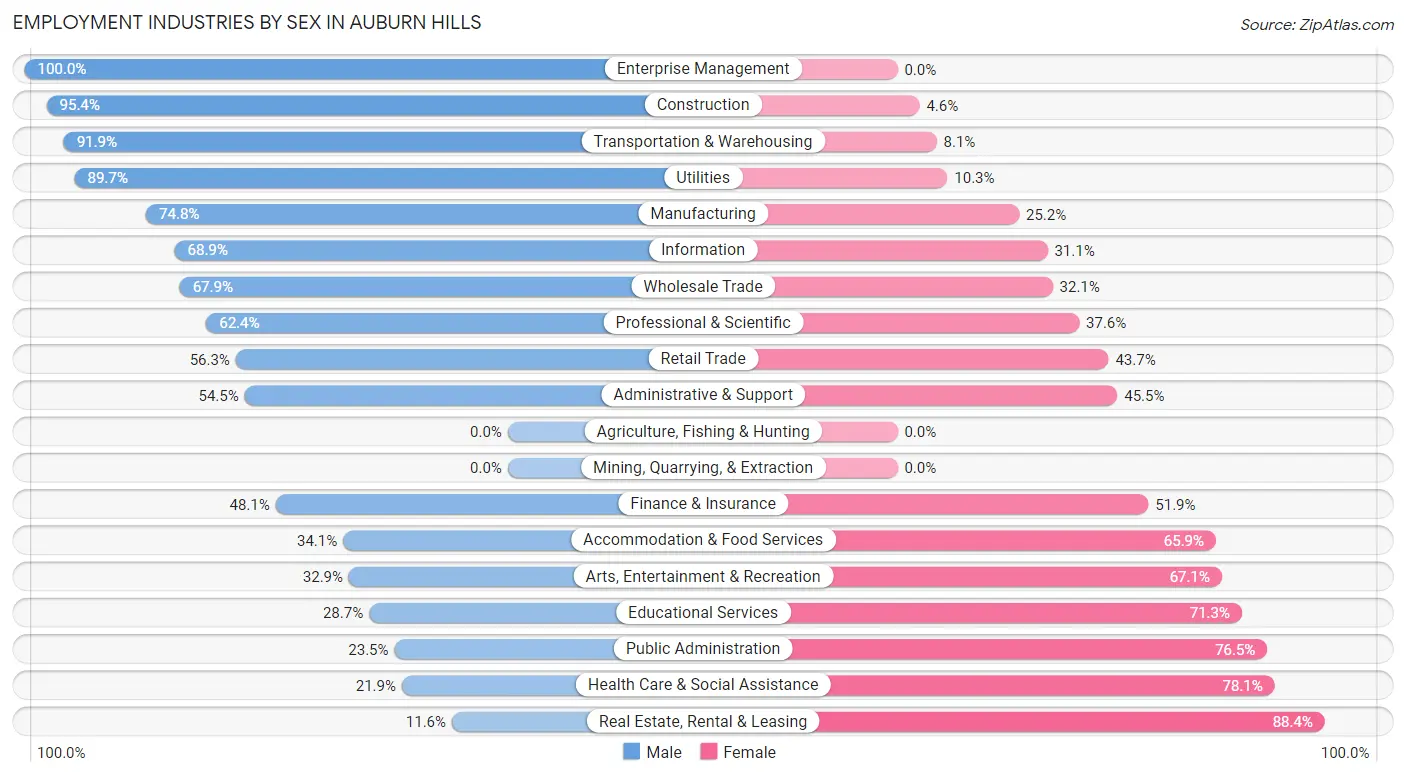
Employment Industries by Sex in Auburn Hills
The Auburn Hills industries that see more men than women are Enterprise Management (100.0%), Construction (95.4%), and Transportation & Warehousing (91.9%), whereas the industries that tend to have a higher number of women are Real Estate, Rental & Leasing (88.4%), Health Care & Social Assistance (78.1%), and Public Administration (76.5%).
| Industry | Male | Female |
| Agriculture, Fishing & Hunting | 0 (0.0%) | 0 (0.0%) |
| Mining, Quarrying, & Extraction | 0 (0.0%) | 0 (0.0%) |
| Construction | 523 (95.4%) | 25 (4.6%) |
| Manufacturing | 3,232 (74.8%) | 1,087 (25.2%) |
| Wholesale Trade | 112 (67.9%) | 53 (32.1%) |
| Retail Trade | 665 (56.3%) | 516 (43.7%) |
| Transportation & Warehousing | 272 (91.9%) | 24 (8.1%) |
| Utilities | 78 (89.7%) | 9 (10.3%) |
| Information | 91 (68.9%) | 41 (31.1%) |
| Finance & Insurance | 297 (48.1%) | 321 (51.9%) |
| Real Estate, Rental & Leasing | 20 (11.6%) | 153 (88.4%) |
| Professional & Scientific | 929 (62.4%) | 560 (37.6%) |
| Enterprise Management | 17 (100.0%) | 0 (0.0%) |
| Administrative & Support | 407 (54.5%) | 340 (45.5%) |
| Educational Services | 276 (28.7%) | 685 (71.3%) |
| Health Care & Social Assistance | 348 (21.9%) | 1,239 (78.1%) |
| Arts, Entertainment & Recreation | 24 (32.9%) | 49 (67.1%) |
| Accommodation & Food Services | 329 (34.1%) | 636 (65.9%) |
| Public Administration | 73 (23.5%) | 238 (76.5%) |
| Total | 7,821 (55.4%) | 6,301 (44.6%) |
Education in Auburn Hills
School Enrollment in Auburn Hills
The most common levels of schooling among the 5,885 students in Auburn Hills are college / undergraduate (2,291 | 38.9%), middle school (1,023 | 17.4%), and graduate / professional (904 | 15.4%).
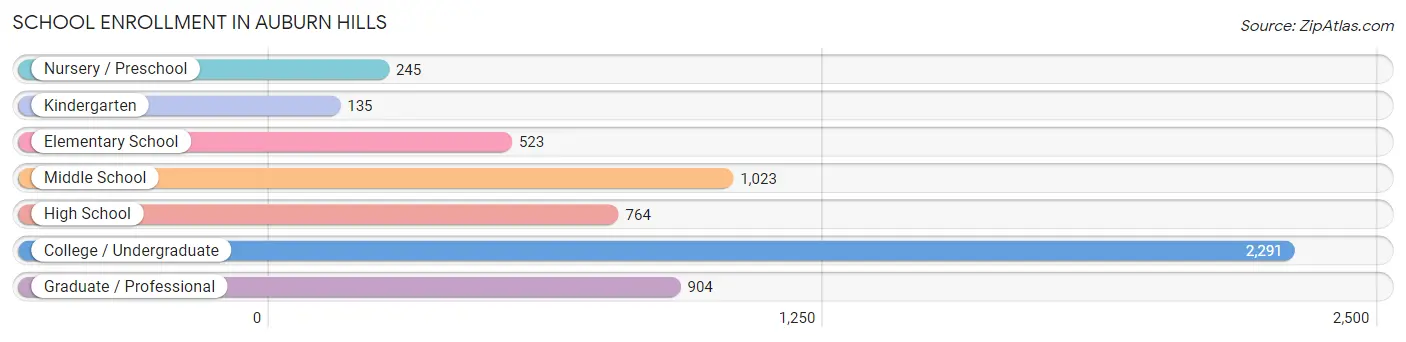
| School Level | # Students | % Students |
| Nursery / Preschool | 245 | 4.2% |
| Kindergarten | 135 | 2.3% |
| Elementary School | 523 | 8.9% |
| Middle School | 1,023 | 17.4% |
| High School | 764 | 13.0% |
| College / Undergraduate | 2,291 | 38.9% |
| Graduate / Professional | 904 | 15.4% |
| Total | 5,885 | 100.0% |
School Enrollment by Age by Funding Source in Auburn Hills
Out of a total of 5,885 students who are enrolled in schools in Auburn Hills, 883 (15.0%) attend a private institution, while the remaining 5,002 (85.0%) are enrolled in public schools. The age group of 35 years and over has the highest likelihood of being enrolled in private schools, with 84 (27.1% in the age bracket) enrolled. Conversely, the age group of 15 to 17 year olds has the lowest likelihood of being enrolled in a private school, with 475 (94.8% in the age bracket) attending a public institution.
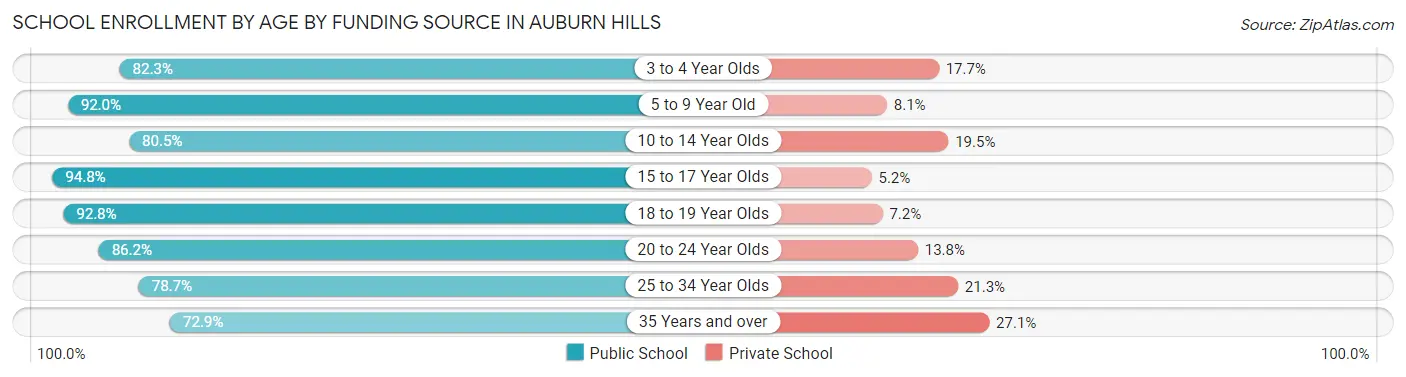
| Age Bracket | Public School | Private School |
| 3 to 4 Year Olds | 186 (82.3%) | 40 (17.7%) |
| 5 to 9 Year Old | 571 (91.9%) | 50 (8.1%) |
| 10 to 14 Year Olds | 930 (80.5%) | 225 (19.5%) |
| 15 to 17 Year Olds | 475 (94.8%) | 26 (5.2%) |
| 18 to 19 Year Olds | 513 (92.8%) | 40 (7.2%) |
| 20 to 24 Year Olds | 1,361 (86.2%) | 218 (13.8%) |
| 25 to 34 Year Olds | 740 (78.7%) | 200 (21.3%) |
| 35 Years and over | 226 (72.9%) | 84 (27.1%) |
| Total | 5,002 (85.0%) | 883 (15.0%) |
Educational Attainment by Field of Study in Auburn Hills
Engineering (2,624 | 29.3%), business (1,432 | 16.0%), science & technology (676 | 7.5%), education (618 | 6.9%), and communications (594 | 6.6%) are the most common fields of study among 8,957 individuals in Auburn Hills who have obtained a bachelor's degree or higher.
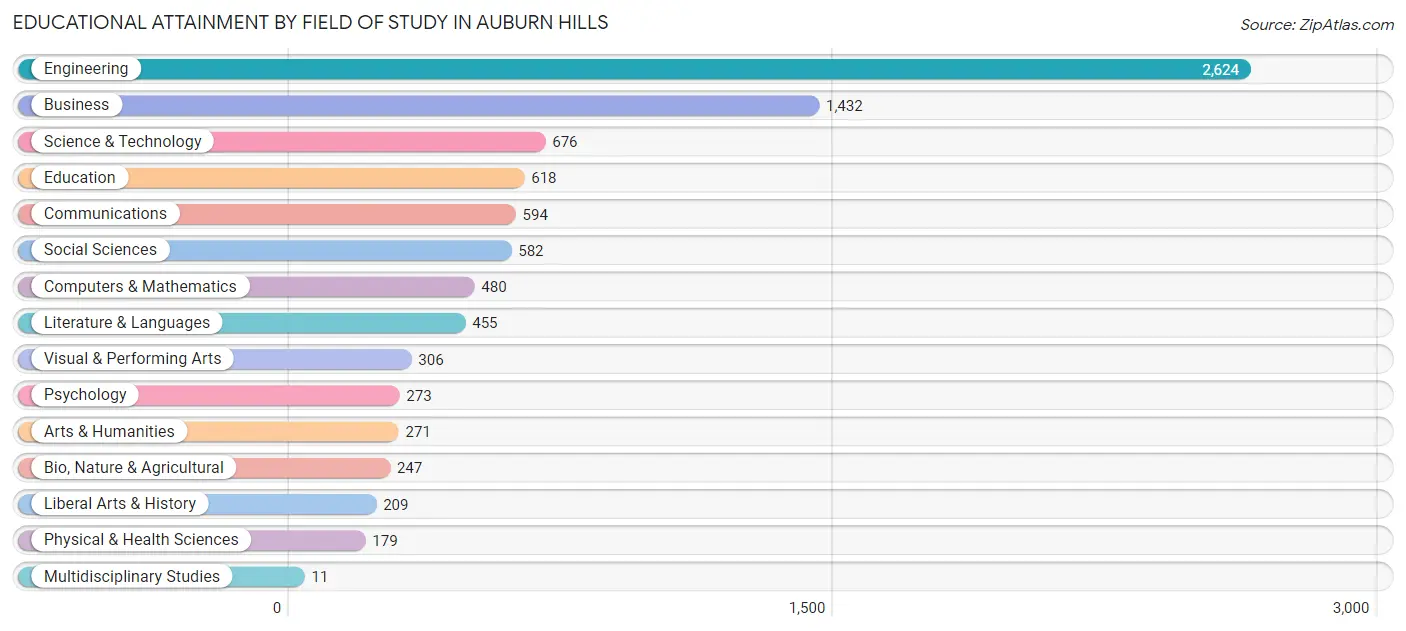
| Field of Study | # Graduates | % Graduates |
| Computers & Mathematics | 480 | 5.4% |
| Bio, Nature & Agricultural | 247 | 2.8% |
| Physical & Health Sciences | 179 | 2.0% |
| Psychology | 273 | 3.0% |
| Social Sciences | 582 | 6.5% |
| Engineering | 2,624 | 29.3% |
| Multidisciplinary Studies | 11 | 0.1% |
| Science & Technology | 676 | 7.5% |
| Business | 1,432 | 16.0% |
| Education | 618 | 6.9% |
| Literature & Languages | 455 | 5.1% |
| Liberal Arts & History | 209 | 2.3% |
| Visual & Performing Arts | 306 | 3.4% |
| Communications | 594 | 6.6% |
| Arts & Humanities | 271 | 3.0% |
| Total | 8,957 | 100.0% |
Transportation & Commute in Auburn Hills
Vehicle Availability by Sex in Auburn Hills
The most prevalent vehicle ownership categories in Auburn Hills are males with 2 vehicles (3,191, accounting for 41.9%) and females with 2 vehicles (2,629, making up 53.7%).
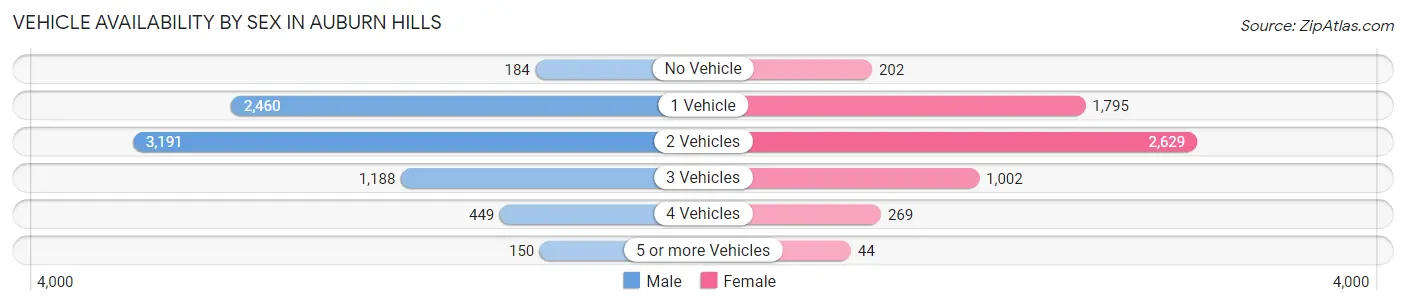
| Vehicles Available | Male | Female |
| No Vehicle | 184 (2.4%) | 202 (3.4%) |
| 1 Vehicle | 2,460 (32.3%) | 1,795 (30.2%) |
| 2 Vehicles | 3,191 (41.9%) | 2,629 (44.3%) |
| 3 Vehicles | 1,188 (15.6%) | 1,002 (16.9%) |
| 4 Vehicles | 449 (5.9%) | 269 (4.5%) |
| 5 or more Vehicles | 150 (2.0%) | 44 (0.7%) |
| Total | 7,622 (100.0%) | 5,941 (100.0%) |
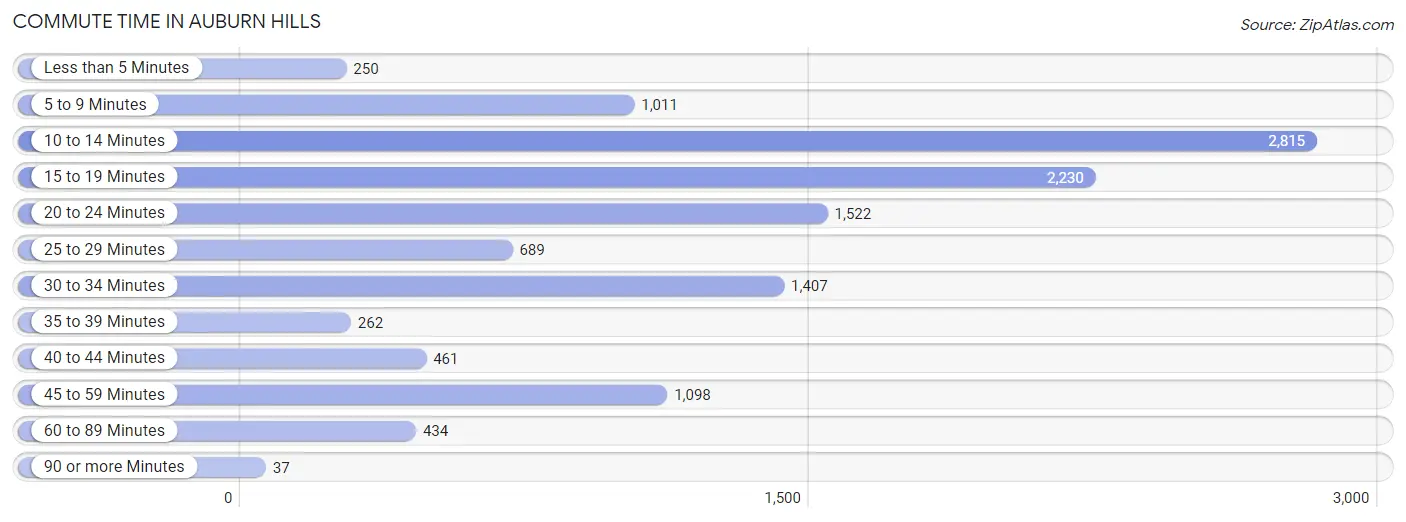
Commute Time in Auburn Hills
The most frequently occuring commute durations in Auburn Hills are 10 to 14 minutes (2,815 commuters, 23.0%), 15 to 19 minutes (2,230 commuters, 18.2%), and 20 to 24 minutes (1,522 commuters, 12.5%).
| Commute Time | # Commuters | % Commuters |
| Less than 5 Minutes | 250 | 2.1% |
| 5 to 9 Minutes | 1,011 | 8.3% |
| 10 to 14 Minutes | 2,815 | 23.0% |
| 15 to 19 Minutes | 2,230 | 18.2% |
| 20 to 24 Minutes | 1,522 | 12.5% |
| 25 to 29 Minutes | 689 | 5.6% |
| 30 to 34 Minutes | 1,407 | 11.5% |
| 35 to 39 Minutes | 262 | 2.1% |
| 40 to 44 Minutes | 461 | 3.8% |
| 45 to 59 Minutes | 1,098 | 9.0% |
| 60 to 89 Minutes | 434 | 3.5% |
| 90 or more Minutes | 37 | 0.3% |
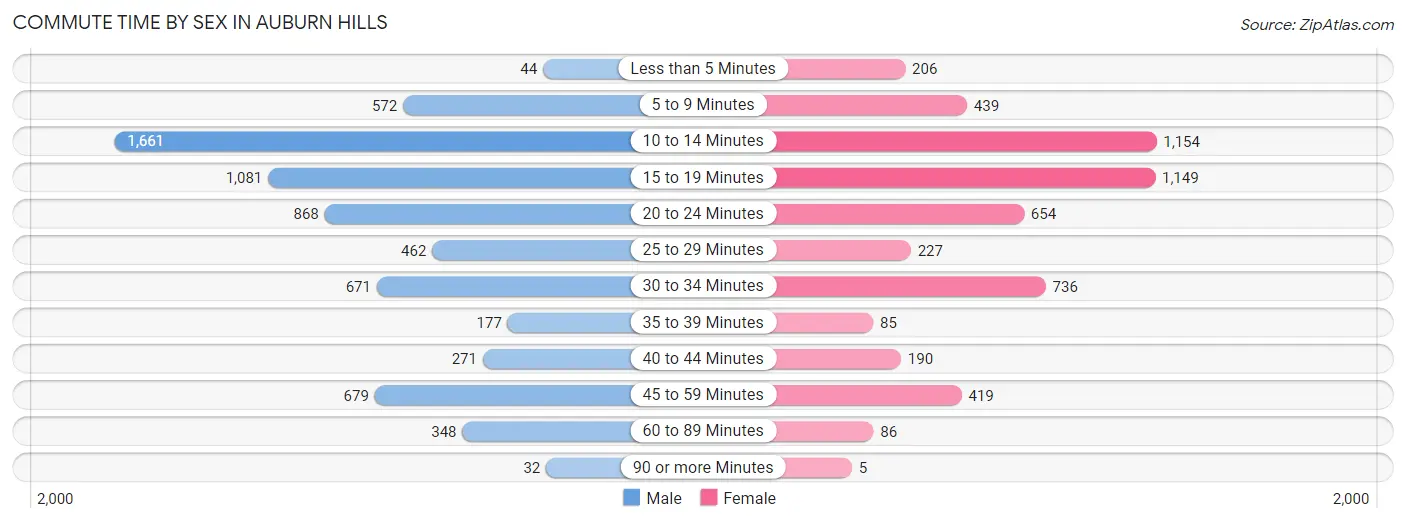
Commute Time by Sex in Auburn Hills
The most common commute times in Auburn Hills are 10 to 14 minutes (1,661 commuters, 24.2%) for males and 10 to 14 minutes (1,154 commuters, 21.6%) for females.
| Commute Time | Male | Female |
| Less than 5 Minutes | 44 (0.6%) | 206 (3.8%) |
| 5 to 9 Minutes | 572 (8.3%) | 439 (8.2%) |
| 10 to 14 Minutes | 1,661 (24.2%) | 1,154 (21.6%) |
| 15 to 19 Minutes | 1,081 (15.7%) | 1,149 (21.5%) |
| 20 to 24 Minutes | 868 (12.6%) | 654 (12.2%) |
| 25 to 29 Minutes | 462 (6.7%) | 227 (4.2%) |
| 30 to 34 Minutes | 671 (9.8%) | 736 (13.8%) |
| 35 to 39 Minutes | 177 (2.6%) | 85 (1.6%) |
| 40 to 44 Minutes | 271 (4.0%) | 190 (3.5%) |
| 45 to 59 Minutes | 679 (9.9%) | 419 (7.8%) |
| 60 to 89 Minutes | 348 (5.1%) | 86 (1.6%) |
| 90 or more Minutes | 32 (0.5%) | 5 (0.1%) |
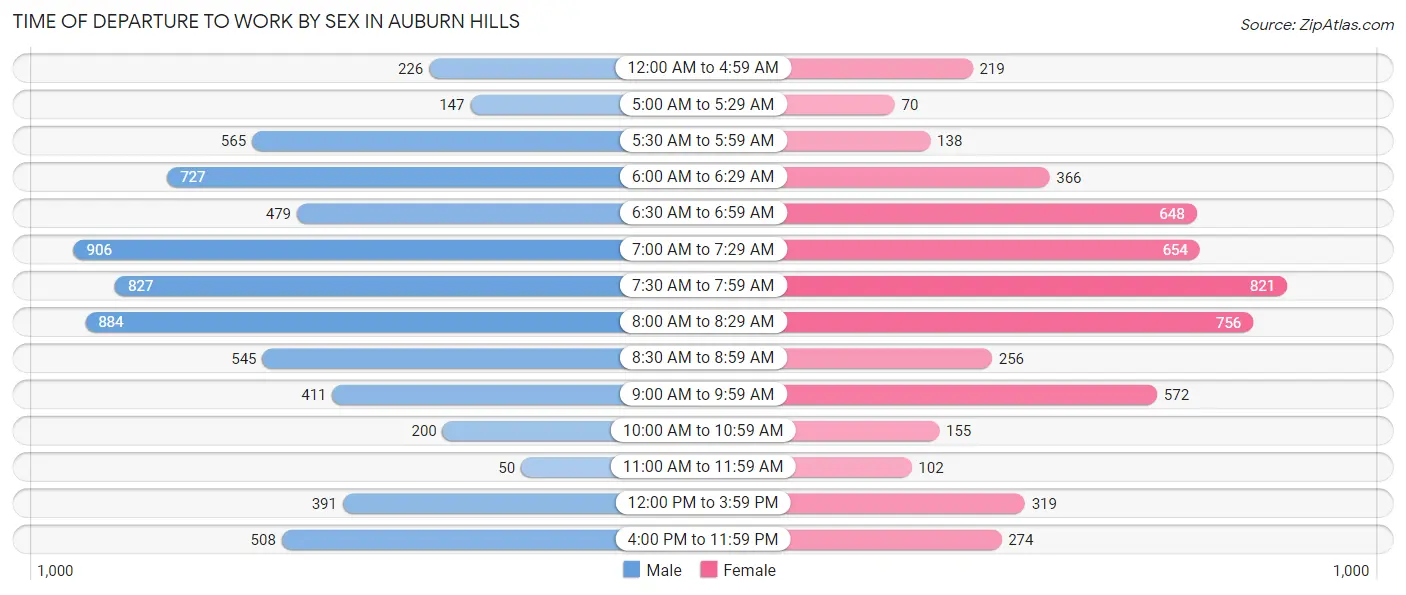
Time of Departure to Work by Sex in Auburn Hills
The most frequent times of departure to work in Auburn Hills are 7:00 AM to 7:29 AM (906, 13.2%) for males and 7:30 AM to 7:59 AM (821, 15.3%) for females.
| Time of Departure | Male | Female |
| 12:00 AM to 4:59 AM | 226 (3.3%) | 219 (4.1%) |
| 5:00 AM to 5:29 AM | 147 (2.1%) | 70 (1.3%) |
| 5:30 AM to 5:59 AM | 565 (8.2%) | 138 (2.6%) |
| 6:00 AM to 6:29 AM | 727 (10.6%) | 366 (6.8%) |
| 6:30 AM to 6:59 AM | 479 (7.0%) | 648 (12.1%) |
| 7:00 AM to 7:29 AM | 906 (13.2%) | 654 (12.2%) |
| 7:30 AM to 7:59 AM | 827 (12.0%) | 821 (15.3%) |
| 8:00 AM to 8:29 AM | 884 (12.9%) | 756 (14.1%) |
| 8:30 AM to 8:59 AM | 545 (7.9%) | 256 (4.8%) |
| 9:00 AM to 9:59 AM | 411 (6.0%) | 572 (10.7%) |
| 10:00 AM to 10:59 AM | 200 (2.9%) | 155 (2.9%) |
| 11:00 AM to 11:59 AM | 50 (0.7%) | 102 (1.9%) |
| 12:00 PM to 3:59 PM | 391 (5.7%) | 319 (6.0%) |
| 4:00 PM to 11:59 PM | 508 (7.4%) | 274 (5.1%) |
| Total | 6,866 (100.0%) | 5,350 (100.0%) |
Housing Occupancy in Auburn Hills
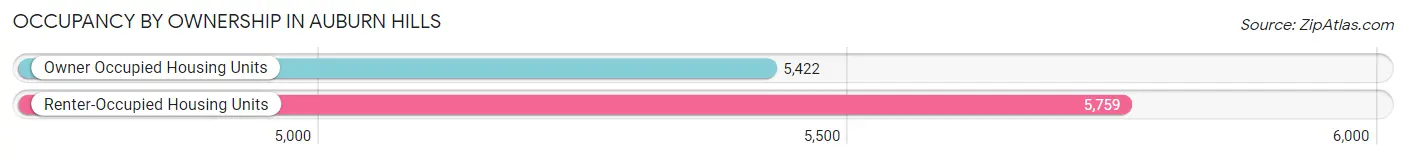
Occupancy by Ownership in Auburn Hills
Of the total 11,181 dwellings in Auburn Hills, owner-occupied units account for 5,422 (48.5%), while renter-occupied units make up 5,759 (51.5%).
| Occupancy | # Housing Units | % Housing Units |
| Owner Occupied Housing Units | 5,422 | 48.5% |
| Renter-Occupied Housing Units | 5,759 | 51.5% |
| Total Occupied Housing Units | 11,181 | 100.0% |
Occupancy by Household Size in Auburn Hills
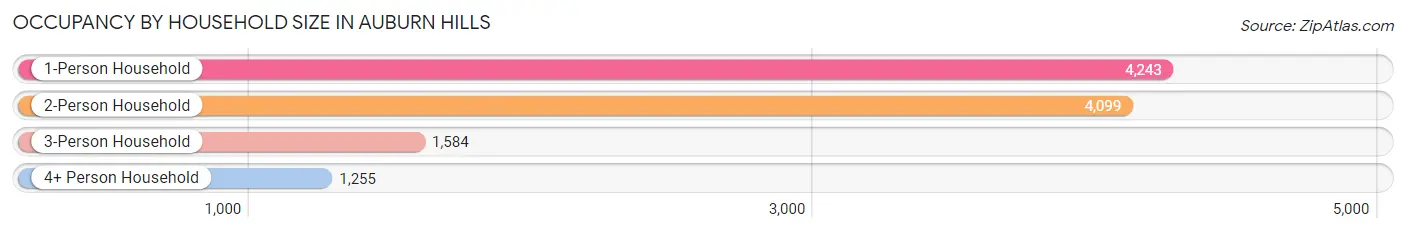
| Household Size | # Housing Units | % Housing Units |
| 1-Person Household | 4,243 | 38.0% |
| 2-Person Household | 4,099 | 36.7% |
| 3-Person Household | 1,584 | 14.2% |
| 4+ Person Household | 1,255 | 11.2% |
| Total Housing Units | 11,181 | 100.0% |
Occupancy by Ownership by Household Size in Auburn Hills
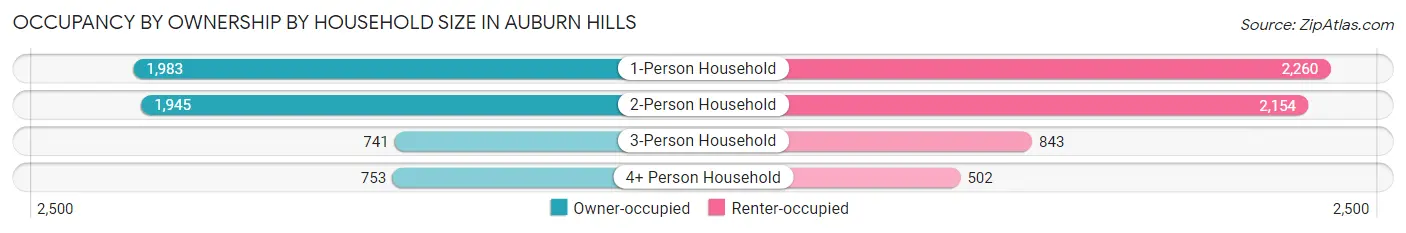
| Household Size | Owner-occupied | Renter-occupied |
| 1-Person Household | 1,983 (46.7%) | 2,260 (53.3%) |
| 2-Person Household | 1,945 (47.4%) | 2,154 (52.5%) |
| 3-Person Household | 741 (46.8%) | 843 (53.2%) |
| 4+ Person Household | 753 (60.0%) | 502 (40.0%) |
| Total Housing Units | 5,422 (48.5%) | 5,759 (51.5%) |
Occupancy by Educational Attainment in Auburn Hills
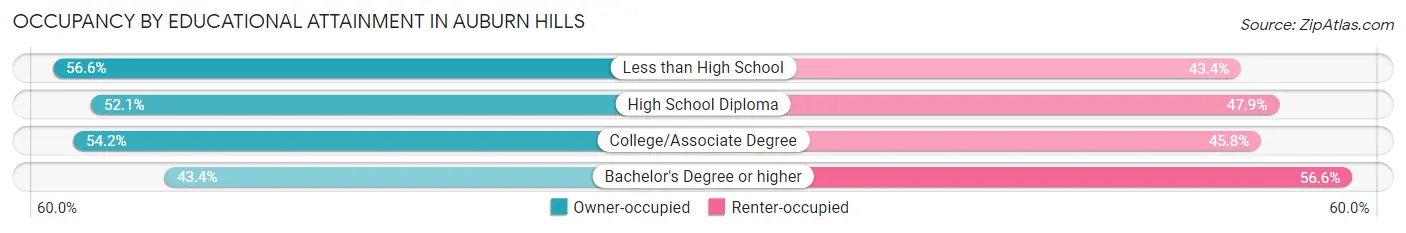
| Household Size | Owner-occupied | Renter-occupied |
| Less than High School | 330 (56.6%) | 253 (43.4%) |
| High School Diploma | 887 (52.1%) | 816 (47.9%) |
| College/Associate Degree | 1,729 (54.2%) | 1,460 (45.8%) |
| Bachelor's Degree or higher | 2,476 (43.4%) | 3,230 (56.6%) |
Occupancy by Age of Householder in Auburn Hills
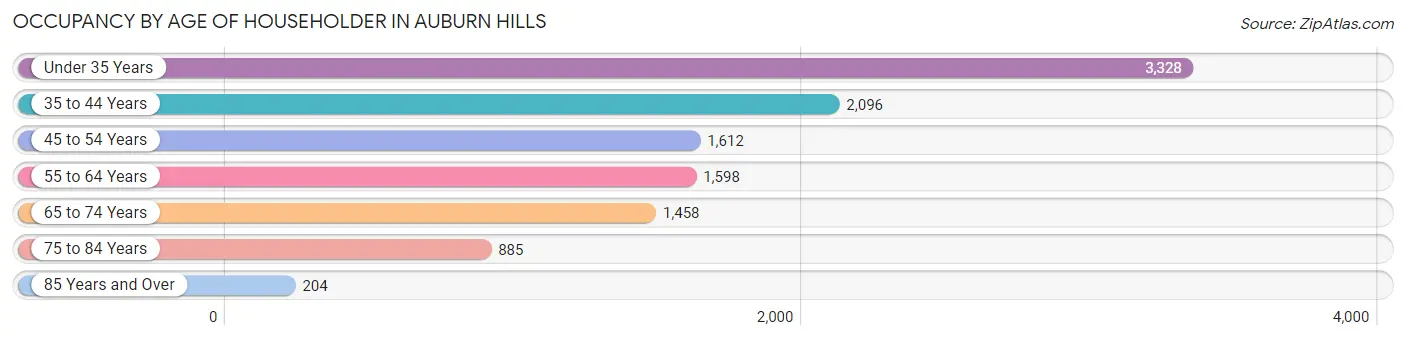
| Age Bracket | # Households | % Households |
| Under 35 Years | 3,328 | 29.8% |
| 35 to 44 Years | 2,096 | 18.8% |
| 45 to 54 Years | 1,612 | 14.4% |
| 55 to 64 Years | 1,598 | 14.3% |
| 65 to 74 Years | 1,458 | 13.0% |
| 75 to 84 Years | 885 | 7.9% |
| 85 Years and Over | 204 | 1.8% |
| Total | 11,181 | 100.0% |
Housing Finances in Auburn Hills
Median Income by Occupancy in Auburn Hills
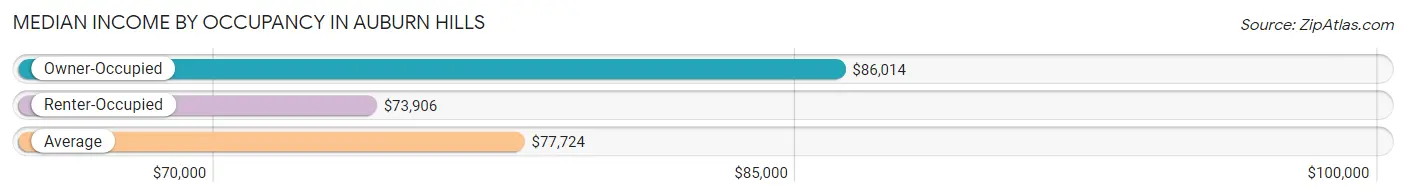
| Occupancy Type | # Households | Median Income |
| Owner-Occupied | 5,422 (48.5%) | $86,014 |
| Renter-Occupied | 5,759 (51.5%) | $73,906 |
| Average | 11,181 (100.0%) | $77,724 |
Occupancy by Householder Income Bracket in Auburn Hills
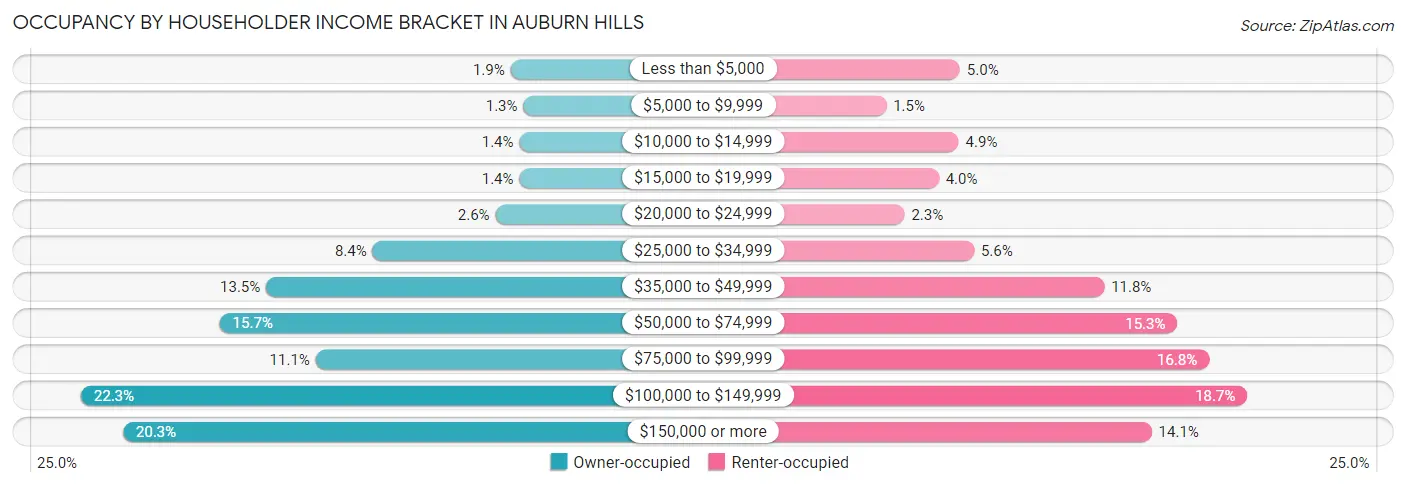
| Income Bracket | Owner-occupied | Renter-occupied |
| Less than $5,000 | 101 (1.9%) | 286 (5.0%) |
| $5,000 to $9,999 | 68 (1.3%) | 84 (1.5%) |
| $10,000 to $14,999 | 78 (1.4%) | 283 (4.9%) |
| $15,000 to $19,999 | 78 (1.4%) | 228 (4.0%) |
| $20,000 to $24,999 | 140 (2.6%) | 134 (2.3%) |
| $25,000 to $34,999 | 457 (8.4%) | 325 (5.6%) |
| $35,000 to $49,999 | 732 (13.5%) | 682 (11.8%) |
| $50,000 to $74,999 | 852 (15.7%) | 882 (15.3%) |
| $75,000 to $99,999 | 604 (11.1%) | 969 (16.8%) |
| $100,000 to $149,999 | 1,210 (22.3%) | 1,074 (18.6%) |
| $150,000 or more | 1,102 (20.3%) | 812 (14.1%) |
| Total | 5,422 (100.0%) | 5,759 (100.0%) |
Monthly Housing Cost Tiers in Auburn Hills
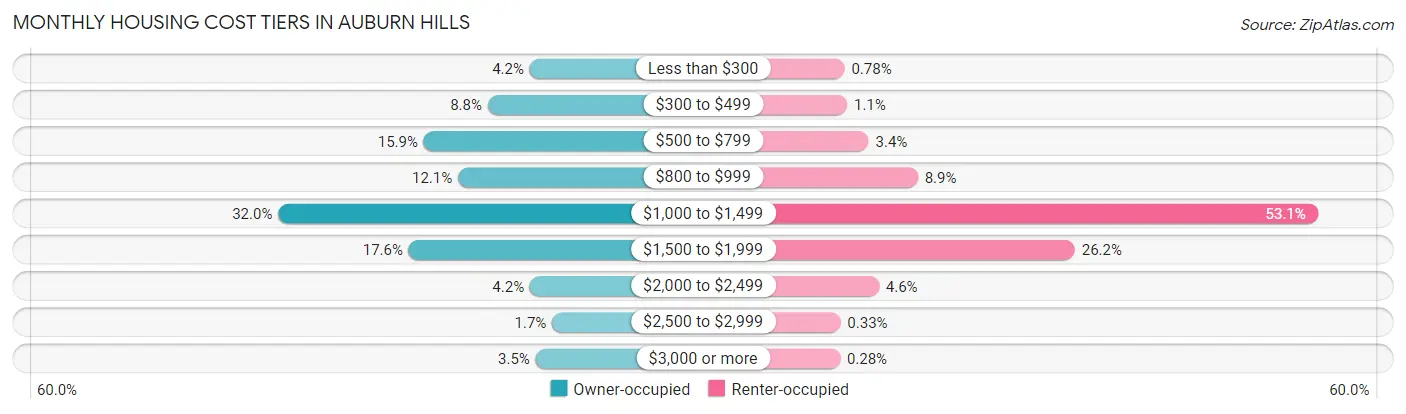
| Monthly Cost | Owner-occupied | Renter-occupied |
| Less than $300 | 227 (4.2%) | 45 (0.8%) |
| $300 to $499 | 479 (8.8%) | 61 (1.1%) |
| $500 to $799 | 862 (15.9%) | 198 (3.4%) |
| $800 to $999 | 657 (12.1%) | 511 (8.9%) |
| $1,000 to $1,499 | 1,734 (32.0%) | 3,055 (53.0%) |
| $1,500 to $1,999 | 952 (17.6%) | 1,510 (26.2%) |
| $2,000 to $2,499 | 226 (4.2%) | 264 (4.6%) |
| $2,500 to $2,999 | 93 (1.7%) | 19 (0.3%) |
| $3,000 or more | 192 (3.5%) | 16 (0.3%) |
| Total | 5,422 (100.0%) | 5,759 (100.0%) |
Physical Housing Characteristics in Auburn Hills
Housing Structures in Auburn Hills
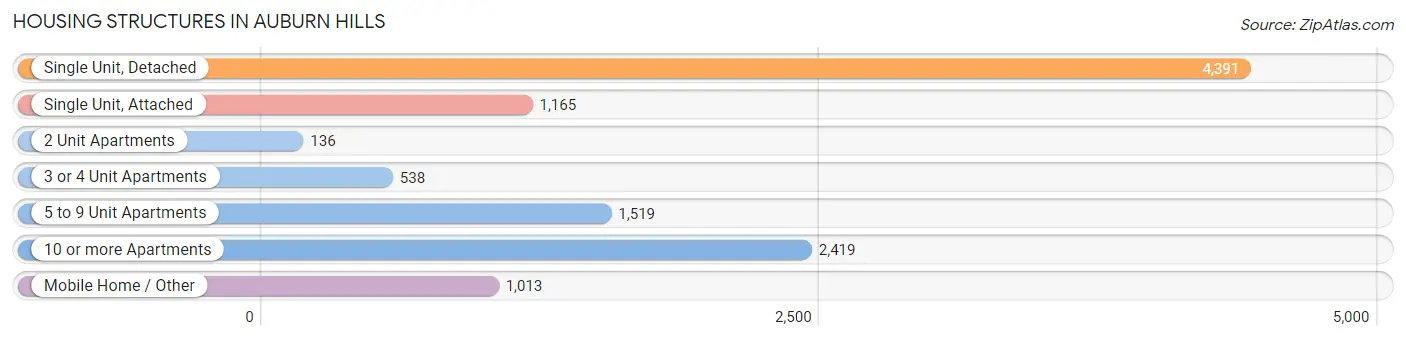
| Structure Type | # Housing Units | % Housing Units |
| Single Unit, Detached | 4,391 | 39.3% |
| Single Unit, Attached | 1,165 | 10.4% |
| 2 Unit Apartments | 136 | 1.2% |
| 3 or 4 Unit Apartments | 538 | 4.8% |
| 5 to 9 Unit Apartments | 1,519 | 13.6% |
| 10 or more Apartments | 2,419 | 21.6% |
| Mobile Home / Other | 1,013 | 9.1% |
| Total | 11,181 | 100.0% |
Housing Structures by Occupancy in Auburn Hills
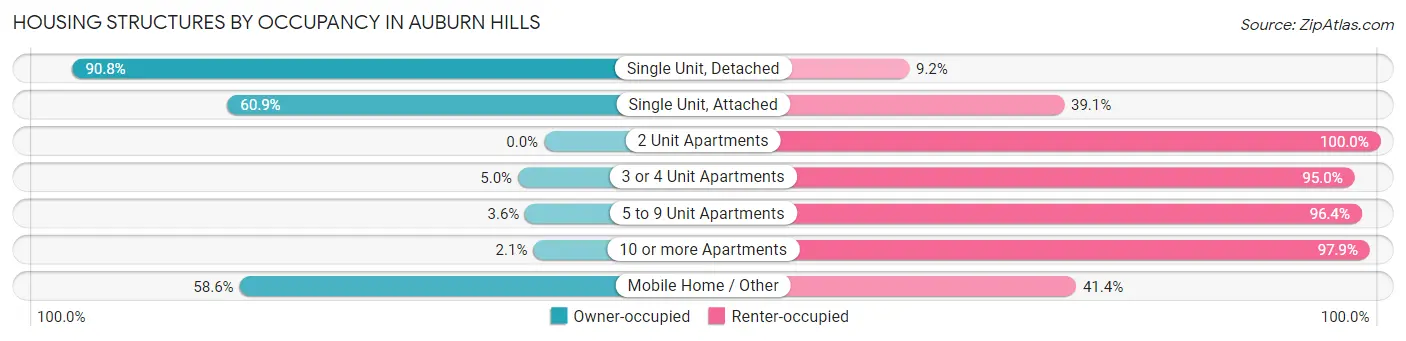
| Structure Type | Owner-occupied | Renter-occupied |
| Single Unit, Detached | 3,986 (90.8%) | 405 (9.2%) |
| Single Unit, Attached | 710 (60.9%) | 455 (39.1%) |
| 2 Unit Apartments | 0 (0.0%) | 136 (100.0%) |
| 3 or 4 Unit Apartments | 27 (5.0%) | 511 (95.0%) |
| 5 to 9 Unit Apartments | 55 (3.6%) | 1,464 (96.4%) |
| 10 or more Apartments | 50 (2.1%) | 2,369 (97.9%) |
| Mobile Home / Other | 594 (58.6%) | 419 (41.4%) |
| Total | 5,422 (48.5%) | 5,759 (51.5%) |
Housing Structures by Number of Rooms in Auburn Hills
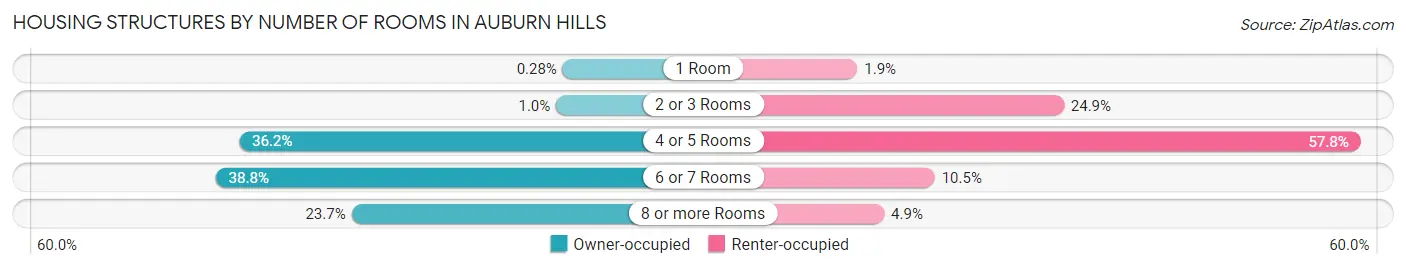
| Number of Rooms | Owner-occupied | Renter-occupied |
| 1 Room | 15 (0.3%) | 111 (1.9%) |
| 2 or 3 Rooms | 55 (1.0%) | 1,431 (24.8%) |
| 4 or 5 Rooms | 1,963 (36.2%) | 3,328 (57.8%) |
| 6 or 7 Rooms | 2,103 (38.8%) | 606 (10.5%) |
| 8 or more Rooms | 1,286 (23.7%) | 283 (4.9%) |
| Total | 5,422 (100.0%) | 5,759 (100.0%) |
Housing Structure by Heating Type in Auburn Hills
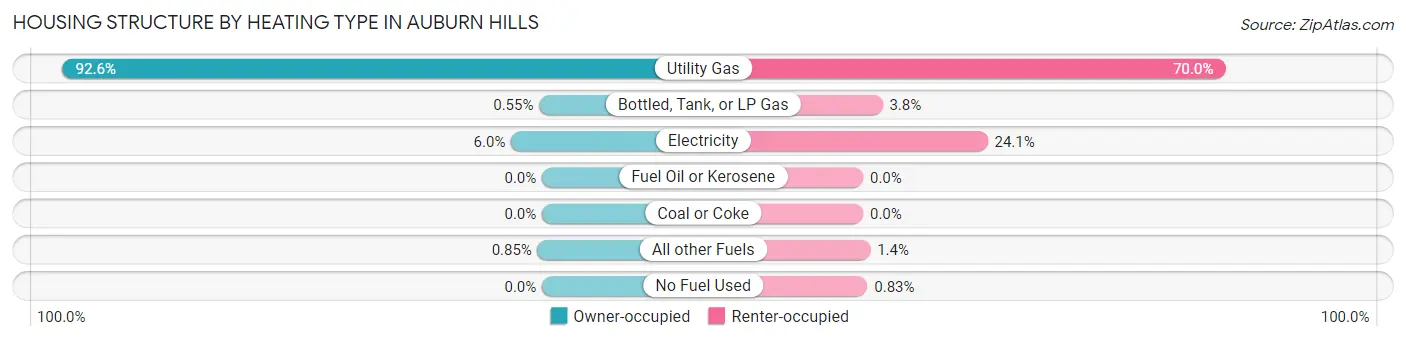
| Heating Type | Owner-occupied | Renter-occupied |
| Utility Gas | 5,023 (92.6%) | 4,030 (70.0%) |
| Bottled, Tank, or LP Gas | 30 (0.5%) | 216 (3.7%) |
| Electricity | 323 (6.0%) | 1,385 (24.0%) |
| Fuel Oil or Kerosene | 0 (0.0%) | 0 (0.0%) |
| Coal or Coke | 0 (0.0%) | 0 (0.0%) |
| All other Fuels | 46 (0.9%) | 80 (1.4%) |
| No Fuel Used | 0 (0.0%) | 48 (0.8%) |
| Total | 5,422 (100.0%) | 5,759 (100.0%) |
Household Vehicle Usage in Auburn Hills
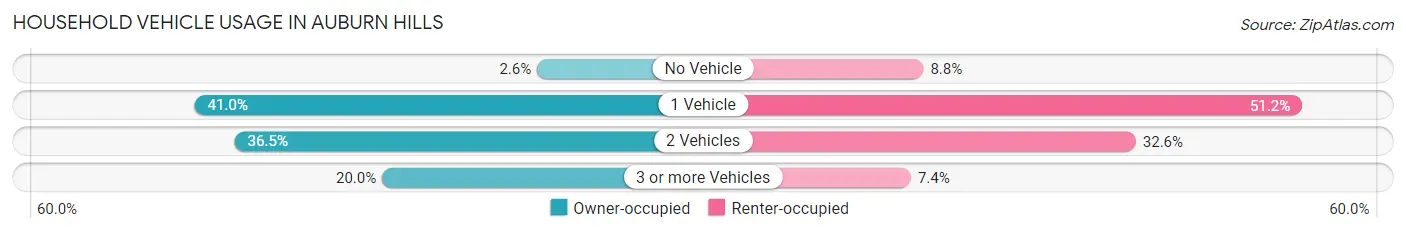
| Vehicles per Household | Owner-occupied | Renter-occupied |
| No Vehicle | 141 (2.6%) | 507 (8.8%) |
| 1 Vehicle | 2,221 (41.0%) | 2,949 (51.2%) |
| 2 Vehicles | 1,978 (36.5%) | 1,877 (32.6%) |
| 3 or more Vehicles | 1,082 (20.0%) | 426 (7.4%) |
| Total | 5,422 (100.0%) | 5,759 (100.0%) |
Real Estate & Mortgages in Auburn Hills
Real Estate and Mortgage Overview in Auburn Hills
| Characteristic | Without Mortgage | With Mortgage |
| Housing Units | 2,299 | 3,123 |
| Median Property Value | $196,000 | $220,800 |
| Median Household Income | $55,707 | $848 |
| Monthly Housing Costs | $685 | $192 |
| Real Estate Taxes | $3,055 | $131 |
Property Value by Mortgage Status in Auburn Hills
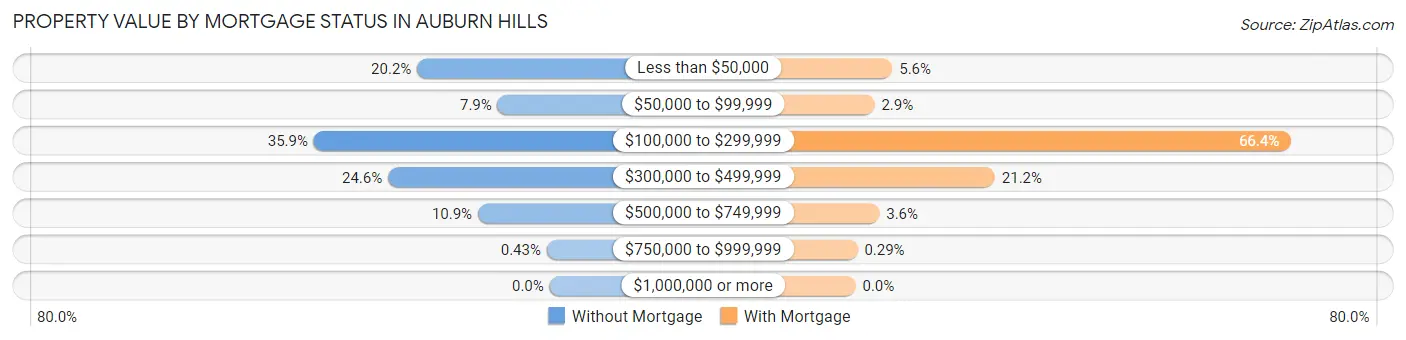
| Property Value | Without Mortgage | With Mortgage |
| Less than $50,000 | 464 (20.2%) | 175 (5.6%) |
| $50,000 to $99,999 | 182 (7.9%) | 90 (2.9%) |
| $100,000 to $299,999 | 826 (35.9%) | 2,073 (66.4%) |
| $300,000 to $499,999 | 566 (24.6%) | 663 (21.2%) |
| $500,000 to $749,999 | 251 (10.9%) | 113 (3.6%) |
| $750,000 to $999,999 | 10 (0.4%) | 9 (0.3%) |
| $1,000,000 or more | 0 (0.0%) | 0 (0.0%) |
| Total | 2,299 (100.0%) | 3,123 (100.0%) |
Household Income by Mortgage Status in Auburn Hills
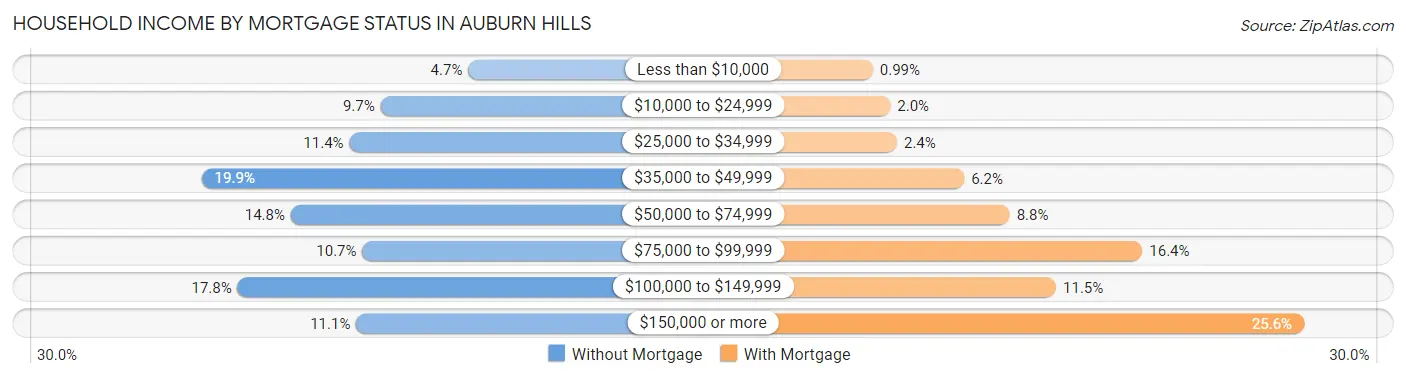
| Household Income | Without Mortgage | With Mortgage |
| Less than $10,000 | 107 (4.6%) | 31 (1.0%) |
| $10,000 to $24,999 | 222 (9.7%) | 62 (2.0%) |
| $25,000 to $34,999 | 263 (11.4%) | 74 (2.4%) |
| $35,000 to $49,999 | 457 (19.9%) | 194 (6.2%) |
| $50,000 to $74,999 | 340 (14.8%) | 275 (8.8%) |
| $75,000 to $99,999 | 246 (10.7%) | 512 (16.4%) |
| $100,000 to $149,999 | 410 (17.8%) | 358 (11.5%) |
| $150,000 or more | 254 (11.1%) | 800 (25.6%) |
| Total | 2,299 (100.0%) | 3,123 (100.0%) |
Property Value to Household Income Ratio in Auburn Hills
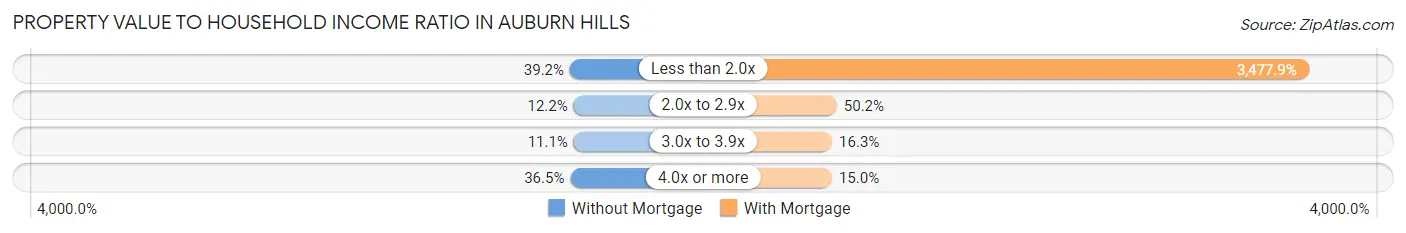
| Value-to-Income Ratio | Without Mortgage | With Mortgage |
| Less than 2.0x | 900 (39.2%) | 108,616 (3,477.9%) |
| 2.0x to 2.9x | 280 (12.2%) | 1,569 (50.2%) |
| 3.0x to 3.9x | 255 (11.1%) | 508 (16.3%) |
| 4.0x or more | 838 (36.4%) | 469 (15.0%) |
| Total | 2,299 (100.0%) | 3,123 (100.0%) |
Real Estate Taxes by Mortgage Status in Auburn Hills
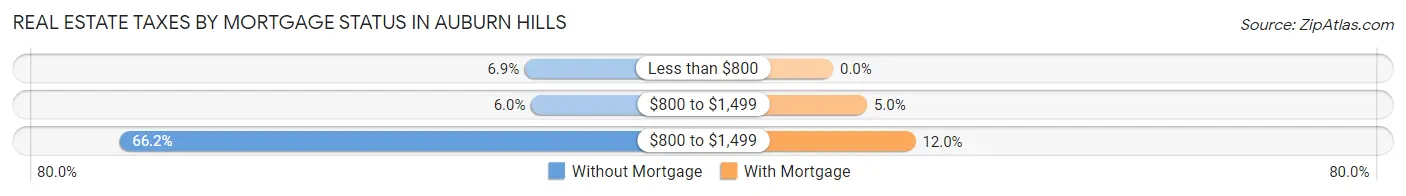
| Property Taxes | Without Mortgage | With Mortgage |
| Less than $800 | 158 (6.9%) | 0 (0.0%) |
| $800 to $1,499 | 137 (6.0%) | 155 (5.0%) |
| $800 to $1,499 | 1,521 (66.2%) | 376 (12.0%) |
| Total | 2,299 (100.0%) | 3,123 (100.0%) |
Health & Disability in Auburn Hills
Health Insurance Coverage by Age in Auburn Hills
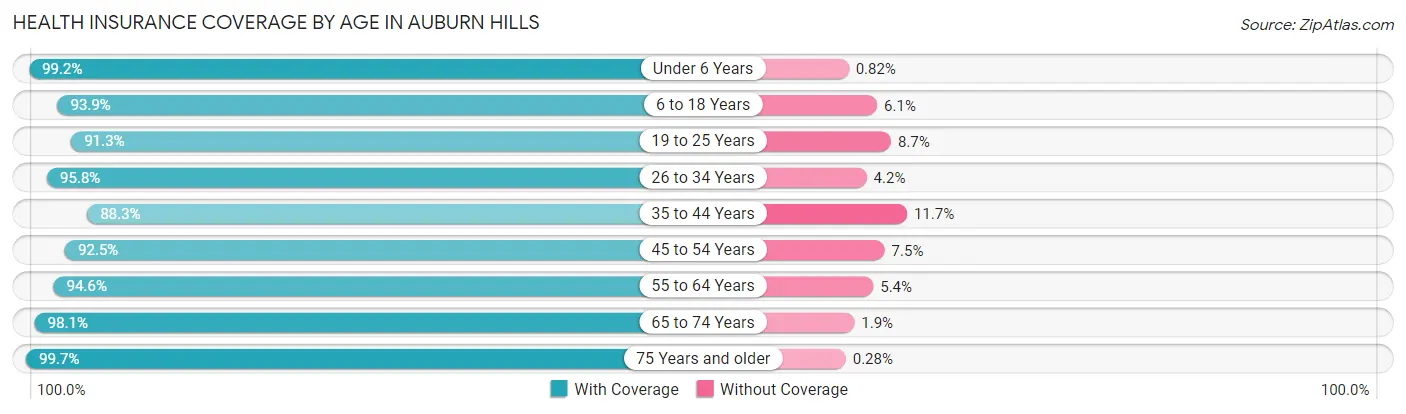
| Age Bracket | With Coverage | Without Coverage |
| Under 6 Years | 1,216 (99.2%) | 10 (0.8%) |
| 6 to 18 Years | 2,312 (93.9%) | 151 (6.1%) |
| 19 to 25 Years | 3,482 (91.3%) | 332 (8.7%) |
| 26 to 34 Years | 4,435 (95.8%) | 193 (4.2%) |
| 35 to 44 Years | 2,802 (88.3%) | 371 (11.7%) |
| 45 to 54 Years | 2,457 (92.5%) | 200 (7.5%) |
| 55 to 64 Years | 2,676 (94.6%) | 153 (5.4%) |
| 65 to 74 Years | 2,187 (98.1%) | 42 (1.9%) |
| 75 Years and older | 1,409 (99.7%) | 4 (0.3%) |
| Total | 22,976 (94.0%) | 1,456 (6.0%) |
Health Insurance Coverage by Citizenship Status in Auburn Hills
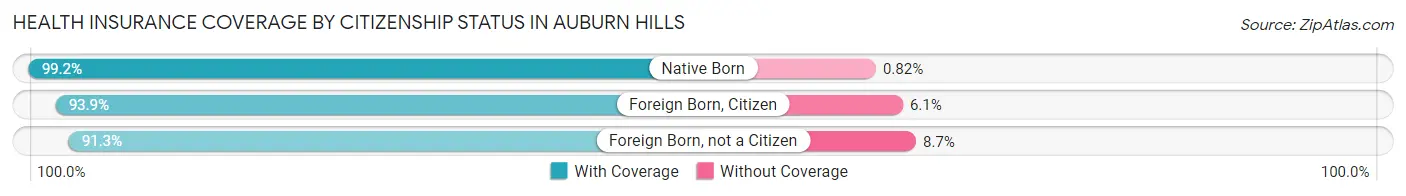
| Citizenship Status | With Coverage | Without Coverage |
| Native Born | 1,216 (99.2%) | 10 (0.8%) |
| Foreign Born, Citizen | 2,312 (93.9%) | 151 (6.1%) |
| Foreign Born, not a Citizen | 3,482 (91.3%) | 332 (8.7%) |
Health Insurance Coverage by Household Income in Auburn Hills
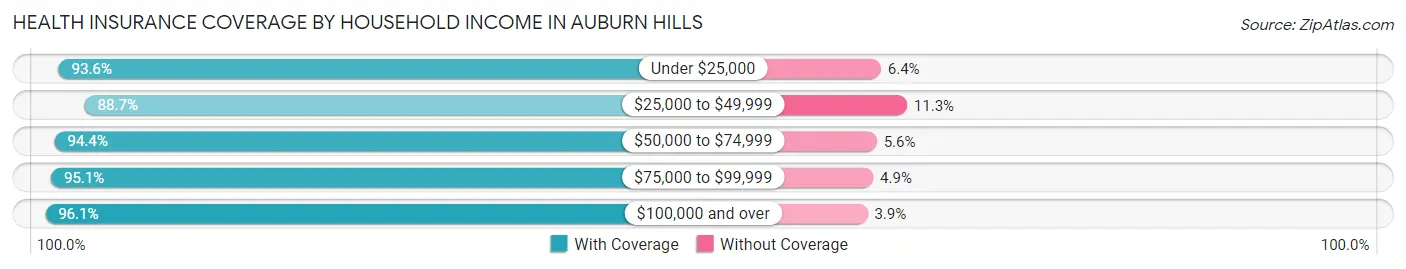
| Household Income | With Coverage | Without Coverage |
| Under $25,000 | 2,097 (93.6%) | 143 (6.4%) |
| $25,000 to $49,999 | 3,238 (88.7%) | 411 (11.3%) |
| $50,000 to $74,999 | 3,598 (94.4%) | 214 (5.6%) |
| $75,000 to $99,999 | 3,351 (95.1%) | 174 (4.9%) |
| $100,000 and over | 10,076 (96.1%) | 406 (3.9%) |
Public vs Private Health Insurance Coverage by Age in Auburn Hills
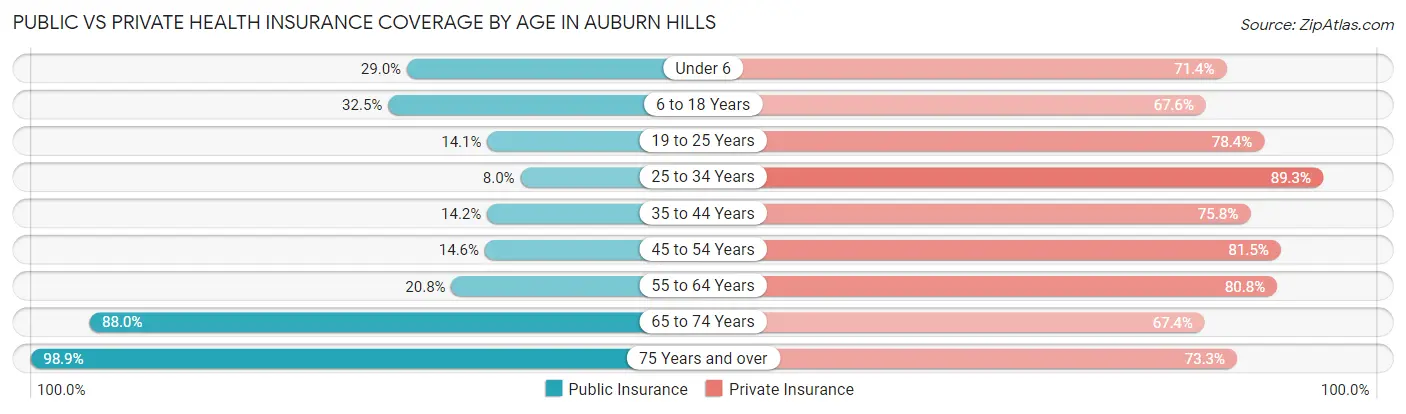
| Age Bracket | Public Insurance | Private Insurance |
| Under 6 | 356 (29.0%) | 875 (71.4%) |
| 6 to 18 Years | 801 (32.5%) | 1,664 (67.6%) |
| 19 to 25 Years | 538 (14.1%) | 2,989 (78.4%) |
| 25 to 34 Years | 369 (8.0%) | 4,132 (89.3%) |
| 35 to 44 Years | 449 (14.1%) | 2,404 (75.8%) |
| 45 to 54 Years | 387 (14.6%) | 2,164 (81.5%) |
| 55 to 64 Years | 588 (20.8%) | 2,285 (80.8%) |
| 65 to 74 Years | 1,962 (88.0%) | 1,502 (67.4%) |
| 75 Years and over | 1,398 (98.9%) | 1,036 (73.3%) |
| Total | 6,848 (28.0%) | 19,051 (78.0%) |
Disability Status by Sex by Age in Auburn Hills
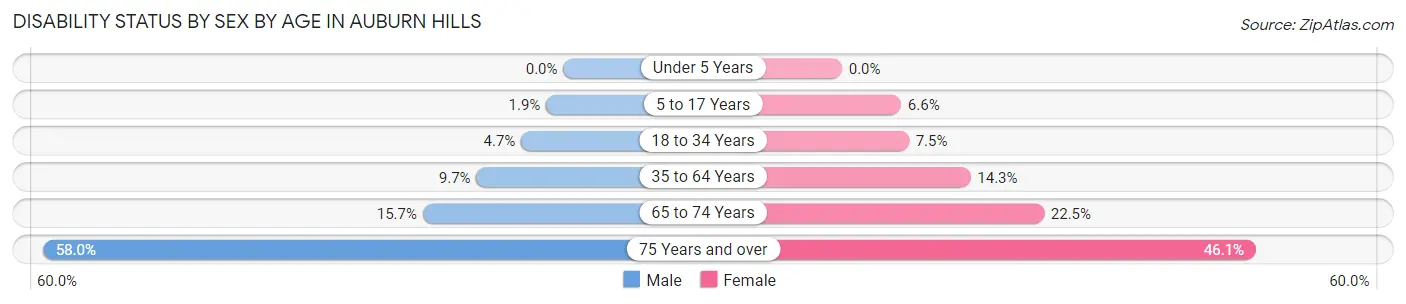
| Age Bracket | Male | Female |
| Under 5 Years | 0 (0.0%) | 0 (0.0%) |
| 5 to 17 Years | 23 (1.9%) | 79 (6.6%) |
| 18 to 34 Years | 213 (4.7%) | 307 (7.4%) |
| 35 to 64 Years | 432 (9.7%) | 601 (14.3%) |
| 65 to 74 Years | 161 (15.7%) | 270 (22.5%) |
| 75 Years and over | 378 (58.0%) | 351 (46.1%) |
Disability Class by Sex by Age in Auburn Hills
Disability Class: Hearing Difficulty
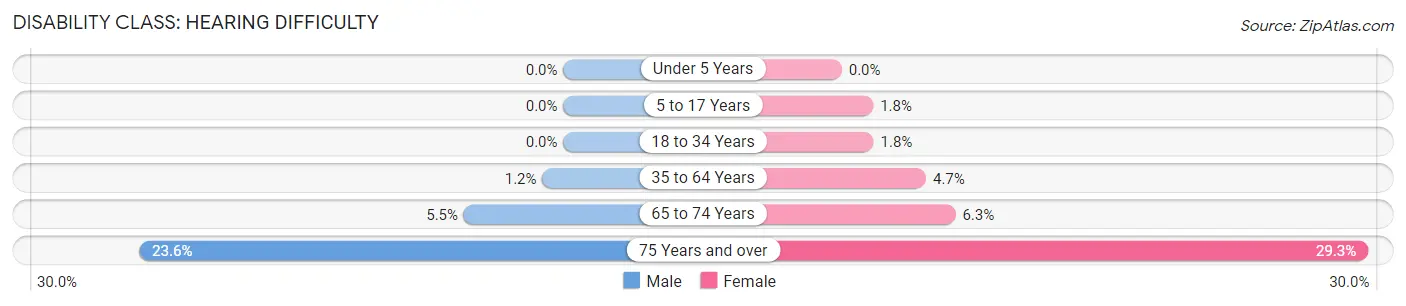
| Age Bracket | Male | Female |
| Under 5 Years | 0 (0.0%) | 0 (0.0%) |
| 5 to 17 Years | 0 (0.0%) | 21 (1.8%) |
| 18 to 34 Years | 0 (0.0%) | 73 (1.8%) |
| 35 to 64 Years | 52 (1.2%) | 197 (4.7%) |
| 65 to 74 Years | 57 (5.5%) | 76 (6.3%) |
| 75 Years and over | 154 (23.6%) | 223 (29.3%) |
Disability Class: Vision Difficulty
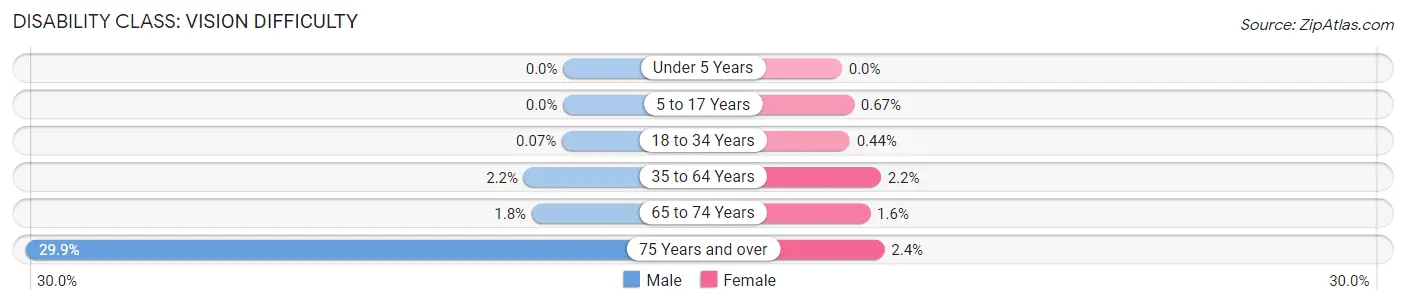
| Age Bracket | Male | Female |
| Under 5 Years | 0 (0.0%) | 0 (0.0%) |
| 5 to 17 Years | 0 (0.0%) | 8 (0.7%) |
| 18 to 34 Years | 3 (0.1%) | 18 (0.4%) |
| 35 to 64 Years | 98 (2.2%) | 91 (2.2%) |
| 65 to 74 Years | 18 (1.8%) | 19 (1.6%) |
| 75 Years and over | 195 (29.9%) | 18 (2.4%) |
Disability Class: Cognitive Difficulty
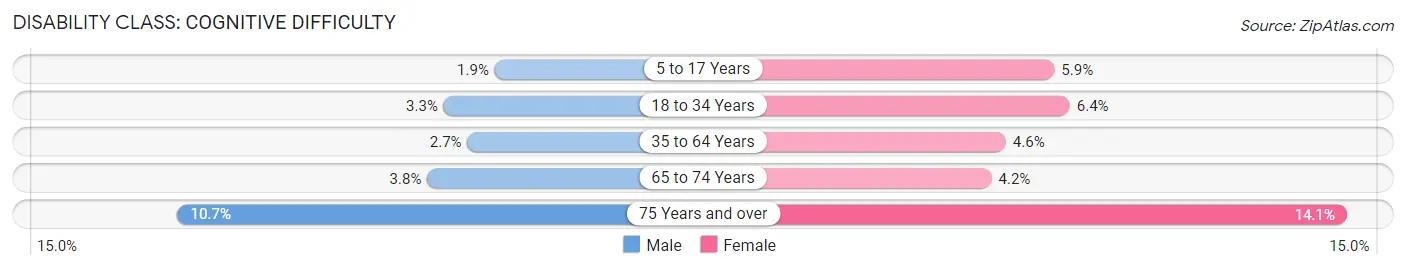
| Age Bracket | Male | Female |
| 5 to 17 Years | 23 (1.9%) | 71 (5.9%) |
| 18 to 34 Years | 151 (3.3%) | 262 (6.4%) |
| 35 to 64 Years | 119 (2.7%) | 192 (4.6%) |
| 65 to 74 Years | 39 (3.8%) | 50 (4.2%) |
| 75 Years and over | 70 (10.7%) | 107 (14.1%) |
Disability Class: Ambulatory Difficulty
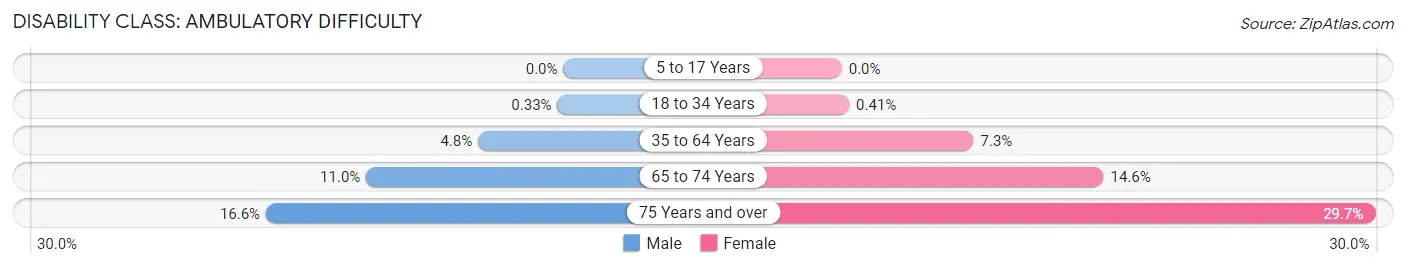
| Age Bracket | Male | Female |
| 5 to 17 Years | 0 (0.0%) | 0 (0.0%) |
| 18 to 34 Years | 15 (0.3%) | 17 (0.4%) |
| 35 to 64 Years | 212 (4.8%) | 308 (7.3%) |
| 65 to 74 Years | 113 (11.0%) | 175 (14.6%) |
| 75 Years and over | 108 (16.6%) | 226 (29.7%) |
Disability Class: Self-Care Difficulty
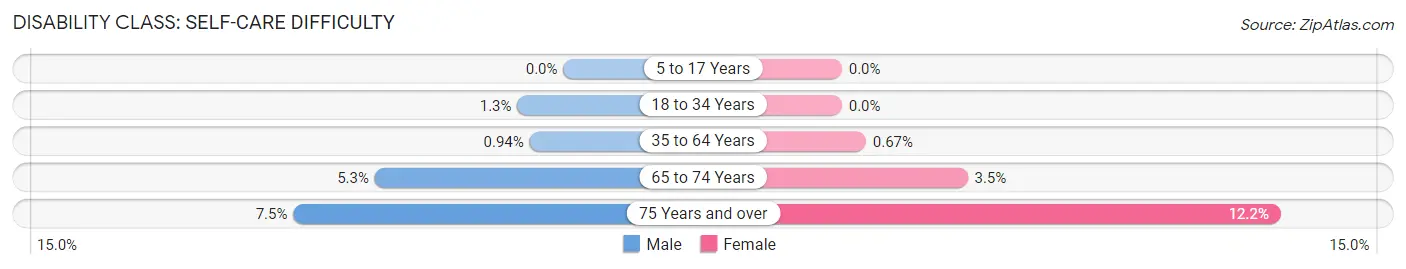
| Age Bracket | Male | Female |
| 5 to 17 Years | 0 (0.0%) | 0 (0.0%) |
| 18 to 34 Years | 58 (1.3%) | 0 (0.0%) |
| 35 to 64 Years | 42 (0.9%) | 28 (0.7%) |
| 65 to 74 Years | 54 (5.2%) | 42 (3.5%) |
| 75 Years and over | 49 (7.5%) | 93 (12.2%) |
Technology Access in Auburn Hills
Computing Device Access in Auburn Hills
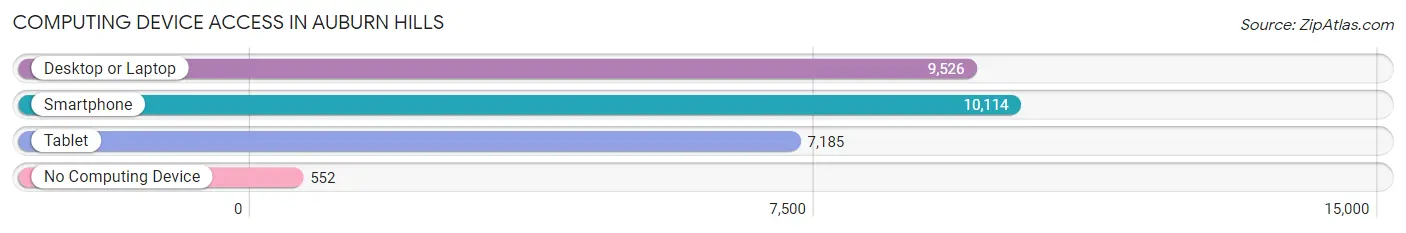
| Device Type | # Households | % Households |
| Desktop or Laptop | 9,526 | 85.2% |
| Smartphone | 10,114 | 90.5% |
| Tablet | 7,185 | 64.3% |
| No Computing Device | 552 | 4.9% |
| Total | 11,181 | 100.0% |
Internet Access in Auburn Hills
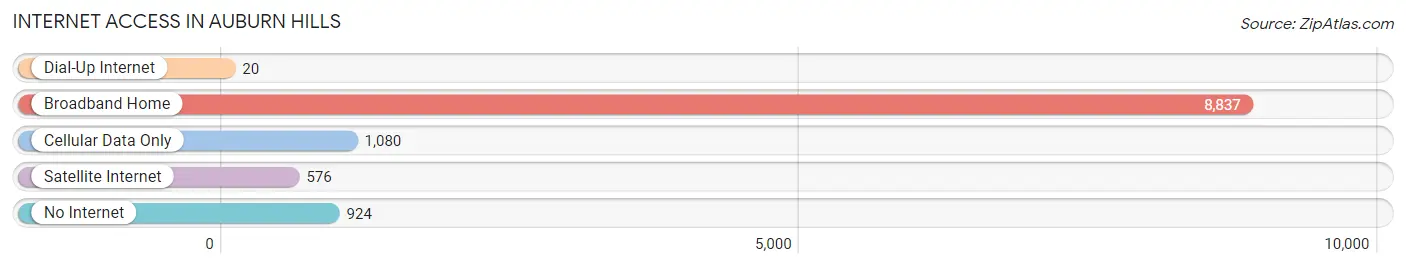
| Internet Type | # Households | % Households |
| Dial-Up Internet | 20 | 0.2% |
| Broadband Home | 8,837 | 79.0% |
| Cellular Data Only | 1,080 | 9.7% |
| Satellite Internet | 576 | 5.1% |
| No Internet | 924 | 8.3% |
| Total | 11,181 | 100.0% |
Auburn Hills Summary
Auburn Hills, Michigan is a city located in Oakland County, Michigan. It is a suburb of Detroit and is part of the Metro Detroit area. The city was incorporated in 1983 and has a population of 21,412 as of the 2010 census.
History
The area that is now Auburn Hills was originally inhabited by the Potawatomi Native Americans. The first European settlers arrived in the area in the early 1800s. The area was originally known as "Ishpeming" and was part of Pontiac Township. In 1821, the area was renamed Auburn and was part of Bloomfield Township. In 1823, the area was split off from Bloomfield Township and became part of Auburn Township.
In 1873, the area was renamed Auburn Hills and was incorporated as a village. The village was reincorporated as a city in 1983. The city was named after the Auburn Automobile Company, which was founded in Auburn Hills in 1900. The company was the first to manufacture cars in the United States.
Geography
Auburn Hills is located in Oakland County, Michigan. It is situated on the banks of the Clinton River and is bordered by the cities of Pontiac, Rochester Hills, Troy, and Bloomfield Township. The city has a total area of 16.2 square miles, of which 16.1 square miles is land and 0.1 square miles is water.
Economy
Auburn Hills is home to a variety of businesses and industries. The city is home to the headquarters of several major corporations, including Chrysler, Continental Automotive Systems, and BorgWarner. The city is also home to several automotive suppliers, such as Delphi, Lear Corporation, and Magna International.
The city is also home to several shopping centers, including Great Lakes Crossing Outlets, The Village of Rochester Hills, and The Mall at Partridge Creek. The city is also home to several parks, including Auburn Hills Community Park, Auburn Hills Nature Park, and Auburn Hills Golf Course.
Demographics
As of the 2010 census, the population of Auburn Hills was 21,412. The racial makeup of the city was 79.2% White, 11.3% African American, 0.3% Native American, 4.2% Asian, 0.1% Pacific Islander, 1.7% from other races, and 3.3% from two or more races. Hispanic or Latino of any race were 4.7% of the population.
The median income for a household in the city was $63,945, and the median income for a family was $76,945. The per capita income for the city was $31,945. About 4.2% of families and 6.2% of the population were below the poverty line, including 8.2% of those under age 18 and 4.2% of those age 65 or over.
Common Questions
What is Per Capita Income in Auburn Hills?
Per Capita income in Auburn Hills is $44,309.
What is the Median Family Income in Auburn Hills?
Median Family Income in Auburn Hills is $99,800.
What is the Median Household income in Auburn Hills?
Median Household Income in Auburn Hills is $77,724.
What is Income or Wage Gap in Auburn Hills?
Income or Wage Gap in Auburn Hills is 44.7%.
Women in Auburn Hills earn 55.3 cents for every dollar earned by a man.
What is Inequality or Gini Index in Auburn Hills?
Inequality or Gini Index in Auburn Hills is 0.42.
What is the Total Population of Auburn Hills?
Total Population of Auburn Hills is 24,593.
What is the Total Male Population of Auburn Hills?
Total Male Population of Auburn Hills is 12,420.
What is the Total Female Population of Auburn Hills?
Total Female Population of Auburn Hills is 12,173.
What is the Ratio of Males per 100 Females in Auburn Hills?
There are 102.03 Males per 100 Females in Auburn Hills.
What is the Ratio of Females per 100 Males in Auburn Hills?
There are 98.01 Females per 100 Males in Auburn Hills.
What is the Median Population Age in Auburn Hills?
Median Population Age in Auburn Hills is 35.2 Years.
What is the Average Family Size in Auburn Hills
Average Family Size in Auburn Hills is 2.9 People.
What is the Average Household Size in Auburn Hills
Average Household Size in Auburn Hills is 2.1 People.
How Large is the Labor Force in Auburn Hills?
There are 14,876 People in the Labor Forcein in Auburn Hills.
What is the Percentage of People in the Labor Force in Auburn Hills?
69.1% of People are in the Labor Force in Auburn Hills.
What is the Unemployment Rate in Auburn Hills?
Unemployment Rate in Auburn Hills is 5.1%.